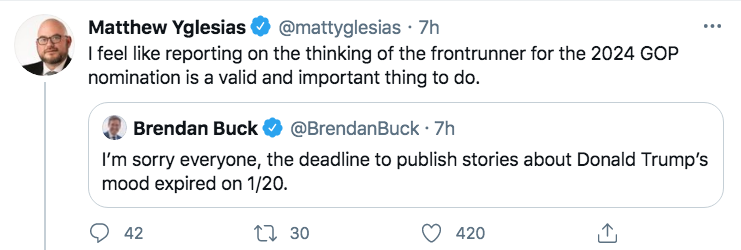
1. Peter Navarro claims that Trump is almost unbelievably incompetent when picking advisors:
Former President Donald Trump’s onetime trade adviser Peter Navarro hatched yet another wild conspiracy theory Sunday, claiming to Fox Business host Maria Bartiromo that Bill Barr, the former president’s own hand-picked attorney general, was part of a “deep state coup” against him.
It was difficult to follow Navarro’s reasoning. But he claimed that “Bill Barr, Donald Trump’s attorney general, actually turns out to be Joe Biden’s first attorney general.”
2. Scott Gottlieb suggests that vaccines will be available to almost everyone (in America) who wants them by the spring. If so, the economy should be booming by summer, regardless of whether there is fiscal stimulus or not.
Washington politicians are like generals fighting last war . . . er . . . last recession.
3. The NYT says the left doesn’t know how to deliver vaccines.
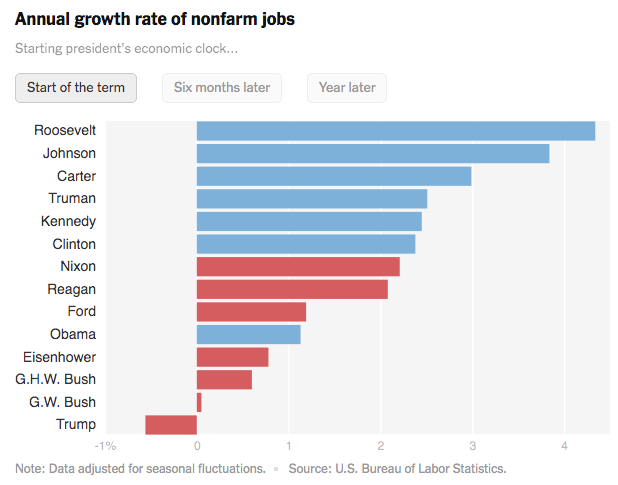
4. The NYT says that Democratic presidents do better in terms of both real GDP growth and job growth:
That’s true, but it’s not because of the economic policies pursued by Democratic administrations. To suggest otherwise is like saying that Tom Brady “beat” Aaron Rodgers in a game where Brady had a QB ranking of 73.8 despite facing no pass rush pressure while Rodgers had a rating of 101.6 despite dropped passes and an overwhelming pass rush from the Tampa Bay line.
And US presidents have far less effect on outcomes than do NFL QBs.
Trump is the worst president ever, but this fact has nothing to do with the fact that he’s dead last among post-1932 presidents in both jobs growth and RGDP growth.
5. Commenter “tpeach” directed me to a very good Atlantic article pointing out how the US government lies about China’s debt policies in the developing world:
The Chinese ‘Debt Trap’ Is a Myth
The narrative wrongfully portrays both Beijing and the developing countries it deals with.
Ironically, these false administration claims are the same sort of argument that used to be made by Marxist intellectuals when attacking the US. It was claimed that our international investment was “exploiting” third world countries. Sigh . . .
Back in 2010, I did a blog post expressing skepticism about theories that China was in a bubble. I quoted this statement:
Faber joins hedge fund manager Jim Chanos and Harvard University’s Kenneth Rogoff in warning of a crash in China.
China is “on a treadmill to hell” because it’s hooked on property development for driving growth, Chanos said in an interview last month. As much as 60 percent of the country’s gross domestic product relies on construction, he said. Rogoff said in February a debt-fueled bubble in China may trigger a regional recession within a decade.
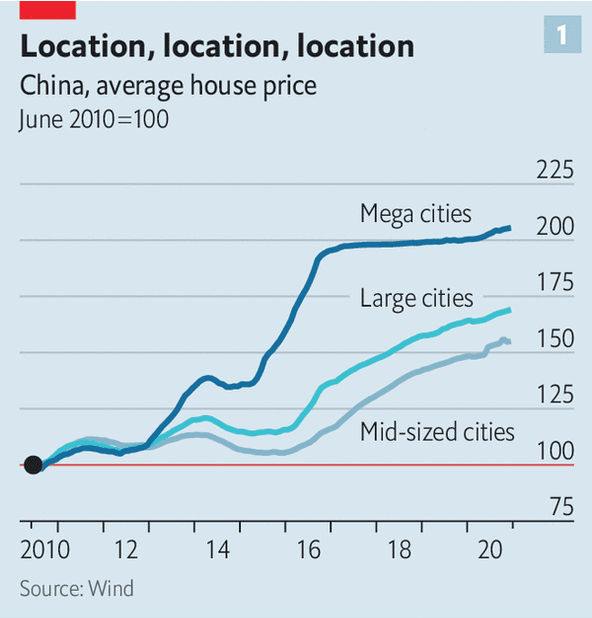
So how does that prediction look 11 years later? The Economist has a new article on China property. In the print edition, it is titled:
The Great Escape
Long seen as a bubble, China’s housing market now looks stable. Can that hold?
The country is building five times as many houses as America and Europe combined
(I prefer their print editor.)
Both editions point to past predictions that have not panned out:
As far back as 2009 Jim Chanos, a hedge-fund manager, said China was “Dubai on steroids”, predicting that its property sector would implode spectacularly. Since then prices have doubled, and enough homes have been built for 250m people. The longevity of the boom suggests that the market is more complex than its depictions as a bubble suggest.
And they provide this useful this graph:
Are you people getting tired of me pointing out, over and over again, how bubble theories are useless? How past bubble predictions for everything from China to Bitcoin to NASDAQ to US real estate are not helpful to investors?
Then stop talking about bubbles.
The beatings will continue until the bubble talk stops.
PS. In a 2016 post I made the following prediction:
If I’d had to guess, I’d estimate that China will have one Korea-1998 type disaster in the next 30 years, but I have no idea when. It will be impossible to predict. That’s because if it could be predicted three years ahead, then the date of the crash would immediately move up by three years!
So don’t hold your breath for a China crash. It will probably happen at some point, but no one will be able to predict it. Nonetheless, you can be sure that Jim Chanos and other China bears will take credit for predicting it, even though they were wrong many times before being right.
P.S. In a 30 year window, I think the second most likely number of 1998-type disasters for China is zero. Two is third most likely.
PPS. In the same issue of The Economist, I saw this claim:
If low real rates are the main prop for share prices, then any attempt to time the stockmarket is in essence a bet on the bond market—and, in turn, on how inflation evolves, and how central banks react to it. Good luck with getting those calls right.
OK, I’ll take the dare. I’ll predict 2% inflation during the 2020s. Wish me luck. If I’m right I’ll remind you all in 2030.
(If I’m still alive. I’m more confident about inflation averaging 1.6% to 2.4% during the 2020s than I am about living to 75.)
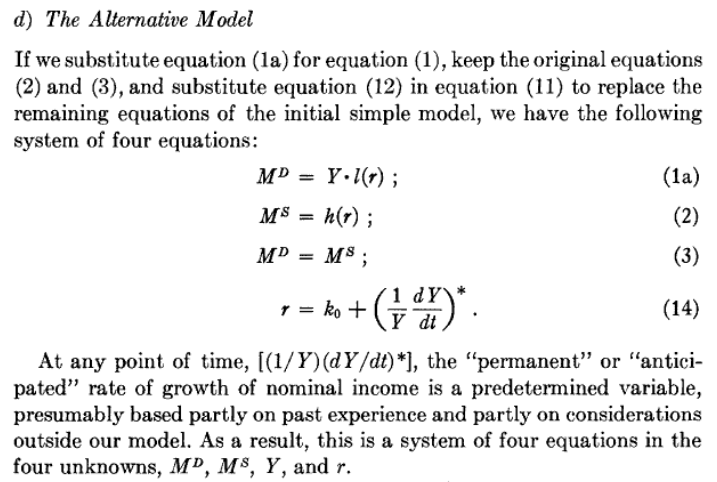
Marcus Nunes directed me to a very interesting 1971 paper in the JPE by Milton Friedman. Here is the abstract:
Market monetarists also prefer to skip over inflation and RGDP growth, and focus directly on NGDP growth. Once you start ignoring inflation, you have to rethink concepts such as the Fisher equation, which states that the nominal interest rate is the real rate plus inflation. I’ve advocated replacing inflation with NGDP growth, and Friedman does the same in equation 14:
The variable “ko” in equation 14 is the difference between the real interest rate and the real GDP growth rate, and “r” is the nominal interest rate.
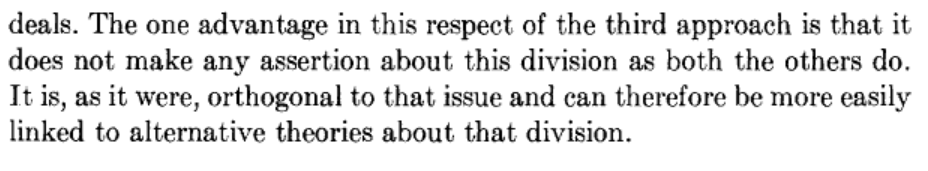
The following is my favorite sentence, which discusses how NGDP shocks are divided up between prices and output:
The two alternative approaches he refers to are the simple quantity theory (which assumes RGDP is fixed) and the simple Keynesian income/expenditure model, (which assumes P is fixed.) An NGDP model makes no assumptions about how NGDP shocks are partitioned between prices and output.
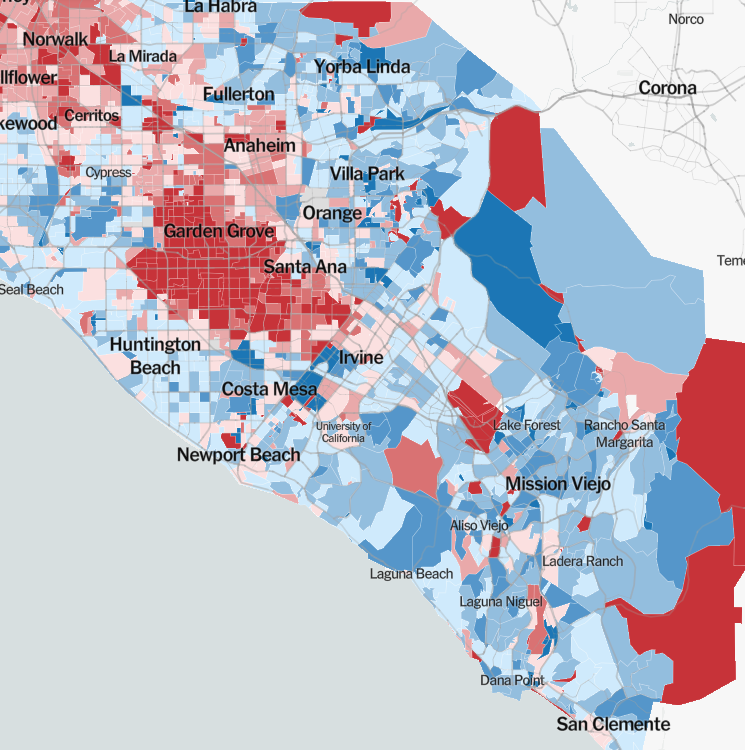
The NYT put together an interesting interactive map that shows very detailed vote totals for much of the US, both totals and changes from 2016. I noticed some really odd patterns.
In my own Orange County, Biden won by about 10%, a 5% gain for the Dems compared to 2016. And yet one area of Orange County swung dramatically toward Trump—Little Saigon. Areas of Westminster and Garden Grove with a large Vietnamese-American population moved 30%, 40% even 50% from the Democrats to the Republicans between 2016 and 2020.
In this map, red means trended toward Trump and blue means trended toward the Dems. They are vote changes, not absolute vote totals:
(Ignore the large precincts, they are mostly wilderness.)
Right before the election, Vox did a story discussing increasing support for Trump in the Vietnamese community, and how this was tearing families apart:
For others, it’s a breaking point in family relations, in light of the nationwide protests against racism and police brutality. I’ve heard anecdotally, online, and from my own family members that they are worried about “anarchy” and wish for “law and order” to be restored. Misinformation on social media fuels these fears, often playing into anti-Black tropes. Some children have moved out or stopped talking to their parents entirely.
“My frustration toward the older generation of Vietnamese Americans being entitled, hypocritical, racist, homophobic, transphobic, misogynistic, and every other kind of bigotry under the sun, has more or less boiled over into nothing short of pure disdain,” one user wrote in the Facebook group Asian Americans with Republican Parents Support Group. “It’s gotten to the point where I flat out don’t care about what they think of me or say to me.”
Comments responding to the post agreed, with another user writing, “I’ve given up trying to educate them on the matters. … They’re so far up Trump’s ass, it feels impossible to take them out.”
A common joke among young Viet progressives is that you’re bound to be called a communist, or cộng sản, once you openly express any left-leaning political views. And yet, I find that there is something uniquely cruel about this political divide among a war-torn generation and their children, that beyond the language and cultural barriers that already alienate older Vietnamese Americans, there is now a stark political wedge rooted in hate, misunderstanding, and trauma.
But I expected a 5% or 10% swing vs. 2016, not 40%.
I used to live in Massachusetts, and on the map for that state almost everywhere shifted Democratic between 2016 and 2020, with two exceptions. Hispanic areas in old mill towns swung sharply toward Trump, as did African-American areas in the southern portion of Boston.
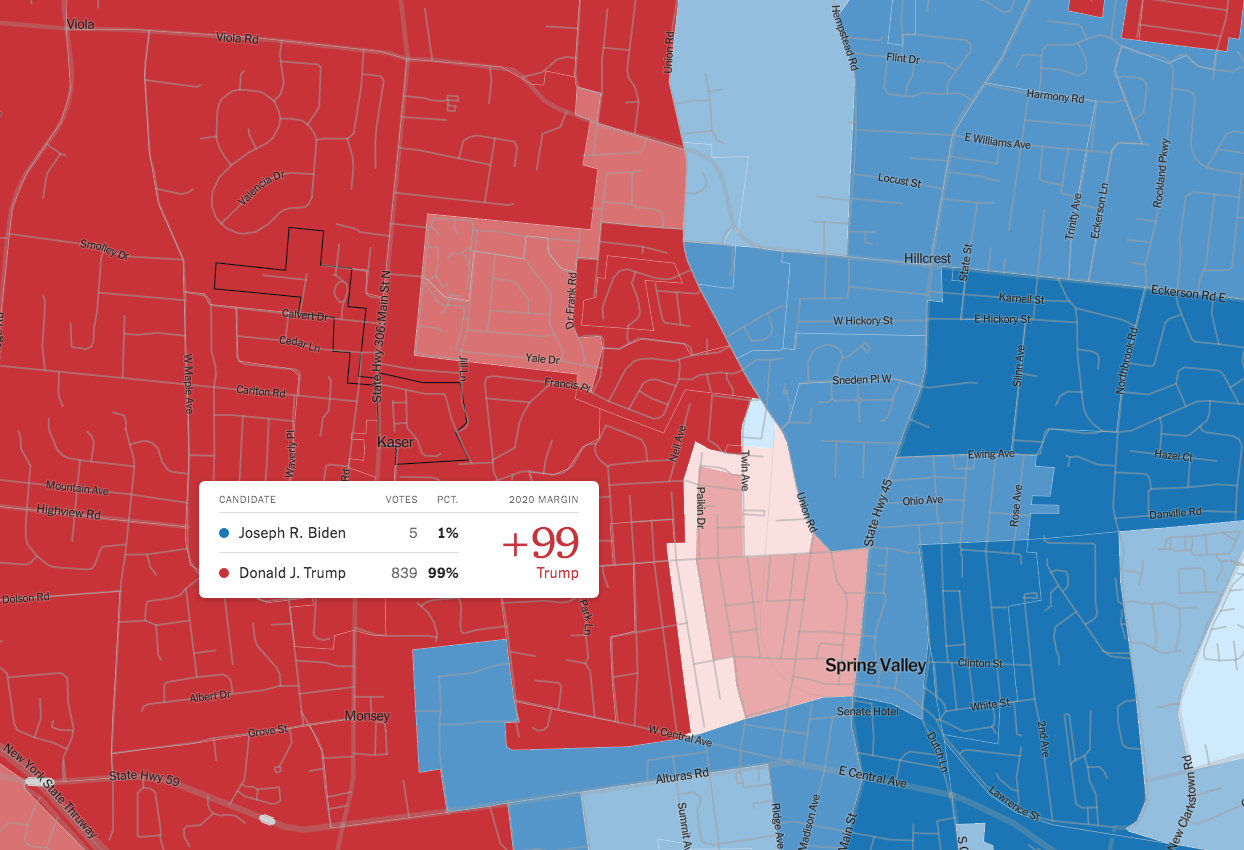
Perhaps the weirdest result I noticed was in Kaser, just north of New York City in Rockland County. Consider the following facts, and tell me how you’d expect it to vote:
1. Kaser is the densest city in America, outside of New Jersey. (Dense areas trend strongly Democratic.)
2. It’s extremely poor. Wikipedia reports that 66.4% of residents are below the poverty line, and per capita income is barely over $5000. Bolivia on the Hudson. Poor people tend to vote for the Democrats.
3. It’s overwhelmingly Jewish, a group that votes strongly Democratic.
I don’t know the exact boundaries of the town, but as far as I can tell over 99% of the roughly 3000 Kaser voters opted for Trump, and less than 1% for Biden. To put that 100 to 1 figure in perspective, even supposedly “monolithic” African-American voters are only about 10 to 1 Democratic.
The region around Kaser also went for Trump in 2016, but nowhere near as overwhelmingly as in 2020. So 2020 was not normal. I pity the Kaser resident with a Biden yard sign.
(Someone should investigate! Just kidding.)
And just one mile away are deep blue areas. Rockland County has to be one of the most polarized areas in the US.
The graph below shows just one precinct in Kaser (in absolute terms), but vote totals in nearby areas are just as lopsided.
PS. Mission Viejo (where I live) went from red in 2016 to purple in 2020.
Welcome to a new blog on the endlessly perplexing problem of monetary policy. You’ll quickly notice that I am not a natural blogger, yet I feel compelled by recent events to give it a shot. Read more...
My name is Scott Sumner and I have taught economics at Bentley University for the past 27 years. I earned a BA in economics at Wisconsin and a PhD at Chicago. My research has been in the field of monetary economics, particularly the role of the gold standard in the Great Depression. I had just begun research on the relationship between cultural values and neoliberal reforms, when I got pulled back into monetary economics by the current crisis.
"Couldn't find the substack and if it's moderated just as well... Voted for Trump and he won. Sorry liberal Scott Sumner who believes in money non-neutrality, which is akin to..."
"Scott, Quick note of thanks. I've hugely enjoyed your blog and the intellectual stimulation I gotten from it. Also it was pleasure getting to know you and your wife. Hope..."