Archive for the Category Labor markets


Should we target total wages or average hourly wages?

This post was inspired by a recent Nick Rowe post, which uses an AS/AD diagram to compare inflation and NGDP targeting under various sorts of shocks.  I learned some things from reading the post, and George Selgin’s comments following the post.  I recommend people take a look.  But in the end I find sticky price models too confusing.  Or maybe I just don’t have the energy to try to get over my confusion, because price stickiness doesn’t seem to me to be the key issue.  For me, business cycles are all about employment fluctuations and wage stickiness.

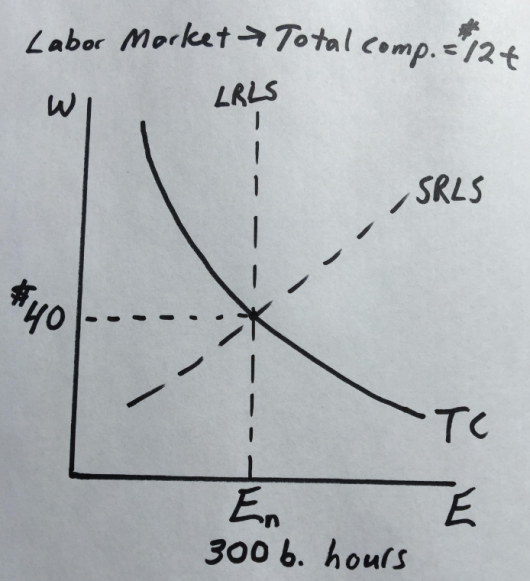
Let’s start with a graph where (for simplicity) we assume a vertical long run labor supply curve (LRLS), and an upward sloping short run labor supply curve (SRLS).  Total compensation (TC) is a rectangular hyperbola, representing $12 trillion in labor compensation.  I assume wages of $40 per hour (including benefits), and 300 billion total hours (2000 hours a year times 150 million workers.)  These are ballpark numbers for the USA.   The LRLS determines the natural rate of employment—which is optimal in the context of monetary policy decisions.

Screen Shot 2018-11-25 at 2.02.48 PMNow let’s consider two types of shocks.  In the first case, there’s a sudden 10% boost in the labor force, perhaps due to a flood of immigrants:

Screen Shot 2018-11-25 at 2.03.05 PM
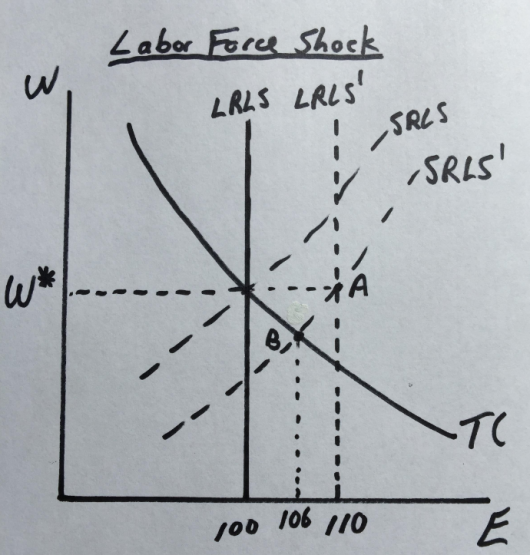
Notice that the optimal solution is a 10% rise in employment, with no change in nominal wages.  That’s what happens with nominal wage targeting.  Under total compensation targeting the employment level rises by only 6%, which is suboptimal.  NGDP targeting would be the same.  This example might help people to better understand George Selgin’s version of NGDP targeting, which adjusts for labor force changes.  (Nothing changes if we assume a positive trend rate for wages that is fully expected.)

Now let’s consider a nominal wage shock.  Say that workers get greedy and demand higher wages, because Bernie Sanders is elected President.  But the LRLS doesn’t shift, which means the workers will eventually scale back their wage demands, at least in real terms:

Screen Shot 2018-11-25 at 2.03.32 PM
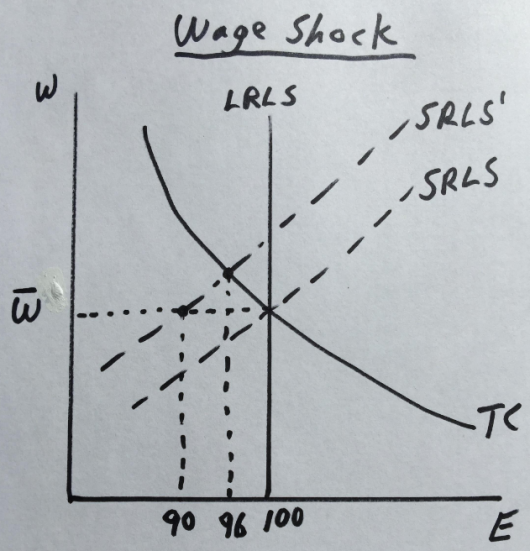
This case is just the opposite.  Now a monetary policy aimed at stabilizing total compensation gives you a better result.  With nominal wage targeting, employment falls by 10%, relative to an unchanged LRLS curve.  With total compensation targeting (and perhaps NGDP targeting as well) the fall in employment is smaller (only 4%).

In my view, the most pragmatic option is to try to target total compensation (or NGDP), adjusted for changes in the labor force, which is sort of in the spirit of George Selgin’s proposal.  As I recall, he wanted a productivity norm that adjusted NGDP for both labor force and capital shock changes, but I don’t recall the exact details.  Because I see the labor market as key, I’ve left out the capital stock issue, which seems secondary to me.  But his basic intuition seems exactly right.

PS.  It’s likely that this is nothing new, or maybe it’s wrong.  It’s a framing that occurred to me after reading Nick’s post.  I welcome any comments you might have.

PPS.  I had the honor of writing a forward for the brand new addition to George’s Less Than Zero.

PPPS.  Don’t be discouraged if all this theoretical analysis makes NGDP targeting seem “wrong”.  It’s less far less wrong than anything else on offer from the major schools of thought in macroeconomics—close enough to optimal for the USA.

PPPPS.  I didn’t look at productivity shocks, because they affect the optimal price level, not the optimal wage rate.

Nothing like the 1960s?

Commenter Michael Sandifer left this comment:

One key difference between the current period and ’66 is that inflation is tame.

He’s referring to our relatively low inflation:

Screen Shot 2018-10-11 at 10.00.17 AMOver the previous 6 years, unemployment has fallen from 8% to 3.7%.  Inflation has mostly stayed in the 1% to 2% range, occasionally dipping below 1%, and recently rising above 2%.

In contrast, here’s the picture as of mid-1966:

Screen Shot 2018-10-11 at 10.02.27 AMIn this case, unemployment rose to a peak of 7% in 1961, then gradually trended down to 3.8% in mid-1966.  Inflation mostly stayed in the 1% to 2% range, occasionally dipping below 1%, and recently rising above 2%.

Hmmm, that sounds familiar.

I don’t expect the next 3 years to look anything like the late 1960s.  But if we are to avoid a repeat of the 1960s, it will not be because the current situation is radically different from 1966, it will be because we take steps right now to make sure than the future situation is radically different.  And that requires a dramatically less expansionary monetary policy that what the Fed adopted in 1966-69.

In the 1960s, the Fed tried to use monetary policy to drive unemployment to very low levels.  Let’s not make that mistake again.  Better to produce stable NGDP growth, and let unemployment find its own natural rate.

Recent articles

I have three new pieces that just came out. At The Hill, I have an article that discusses wages:

On Friday, the government announced average hourly wage growth for October, which came in at an annual rate of 2.8 percent.

The case was similar in September, and the media reported that Fed officials may react by tightening monetary policy. Not surprisingly, this puzzles lots of people: Shouldn’t we welcome higher wages, especially after decades of sub-par wage growth?

The short answer is that we should welcome higher “real” wages, but the Fed does have reason to be concerned about higher “nominal” wages. . . .

It’s true that printing lots of money can lead to higher nominal wages. However, as workers in places like Mexico and Argentina have discovered, if productivity is stagnant, then large nominal pay raises do not translate into higher real wages.

The recent 2.8 percent average hourly wage growth doesn’t pose a large threat, but the Fed has good reasons to be wary of a steep upsurge in nominal wage growth.

At Mercatus, I have a new policy report discussing the Hypermind NGDP prediction market:

It is difficult to understand why it took so long for an NGDP prediction market to be created, as NGDP is probably the best single indicator of whether monetary policy is too expansionary or too contractionary. Given that the Fed has already expressed an interest in TIPS spreads, it likely would be equally interested in market forecasts of NGDP growth.

Had this market been in existence during 2008–2009, it might well have provided valuable signals to the Fed. After all, even Ben Bernanke admits that the Fed erred in September 2008, when it refused to cut its target interest rate from 2 percent right after Lehman failed. At the time, TIPS market expectations of inflation were much lower than Fed forecasts. But NGDP growth expectations are even more informative about the state of the economy than inflation expectations.

In the end, the Hypermind NGDP prediction market is a sort of demonstration project. One would hope that the Fed will set up its own (better-funded) NGDP futures market, which could help it to make more informed policy decisions. The cost would be trivial relative to the potential gains from more effective monetary policy.

At The Bridge, I have a piece pointing out that monetary policy is becoming increasingly accommodative:

Thus whether you judge policy solely by considering inflation, or both inflation and employment, you reach the same conclusion. Policy was too restrictive to hit both the Fed’s inflation target and its employment target during 2009-16, and policy is now relatively accommodative, with inflation above the two percent target and the unemployment rate below the 4.0 percent to 4.6 percent range that the Fed views as “full employment”.

The fact that monetary policy is increasingly accommodative does not necessarily imply it is too accommodative. The Fed needs to look beyond the current data and forecast the impact of its policy on the future condition of the economy. Inflation has recently been pushed up by a sharp rise in oil prices, and it’s possible that it may fall back below two percent during 2019. Even so, the balance of risks has recently shifted, and the long period of excessively restrictive monetary policy is over.


Where are these jobs coming from?

As always, the jobs market remains a bit of a mystery. If you think you have an explanation for the recent jobs growth, I’m about to show you that you are wrong. (Notice I didn’t say “US jobs market”, which is already a clue that the mystery is even deeper than we imagine.)

Job growth has been running at around 200,000 per month, and the unemployment rate has fallen to 3.7% (lowest since the 1960s.) It’s best to start with the accounting, which basically involves three factors: population growth, the labor force participation rate and the unemployment rate. You can use prime age labor force participation, but that makes things more complicated and also misses the growth in older workers.

In the last few years, employment has been growing faster than predicted by growth in adult population, which can only mean that either adult labor force participation is rising, or the unemployment rate is falling.  It’s not labor force participation, which was falling and then leveled off some time around 2014 or 2015 (it’s hard to be precise, as the data is noisy.)

Screen Shot 2018-10-05 at 12.13.42 PM

Some people might start screaming that I’m ignoring the aging of the population.  I’m not.  It’s true that the population is aging, and it’s true that this means the leveling off of LFPC rate is actually a very good thing; it shows participation is rising among prime age workers.  It might even show that Trump is the greatest president in history.  But it does not explain the recent growth in employment.  It simply suggests that we should be doing less bad than the aging alone would predict.

To fully explain the recent growth in employment (of 200,000/month) in an accounting sense, you need to look at the unemployment rate, which has fallen to shocking low levels:

Screen Shot 2018-10-05 at 12.09.19 PMA couple years ago, I expected employment growth to slow by now.  The main reason I was wrong is that I expected the unemployment rate to level off in the mid-fours, and it instead fell to 3.7%.  I don’t have any special ability to forecast, I was just going with the conventional wisdom:

In September 2016, for example, the median forecast of Federal Reserve officials was that the unemployment rate would be 4.5 percent at the end of 2018; it now looks likely to be substantially lower.

I also expected a tad worse performance for the LFPR, and rising prime age participation is part of the story.  But unemployment is the big mystery that needs to be explained.

There are two possible explanations for the very low unemployment—a fall in the natural rate, or a demand shock that pushes unemployment below the natural rate.  I would not completely rule out the latter, but Neil Irwin of the NYT points to a problem with demand-side explanations:

The even better news is that the last time the jobless rate was this low, at the end of 1969, it was already fueling high inflation. Consumer prices rose 5.9 percent that year. Currently, that measure is 2.7 percent.

In fairness, that 2.7% figure is consistent with somewhat of a demand boost, thus it’s not that different from the situation in 1966 (when inflation was about the same).  But on balance I don’t see much evidence that this is a demand-side issue, partly because the inflation figure includes recent oil price increases, and inflation forecasts continue to run at around 2%.  In a couple years we’ll have more perspective on this issue, but right now I’m going with the supply-side explanation, i.e. an unusual fall in the natural rate.  Later I’ll provide international evidence for that view.

I’ve been racking my brain for reasons why the natural rate of unemployment should have fallen to perhaps the lowest levels in history (actual unemployment was below the natural rate during the Korean and Vietnam Wars), but it’s not obvious what those are.  In a recent Econlog blog post, I discussed the fact that the federal minimum wage was now so low as to be almost meaningless.  But that affects only a small part of the labor force.  You could point to Trump initiatives like a corporate tax cut that boosted RGDP growth. But the same occurred during the Reagan boom, and yet the unemployment rate never fell below 5%, even after very strong RGDP growth spurred by tax cuts and deregulation.

At this point I look to other countries for assistance.  Europe has a very different unemployment pattern than the US.  During the post-WWII boom they had an extremely low natural rate, relative to the US.  During the 1980s and 1990s, their natural rate rose far above the US, even in Germany.  It remains elevated in France and southern Europe, but has recently fallen in the UK:

Screen Shot 2018-10-05 at 12.36.50 PMAnd in Germany:

Screen Shot 2018-10-05 at 12.37.26 PMSo there is modest evidence that this phenomenon of falling natural rates is affecting other countries.  Canada is a bit more ambiguous, with a higher natural rate than the US, but some evidence of a downward trend since the 1980s:

Screen Shot 2018-10-05 at 12.39.55 PM

I don’t have a good explanation for why Canada has a significantly higher natural rate than the US.  It may have a bigger welfare state, but the same is true of the UK and Germany.

So unemployment remains something of a mystery.  By the end of the Obama administration, unemployment had already fallen below the lowest levels of the Reagan boom (to 4.6% on November 2016), despite slower growth and less business friendly regulation.  So while I would not rule out the importance of supply-side policies, especially the tax cuts, I think a portion of the story remains unexplained.

Note that Germany and the UK have seen their unemployment rates fall dramatically to the 3.5% to 4% range, despite tight fiscal policies.  So Keynesians should be just as confused as supply-siders.  Fiscal policy has also gotten tighter under Abe, and Japan’s unemployment has fallen to 2.5% (although they’ve traditionally had very low unemployment.)

Before commenting, think about how your explanation fits the international pattern, and also the US time series going back to the 1940s.  It’s harder than you think.  BTW, we won’t be able to figure out the trend rate of growth in RGDP until we can observe a year of two of RGDP growth with a stable unemployment rate.  The wait continues. . . .

If you want an even longer time series, there’s a UK graph going back to 1760, when unemployment was 3.63%.  (Love that precision!)

Screen Shot 2018-10-05 at 12.48.50 PM

Happy talk on the economy

In 2016, conservative commentators told us that Trump was doing well because the economy was performing so poorly, especially for average Americans.  Trump said the same thing, using terms like “American carnage” in his inaugural address.  Now we are told that the economy is doing well.  Here’s Jim Geraghty of the National Review:

If the economy is still humming like this in November, and incumbent Republicans perform badly in the midterms, it will blow up the conventional political wisdom of, “it’s the economy, stupid.” Those of us who are not fans of the daily drama and perpetual controversies of this White House will have evidence to support the argument that Trump’s tweets and tirades are not just silly distractions; they’re enough to counteract what would be a key political strength for most administrations.

And of course Trump engaged in his usual hyperbole in his recent State of the Union.

I’m going to try to bend over backwards to be fair to both sides.  I think you can make a reasonable argument for each of the assertions made above, for 2016 and 2017.  What you cannot do is simultaneously claim that both assertions are true.  After all, jobs were the key issue that people used in 2016, when describing the plight of average Americans.  And job growth in 2017 actually reached the lowest levels in years (the graph shows year over year percentage change in payroll employment):

That’s not a bad performance, just no sign that the jobs crisis we were told about in 2016 has been solved.  Remember when Trump said the “true” unemployment rate was anywhere from 20% to 40%?  His supporters can’t now claim that job growth slowed in 2017 because we are running out of workers.

Inevitably, some commenters will misread this post.  They’ll accuse me of saying the economy is not doing very well, even though I never said the economy is not doing very well.

Or they’ll cherry pick other indicators.  Some, such as stock prices, are of no relevance to this post.  Stocks did extremely well under Obama, and obviously were not a part of the economic “carnage” that Trump referred to in January of last year. Some will point to other indicators.  But for every indicator that’s gotten modestly better in 2017 (RGDP) you can find another that’s gotten modestly worse (from a Trumpian perspective):

That means that the final 2017 U.S. deficit with China/HKG may be up 17%-18% from the $280 billion consolidated China/HKG deficit recorded for 2016.

If you believe the Autor, Dorn and Hanson study of the impact of China trade, (or perhaps I should say how it’s been interpreted, their claims are more nuanced); this is really bad news for the US economy, and especially for the blue collar Trump voters.  As Forbes correctly notes, however, our ballooning trade deficit with China is actually good news for the US economy (and, I would add, even for Trump voters.)  Another way of putting it is that the entire Trump campaign was built on misinformation, and that’s really, really good news.  (And I’m not going to exempt the conservative intellectual establishment (especially non-economist intellectuals), which to some extent bought into the claims that trade was hurting average Americans.) So which is it?  Is the trade deficit with China a big problem?  Or is the economy doing better?  Trump would say both, but you can’t have it both ways.

I think people need to stand back and look at things objectively, the view from 30,000 feet.  When you do so you see an economy that is gradually growing, a bit better than in 2016 (in my view due to better public policies), but not dramatically different from what was occurring during recent years.

Why does this matter?  After all, everyone entitled to describe the economy any way they wish.  The problem occurs when you start to make inferences about things like the midterm elections.  Notice that Geraghty suggests that if the economy is the deciding issue, the GOP should do well in 2018.  But if that were the case then the Democrats should have done well in 2016.  His post is written as if the stuff that Trump says, or that gets reported on Fox News, is actually true.  But it’s not true.  The economy is not that much different from a year ago.

PS.  The problem of bias reminds me of a wonderful Eliezer Yudkowsky post of fairness:

The notion that you can “be fair to one side but not the other”, that what’s called “fairness” is a kind of favor you do for people you like, says that even the *instinctive* sense people had of law-as-game-theory is being lost in the modern memetic collapse. People are being exposed to so many social-media-viral depictions of the Other Side defecting, and viewpoints exclusively from Our Side without any leavening of any other viewpoint that might ask for a game-theoretic compromise, that they’re losing the ability to appreciate the kind of anecdotes they used to tell in ancient China.

Unfortunately, the post is hard to excerpt–you really need to read the whole thing.

PPS.  Hypermind is currently forecasting 4.6% NGDP growth from 2017:Q1 to 2018:Q1.  If my math is correct, that implies about a 4% annualized growth rate in the first quarter of 2018.  The implied RGDP forecast is probably about 2%, or a bit higher.  The Blue Chip consensus has first quarter RGDP growth coming in around 2.6%.  But the Atlanta Fed is forecasting 5.4% RGDP growth in Q1.  It will be an interesting quarter to watch.

HT:  Craig Fratrik