Archive for March 2011


Connect the dots

Part 1:  A new study by Martin Feldstein estimated that QE2 created an extra $2.5 trillion in stock market wealth for Americans.  It should be noted that foreign markets also rose sharply in anticipation of QE2, so my $5 trillion estimate from last year for world gains may be on the low side.  (US stock wealth is about $17 trillion; world stock wealth is closer to $50 trillion.)

To be sure, there is no proof that QE2 led to the stock-market rise, or that the stock-market rise caused the increase in consumer spending. But the timing of the stock-market rise, and the lack of any other reason for a sharp rise in consumer spending, makes that chain of events look very plausible.

The magnitude of the relationship between the stock-market rise and the jump in consumer spending also fits the data. Since share ownership (including mutual funds) of American households totals approximately $17 trillion, a 15% rise in share prices increased household wealth by about $2.5 trillion.

I conservatively assumed a 10% gain on $50 trillion, whereas Feldstein assumed 15% on $17 trillion.  Either way, the world gained a lot of wealth.

Part 2:  In August (right before rumors of QE2) Paul Krugman argued that pressure from outside pundits was one of the only ways to move that stubborn mule called the Fed:

So why am I even slightly encouraged? Because the critics did, at least, succeed in moving the focal point. Not long ago gradual Fed tightening was the default strategy; but as I said, at this point the Fed realized that continuing on that path would have unleashed both a firestorm of criticism and a severe negative reaction in the markets.

What we need to do now is keep up the pressure, so that at the next FOMC meeting the members are once again confronted by the reality that not changing course would be seen as dereliction of duty. And so on, from meeting to meeting, until the Fed actually does what it should.

I know: it’s a heck of a way to make policy. In a better world, the Fed would look at the state of the economy and do what was right, not the minimum necessary. But wishing for that kind of world is like wishing that Ben Bernanke were running the place.

And it worked!

Part 3:  Last month Ryan Avent published the following observation over at The Economist.com:

I SEE that Scott Sumner is taking a victory lap of sorts””not unearned””over the fact that views of monetary policy have come full circle since the years before the crisis. Once upon a time, the Fed was viewed as having near-absolute power over the path of the economy. Then crisis struck and many argued that the Fed had run out of ammunition and fiscal policy was required. Eventually people began arguing that the Fed could do more and should do more, thanks largely to the efforts of Mr Sumner himself.

“So what you’re saying is . . .”

I’m not saying anything, just reporting news from the blogosphere.

Part 4:  Off topic, but I am complete burned out, and have been for months.  I’ve blogged an average of eight hours a day, seven days a week, for over two years.  I’ve only kept going in recent months out of a sense of obligation to keep pushing these issues.  But now that lots of other people are saying the exact same thing, it’s time for me to take a break.  So I’ll stop blogging for a few months, unless there is some huge news story like QE3, in which case I’ll add a couple posts.  Or if someone does a hit job on my marshmallow post, I may need to briefly respond.  Otherwise I’m done for now, and will return sometime this summer.

I hoped my school would give me some support for blogging, but that’s not how things work in the real world.  Perhaps I could find a way to make some money and buy out a few courses.  I was thinking about ideas like writing a macro version of Freakonomics, or doing speaking engagements, or perhaps even consulting.

Please don’t tell me that so and so does even more blogging than me while teaching; I’m not so and so.   Here are a few reasons I’m taking a break:

1.  Like corrupt politicians resigning under pressure, I need to “spend more time with my family.”  Indeed I might want to spend a few minutes with my 11 year old before she graduates from high school.  And then there is my long-suffering wife.

2.  More time to actually read a few books for pleasure, or see some films.

3.  I do have a job.

4.  The blog has spun off a lot of activities that you don’t see.  I read lots of papers that people send me, do more speaking than before, conferences, etc.  I hope to get my book out this year.  Maybe I can write some papers.

I thought about cutting back, but blogging is like a drug addiction for me—it won’t work.  Better to go cold turkey for a while.

Of course all the other quasi-monetarists (Rowe, Beckworth, Woolsey, Hendrickson, Kantoos, etc) will continue to cover the same sort of topics that I discuss.  On the progressive side, Yglesias is very good on money.  Don’t overlook Marcus Nunes, who contributed greatly to my blog, and also has his own blog now.  His views on monetary policy are quite close to mine.

I suppose I naively thought that if my blog was successful then support would magically turn up somewhere.  But let’s face facts, most people outside the blogosphere view what we do as a cute hobby, like growing miniature Bonsai trees, or raising chinchillas for fun and profit.  For all you young academics out there, the “Wisconsin Idea” is dead; it’s all about the pubs.  But do it anyway; it’s the right thing to do.

PS.  You’re probably thinking Avent exaggerated this blog’s importance by a factor of 100, because he’s a nice guy.  I agree.  So go redo the math and tell me what I’m worth.

PPS.   I’ll occasionally look at the comment section.   Long-time commenters can always ask me questions about current events, and I’ll try to give a quick reaction.

PPPS.  Christina Romer is now my official spokesperson on all matters relating to monetary policy and payroll taxes.

Progressive wishful thinking

Progressive bloggers have many admirable characteristics.  They try to rely on real science, not junk science.  They look for public policies that reduce suffering.  But when it comes to government they often become slightly unhinged, adopting the sort of “faith-based” reasoning that they tend to deride in conservatives.  Recently I’ve notice three blog posts by Greg Mankiw that (directly or indirectly) challenged progressive faith in big government.  All were derided by progressive bloggers, but in each case Mankiw was clearly right.

Part 1.  In May 2010 Greg Mankiw reported some data on tax revenue per person in some big economies.  From that data I’d guess that the US and European tax systems raise roughly equal amounts of revenue per person, even though US taxes are slightly less than 30% of GDP, and European taxes are closer to 40% of GDP.

Mankiw didn’t even comment on the data, he merely reported it.  But the post received all sorts of criticism, none of it valid.  I’d go much farther than Mankiw.  I’d argue that this data is strongly supportive of the view that both the US and Europe are near to tops of the Laffer Curve for total taxation.  I did not say then, nor do I claim now, that we are precisely at the top.  But I also don’t see any reason to believe that if we raised taxes from 28% to 40% of GDP, that revenue would rise anywhere near proportionately, with no change in GDP per capita.

The progressive response is that the Laffer Curve idea is far-fetched, and that higher tax rates don’t reduce GDP per capita.  Instead they argue that the lower European GDP/person represents mysterious cultural differences, a preference for leisure.  Even worse, this cultural trait developed only recently, as during the 1960s (when French tax rates were similar to those in America), they worked just as hard as we did.

All this may be true, but progressives can’t point to any European models (except perhaps special cases like Norway and Luxembourg) that raise the sort of revenue they claim the US would raise if we boosted taxes as a share of GDP to European levels.  For instance, in Mankiw’s data the Germans raise $13,893/person with taxes of 40.6% of GDP.  The US raises $13,097/person, with taxes of just 28.2% of GDP.  The progressive denial of the Laffer Curve is an implied claim that if we raised our tax rate to German levels, our GDP would not decline, instead we’d raise an astounding $18,856/person in tax revenue, despite the fact that no other major country with Euro-style tax rates comes close to raising that kind of revenue.  Quite a leap of faith.

Part 2:  Then Mankiw linked to a post showing the US tax system was more progressive than most other systems, again without much comment.  Once again progressives rushed in to attack his (implied) claim.  Matt Yglesias :

As I’ve long said, I think progressives do tend to overemphasize the importance of progressive taxation as opposed to adequate taxation. But people should have the facts. The rich pay a huge share of the total taxes in the United States because they have a huge share of the money.

And Brad DeLong:

Second, the U.S. income tax system is not more progressive than the systems of other industrialized nations. The rich in the U.S. pay a greater share of income taxes because the rich in the U.S. capture a greater share of income.

But these attacks were wrong, as anyone who has read the important work by Peter Lindert would immediately have known.  Lindert showed that Europeans were able to raise more tax revenue only by having more regressive tax systems than the US, i.e. tax systems that relied more heavily on consumption taxes.  This is now pretty much common knowledge in the public finance area.  But many American progressives keep insisting that we can get closer to the (egalitarian) European model by making the US tax system more progressive, by having the rich pay more.

There is a respectable counterargument to all this.  The regressivity of European taxes is offset by the much greater progressivity of their social insurance programs.  So the more thoughtful progressives (including Yglesias, and I’d guess DeLong) will often acknowledge that higher taxes on the middle class are also necessary, but then we can have a decent system of social insurance for the poor, plus high speed rail.  The problem with this argument is that we’ve just seen that it is not at all clear that the US can raise all that much more revenue.  If we raised our tax ratio to 40% of GDP, who’s to say we wouldn’t start working German-style hours?  This is double trouble for progressives.  Any attempt to raise more revenue will require much more regressive taxes, and that merely gets you a higher share of GDP, in absolute terms you probably wouldn’t raise much more revenue.

I have a different solution.  Recognize that $13,000/person is enough revenue (if used wisely) to provide for a decent society.  (Canada spends less.)  Stop spending $15,000/person on Medicare in counties like McAllen Texas, where per capita income is only about $15,000.  Decentralize everything and level the playing field by giving lump sum grants to counties based on per capita income levels in those counties.  Don’t try to raise lots more revenue, try to get much better results with the revenue we already raise.  Spend less on the military.  Use ideas from Singapore (which provides universal health care at a very low cost to the taxpayer.)

Part 3:  Progressives also seem to have excessive faith in fiscal stimulus, despite the fact that for decades our best macroeconomists have been saying that that fiscal stimulus is a bad idea.  These progressives counter that fiscal stimulus is needed because the Fed can do no more at zero rates, even as the very same progressives bash the Fed for not doing lots more at zero rates.  In March 2009 Greg Mankiw pointed out that the CEA growth projections for RGDP seemed to violate research showing a unit root in RGDP.  The CEA forecast negative 1.2% growth in 2009, and then roughly 4% a year out to 2013.  That’s a total of 15.6% RGDP growth between 2008 and 2013.

Paul Krugman had a scathing attack, arguing that you’d expect above trend growth during the recovery.  Greg Mankiw challenged Krugman to a bet, and Krugman refused.  I have no problem with that, as I don’t do bets on macro outcomes (I believe in targeting the forecast, so there is nothing to bet on in my view.  We immediately know all we need to know after policy initiatives.)  Nevertheless, we are now about half way through that 5 year period, and it is pretty obvious that Mankiw’s going to be roughly correct; total RGDP growth during 2008-13 will come in way under 15.6%.  For progressives, that was another triumph of hope over experience.

Brad DeLong recently linked to this John Berry post:

[O]n the local level, it seems even conservatives have no real doubt that federal spending can create jobs. What about at the national level?

The Congressional Budget Office certainly has no doubts about it. A CBO report last month said that provisions of the American Recovery and Reinvestment Act, the stimulus bill passed in early 2009, had the following effects in the fourth quarter of calendar year 2010:

  • Raised the level of inflation-adjusted gross domestic product by between 1.1 percent and 3.5 percent.
  • Lowered the unemployment rate by between 0.7 percentage points and 1.9 percentage points.
  • Increased the number of people employed by between 1.3 million and 3.5 million.
  • Increased the number of full-time-equivalent jobs by 1.8 million to 5.0 million as additional workers moved from part-time to full-time work.

I have a number of posts showing that Krugman, DeLong, Dean Baker, etc, all falsely claimed that evidence of regional growth after fiscal stimulus was evidence that the multiplier was greater than zero.  Of course that’s engaging in the fallacy of composition.  And what can one say about the CBO estimates?  They plug numbers into a model that simply assumes fiscal stimulus works, and the model tells us that fiscal stimulus did in fact work.  The modern macro models that were dubious of fiscal stimulus tended to assume central banks were engaged in inflation targeting, and hence would offset the fiscal stimulus.  But these pro-stimulus studies typically assume no monetary offset, despite the fact that the Fed recently adopted QE2 precisely because inflation was falling below their comfort zone.

Progressives believe that the US can raise lots more revenue, that the US tax system is not progressive enough, and that fiscal stimulus can work.  Those are all examples of the triumph of faith over reason.  Blind faith in government that can only lead to bad outcomes.

PS. Recently I’ve been way too nice to Mankiw.  Just to show he’s not bribing me, I’ll criticize him here for not being tougher on the Fed—not encouraging more unconventional stimulus.

Why Japan’s QE didn’t “work”

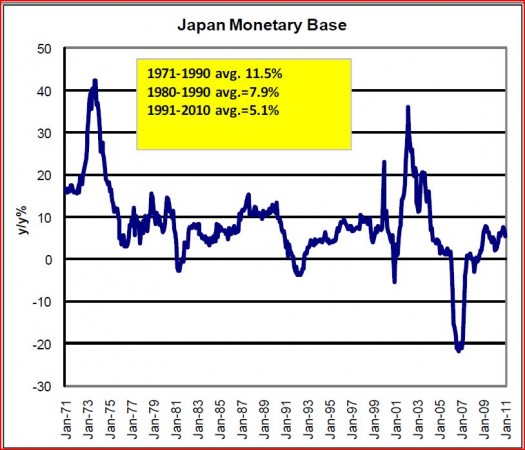
Michael Darda sent me some interesting information about the Japanese monetary base:

There are several ways of looking at this data.  The growth in the base over the past 20 years has been much slower than during the previous 20 years.  Thus it would be hard to claim QE didn’t work in Japan, as they didn’t even increase the base half as fast as when they weren’t doing QE.

On the other hand during the past 18 years Japan’s NGDP has been relatively flat.  So the growth rate of the base was much higher than NGDP, suggesting a falling rate of base velocity.  That does make QE look ineffective.  Especially when you consider that there were brief periods when base growth soared to nearly 40%.

But an even closer look as the data shows that these spurts in base growth were temporary, and were partially rescinded just a few years later.  Note the QE in the late 1990s when deflation first became a major problem.  Then the small drop in the base just a year or two later.  There was an even bigger bout of QE in the 2002-03 recession, followed by a much bigger drop in the base after the economy picked up a bit.  This doesn’t show that QE doesn’t work; it shows that temporary monetary injections don’t have much impact on NGDP.  But we already knew that, in fact it’s rather obvious if you think about it.

How do I know that the base declines in 2000 and 2006 were not just random?  How do I know the BOJ was intentional tightening policy?  Because on both occasions the BOJ raised interest rates, which is something no central bank does in a liquidity trap.  Ever. 

Some people look at these facts and see a central bank that was powerless to boost NGDP.  That seems crazy to me.  Why would a central bank trying to raise NGDP reduce the monetary base?  Why would they raise rates?  Here’s an alternative view.  Suppose the BOJ was trying to prevent inflation.  Then every time the CPI inflation rate rose up to zero, they would tighten policy.  If my hypothesis is correct, then what type of path would one predict for the Japanese monetary base?  The answer is surprising; almost exactly the path that we actually observed.  Here’s why:

1.  Because the trend rate of inflation fell sharply between 1970-90 and 1991-2010, nominal interest rates fell close to zero (the Fisher effect.)  This would produce a large increase in the real demand for base money, or a large fall in velocity.  And that’s exactly what we observed in Japan after 1990.

2.  When near the zero bound, the demand for base money will not be stable.  When conditions are depressed, the demand for money will pick up somewhat, and the BOJ will have to inject large amounts of base money to prevent severe deflation.  That’s the late 1990s, and 2002-03.  When things pick up a bit the demand for money will fall, and the BOJ will have to remove a significant amount of base money to prevent inflation.  And that’s what happened in 2000 and 2006.

3.  But they won’t remove all the base money injected earlier.  Recall that at near zero interest rates there is that permanent increase in the demand for liquidity.

Bennett McCallum once proposed that the Fed adjust the monetary base to offset changes in velocity during the previous quarter.  That would keep NGDP relatively stable.  I seem to recall McCallum proposed that NGDP be allowed to grow at a modest but steady rate.  The Japanese seem to have basically adopted this policy, but with a zero percent NGDP growth target.   No, I don’t believe they are consciously behaving this way, but it is interesting to consider that this is almost exactly the way the BOJ should behave if it wanted to keep NGDP constant, or the NGDP deflator falling at about 1% per year.

So QE did work in Japan.  They got steady NGDP.  The next question is why they acted as if they had such a peculiar policy target.  Some people tell me that “Japan” likes low inflation because they have lots of old people on fixed incomes.  But “Japan” isn’t a person, it’s a country.  Japan didn’t decide to follow a policy of stable NGDP, the BOJ did.  At the very same time the BOJ was deflating the economy the Japanese fiscal authorities were aggressively trying to boost NGDP through expensive construction projects, which have put Japan deeply in debt.  The BOJ sabotaged those efforts.  No, “Japan” did not adopt a stable NGDP target (or mild deflation target), the BOJ did.  That’s even more peculiar.

PS.  I will try to catch up on comments this weekend.

PPS.  I just added an interesting Romer quotation to the end of the previous post.

Two years too late

In early March 2008 I wrote an open letter to the President:

President Obama: You need to talk to Christy

I pointed out that Christine Romer understood the importance of monetary stimulus in the Great Depression, and predicted that she would recommend aggressive monetary stimulus in this crisis as well.  I doubt he ever talked with her, as he didn’t even bother filling empty Fed seats.  At the time most progressives were ignoring monetary stimulus, and focusing almost entirely on fiscal stimulus.

Now we know I was right, Christine Romer does think that monetary stimulus is crucial:

“We need to realize that there is still a lot of devastation out there,” Romer said, calling the 8.9% unemployment rate “an absolute crisis.”

“If I have a complaint about policy these days, it’s that we’re not doing enough,” she said. “That goes all the way up to the Federal Reserve, [which] could be taking more aggressive action. It goes to the Congress and the Administration – there are fiscal policy actions they could be taking.”

“And don’t tell me you can’t [take those actions] because of the deficit because I think there are fiscally responsible ways,” she said.

Romer suggested that extending the payroll tax break to the employer side of the payroll tax could spur the economy;

The employer-side payroll tax cut is a good way of offsetting wage stickiness, and is an idea I have often advocated.  Monetary stimulus combined with an employer payroll tax cut would be a powerful one-two punch.

Why didn’t he talk to Romer?  I suspect that Larry Summers blocked access.

HT:  Matt Yglesias

PS.  Replies to comments may be delayed.

Update 3/25/11:  Alex Tabarrok sent me an even better quotation from Romer:

One thing I had the class read was Ben Bernanke’s 2002 paper on self-induced paralysis in Japan and all the things they should’ve been doing. My reaction to it was, ‘I wish Ben would read this again.’ It was a shame to do a round of quantitative easing and put a number on it. Why not just do it until it helped the economy? That’s how you get the real expectations effect. So I would’ve made the quantitative easing bigger. If you look at the Fed futures market, people are expecting them to raise interest rates sooner than I think the Fed is likely to raise them. So I think something is going wrong with their communications policy. They could say we’re not going to raise the rate until X date. Those would be two concrete things that wouldn’t be difficult for them to do. More radically, they could go to a price-level target, which would allow inflation to be higher than the target for a few years in order to compensate for the past few years, when it’s been lower than the target.

Joan Robinson wins

Has there ever been a more complete intellectual breakdown in our profession?  Economists of both the left and the right have been disdainful of the idea that the Fed and ECB adopted ultra-tight monetary policy in late 2008.  When I ask economists why, they often point to the low nominal interest rates.  When I point out that for many decades nominal interest rates have been regarded as an exceedingly unreliable indicator of monetary policy, they shrug their shoulders and say “OK, then real interest rates.”  At that point I explain that real interest rates are also an unreliable indicator, but if you want to use them it’s worth noting that between July and late November 2008, real rates on 5 year TIPS rose at one of the fastest rates in US history, from just over 0.5% to over 4%.  Then they point to all the “money” the Fed has injected into the system (actually interest-bearing reserves.)  I respond that the people who pay attention to money (the monetarists) don’t regard the base as the right indicator, as it also rose sharply in 1930-33.

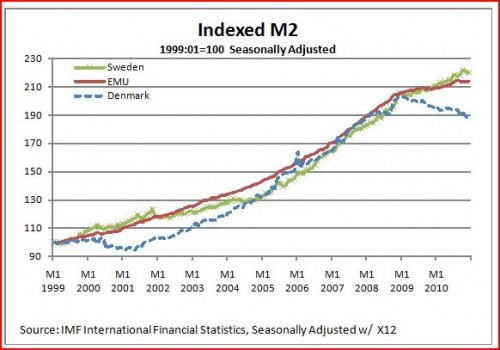
Their best argument has been “OK, but M2 fell sharply in the Great Depression, and M2 has risen briskly in this crisis.”  At that point I am usually stumped, and merely remind people that the profession no longer paid attention to M2 after the early 1980s, regarding it as “unreliable.”  But now I have a better answer.  I was reading a post by Justin Irving and came across this very interesting graph:

At first glance it doesn’t look like much of interest has happened to the eurozone money supply.  But remember that growth tends to be exponential, and so please visually follow the red euro M2 line upward.  Notice the break in growth in 2008.  Where would the money supply be if the ECB had maintained steady eurozone M2 growth?  Justin also supplied me with the actual seasonally adjusted data.  Here are some data points:

Date                                    M2          growth from 27 months earlier

April 2004                      5339999               14.9%

July 2006                       6372397              19.3%

October 2008                8014245              25.8%

January 2011                8413040                5.0%

So after rising at fairly rapid rates for years, M2 growth slows to barely over 2% annual rate over the past 27 months.  What would Milton Friedman say about that?

If pressed, Keynesians will usually point to real interest rates as the right measure of monetary ease or tightness.  By that criterion the Fed adopted an ultra-tight monetary policy in late 2008.  Monetarists will usually say that M2 is the best criteria for the stance of monetary policy.  By that criterion the ECB adopted an ultra-tight monetary policy in late 2008.  And yet it’s difficult to find a single prominent macroeconomist (Keynesian or monetarist) who has publicly called either Fed or ECB policy ultra-tight in recent years.  Maybe tight relative to what is needed, but not simply “tight.”

I’m calling out my profession.  Do they really believe what they claim to believe about good and bad indicators of monetary tightness?  Or in a crisis do they atavistically revert to the crudest measure of all, nominal rates.  Joan Robinson is famous for once having argued that easy money couldn’t possibly have caused the German hyperinflation, after all, nominal interest rates in Germany were not low during 1920-23.  Have we advanced at all beyond Joan Robinson in the 73 years since she made that infamous remark?  I used to think the answer was yes; now I’m not so sure.

[BTW, modern monetarists like Michael Belongia and William Barnett advocate use of a divisia index for money.  I saw a paper by Josh Hendrickson that showed by that measure money became very tight in the US during 2008.]

Justin’s post also contains another interesting idea.  Notice how much more slowly Danish M2 grew as compared to Swedish, or even eurozone M2.  Sweden has a floating exchange rate and devalued sharply in late 2008, Denmark’s currency is fixed to the euro, and Denmark’s economy is much weaker than Sweden’s (in terms of NGDP and RGDP growth.)  Here’s Justin:

I am examining this issue in my Masters Thesis and it just occurred to me that it might be interesting to see how Denmark and the ECB compare to Sweden on Milton Friedman’s favored measure of monetary policy-M2 growth.  M2 is a standard measure of how much money there is in the banking system of an economy.  It is beyond the point of this post, but there is good reason to think that if M2 drops precipitously, that spending will fall and that the economy will grow below its potential.  Unfortunately we cannot see M2 for Finland alone as there is no real way of distinguishing between the stock of Euros within the Finnish economy, and those in the broader world.  The Danish crown however is something like that radioactive dye physicians inject into peoples veins so that they can see the circulatory system on an x ray.  The Danish currency is essentially the Euro, except that we can track it by the fact that it has pictures of Viking longships on it if it is currency, or a DKK currency ID next to it if it is electronic money.

Because Denmark fixes the price of the Danish Crown in terms of Euro, the central bank is constrained in how it can stabilize M2.  Central banking is, at the end of the day, pretty simple (no to be confused with easy).  The only thing the bank can really do is change the quantity of money and see how the market reacts.  Most of the time, central banks pick an interest rate they think appropriate and print money or pull it from circulation (by selling financial assets or foreign currency they have accumulated) until the interest rates moves where they want it.  When interest rates fall to zero, central banks need to pick other variables to guide their money printing decisions, such as stocks, exchange rates, consumer prices or nominal GDP.  In the case of Denmark, the central bank targets the exchange rate against the Euro by buying and selling the Danish crown in currency markets so that its rate against the Euro never changes.  As Denmark is an open economy with free capital flow, this means that they have essentially no control over their monetary policy.  Danish interest rates and money supply have to adjust to whatever is necessary to keep the Euro rate stable.

I love Justin’s radioactive dye analogy; it reminded me of something I noticed in the Great Depression.  In the US the monetary base fell 7% between October 1929 and October 1930, under the Fed’s tight money policy.  Then it rose substantially after October 1930.  But money didn’t become easier, rather the Fed was partially accommodating the hoarding of cash and reserves during banking panics.  But not fully accommodating the demand, as NGDP continued falling sharply after October 1930.  How could we know if this explanation is correct?  One answer would be to look for a similar economy, without banking panics.  In Canada there were no bank panics, and cash in circulation continued falling throughout 1929-32, if my memory is correct.  Because the US deflation was transferred to Canada via the international gold standard, they had no choice but to deflate their own currency.  Canada in the early 1930s is like Denmark in the past three years.

There’s an old fairy tale where a beautiful princess looks in the mirror and sees her true self, which looks more like an ugly witch.  The US monetary policy looked beautiful in the early 1930s, if one just focused on the base.  But all one had to do was look to the north to see just how ugly it really was.  If the ECB wants to take a look in the mirror, I suggest they take a look at the contrast between Swedish and Danish M2 growth.  The Danish policy it what their policy really looks like.  It’s not a pretty sight.

BTW, Justin’s blog post is more valuable than most master’s theses that I have seen.

PS.  I believe Canada may have done a small devaluation in late 1931, but not enough to prevent deflation.