Are “normal” yield curves actually normal?
The US yield curve usually slopes upward. Hence positively sloped yield curves are termed ‘normal’ and negatively sloped yield curves are termed ‘inverted’. But are “normal” yield curves actually normal?
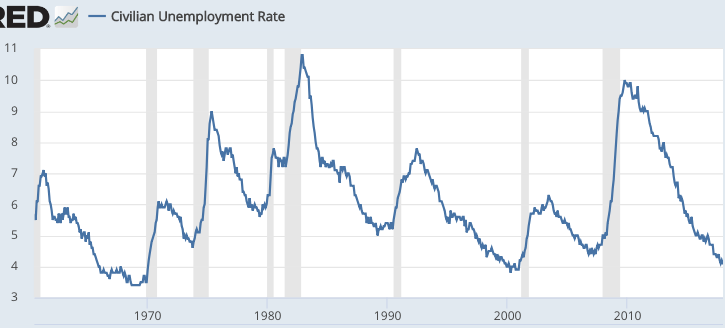
The US business cycle has an unusual feature, an absence of soft landings. A soft landing is when unemployment recovers to the natural rate, and then stays low for at least four years. The only plausible example is 1966-69, but that wasn’t really a soft landing because it came at the expense of rapidly accelerating inflation. The plane soared off into the stratosphere before the wheels even touched the runway. Otherwise, we have only a year or two of stable and low unemployment, before the next recession.

So 90% of the time we are either recovering (mostly with a normal yield curve) or in recession (mostly with a normal yield curve.) Inverted curves tend to occur right before a recession, when unemployment is low. But what if we did have a true soft landing—persistent low unemployment without accelerating inflation? Would the yield curve be flat? After all, when output is already near the natural rate, you don’t expect further recovery. You don’t expect the future economy to be better (stronger) than the present.
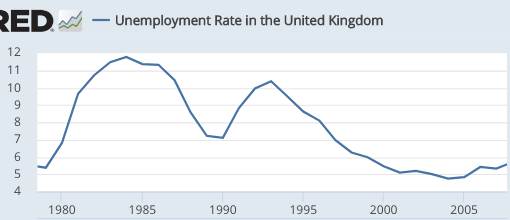
So I decided to seek out a country that did have a soft landing—Britain from 2001-08:

Notice that in 1991, the UK entered recession almost immediately after the unemployment rate stopped falling—the US pattern. But in 2001, unemployment reached the low 5s and stayed near there until mid-2008. So how about the UK yield curve? Below I have data from 2000-08, using June data in each case. The first number is the nominal yield on 6-month UK T-bonds, and the second number is the yield on 10-year bonds. I’m not used to using UK data, so someone tell me if I made a mistake:
2000: 6.0%, 4.13%
2001: 5.33%, 4.92%
2002: 4.38%, 4.80%
2003: 3.19%, 4.87%
2004: 4.89%, 4.93%
2005: 4.16%, 4.28%
2006: 4.70%, 4.47%
2007: 5.85%, 4.94%
2008: 5.26%, 5.12%
During these 9 years, the UK yield curve was slightly inverted, on average. But pretty close to flat. This suggests that a flat yield curve might be expected when the economy is still expanding, but the unemployment rate is not expected to fall much further.
Note that the US yield curve was pretty flat in May 2006, when unemployment had fallen to 4.6% and was expected to stay around that level. And unemployment did stay around that level for another 18 months. The yield curve was also fairly flat in 1966. The yield curve today slopes gradually upward, but it’s flat between 2 years and 5 years, which suggests to me that markets may be expecting the US to achieve a soft landing.
The unemployment rate today (4.0%) is not much different from 15 months back (when it was 4.1%.) I expect it to fall a few more ticks (the trend is actually in the high 3s), but then stop falling. If I’m right that the US will achieve its first ever non-inflationary soft landing, then I’d expect a pretty flat yield curve to be the new normal. There’d still be a slight tendency for an upward slope, but not much.
Of course this happy scenario assumes that the Fed keeps NGDP growing at a reasonably steady rate (say a range of 3% to 5%). There are no guarantees, but they seem to be trying to do something like that in recent years, even if they don’t admit it.


