Archive for the Category Uncategorized


Some thoughts on purchasing power parity estimates

I plan to make two points in this post:

1. It’s important to use PPP adjusted data.
2. PPP adjusted data is not always reliable.

Yes, there’s a conflict. But real life is messy.

I recently traveled to China, and that got me thinking about PPP estimates of GDP/person. Here is some data from the IMF (for 2023):

US: Nominal = $80,412 PPP adjusted = $80,412 (by definition)

Austria: Nominal $58,013 PPP adjusted = $69,069

Japan: Nominal = $33,950 PPP adjusted = $52,120

Taiwan: Nominal = $32,339 PPP adjusted = $72,485

Chile: Nominal = $17,254 PPP adjusted = $29,935

China: Nominal $12,541 PPP adjusted = $23,309

Recall my recent post where I argued that Japan’s economic performance has been somewhat disappointing. If we used nominal figures, we’d conclude that it’s been an unmitigated disaster. In 1995, Japan’s per capita nominal GDP was more than 50% higher than that of the US ($44,198 vs. $28,658. Now it’s well below half the US level. I’m not saying that doesn’t matter at all (it may explain the decline in Japanese tourism), but surely it’s not an adequate measure of Japan’s overall position relative to the US.

I’ve been to all of these places in recent years, and for the most part the PPP figures seem to be in the right ballpark. But there’s one exception. Taiwan’s PPP adjustment seems way too large.

I’m not trying to dump on Taiwan. Over at Econlog I recently praised Taiwan, which certainly has a highly successful economy. But Taiwan doesn’t seem even close to Austria in living standards. More like Japan (at best.)

Taken at face value, the IMF is claiming that Taiwan has a far lower price level than mainland China. I recently spent three weeks in China, and then stopped in Taiwan for three days on the way home. My initial reaction was that Taiwan seemed far more expensive than the mainland (albeit considerably cheaper than the US.) An hour long taxi ride to the Beijing airport costs about $15, whereas the roughly equal ride from the Taiwan airport to our hotel was about $45. Food was also more expensive in Taipei. My wife bought the same meat filled pancake that cost 80 cents in Beijing for $2 in Taipei.

Those are just anecdotes, but service prices tend to reflect wages, and wages are obviously much higher in Taiwan than in Mainland China. I can’t even imagine which goods are so cheap in Taiwan that they could explain the IMF finding the overall Taiwanese cost of living to be far lower than the mainland. Manufactured goods like cars are also really inexpensive in China. What am I missing?

In contrast, China’s upward adjustment might be a bit too small. China seemed far cheaper than all of the other countries on the list.

So PPP adjustments are far from perfect. Even so, using nominal GDP/person figures leads to nonsense, like the claim that Japan is in the midst of a Great Depression.

Here’s the FT:

After stagnating under Mao Zedong in the 1960s and 70s, China opened to the world in the 1980s — and took off in subsequent decades. Its share of the global economy rose nearly tenfold from below 2 per cent in 1990 to 18.4 per cent in 2021. No nation had ever risen so far, so fast.   

Then the reversal began. In 2022, China’s share of the world economy shrank a bit. This year it will shrink more significantly, to 17 per cent. That two-year drop of 1.4 per cent is the largest since the 1960s. 

These numbers are in “nominal” dollar terms — unadjusted for inflation — the measure that most accurately captures a nation’s relative economic strength.

Define “economic strength”. BTW, that’s a clumsy way to define nominal share of global economy. Instead of saying “unadjusted for inflation”, the FT should have said “at current exchange rates.”

PS. If I had no access to the IMF data and was told the US GDP/person was $80,000, I would have guessed (PPP adjusted) $75,000 for Austria, $60,000 for Japan, $55,000 for Taiwan, $30,000 for Chile and $26,000 for China. So Taiwan is the one where I’d be way off.

PPS. Yes, RGDP doesn’t exactly equate to living standards (which reflect consumption), but Taiwanese investment is 25.9% of GDP, only slightly above the 24.2% ratio in Austria. A slightly higher investment ratio cannot explain the size of the anomaly. Taiwan’s PPP adjustment is too large.


No such thing as public opinion, example #289

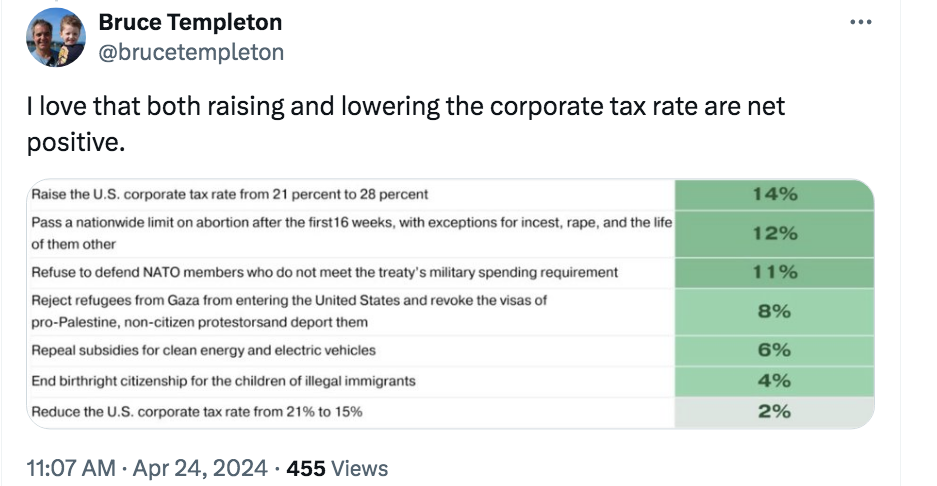
Polls do not measure public opinion, because public opinion is not an objective reality. It depends on how you ask the questions.

Steve Chapman has an excellent column that illustrates this idea using the abortion issue:

But the decision in Dobbs v. Jackson Women’s Health Authority shattered that complacency. Many if not most people were shocked to see a basic liberty go up in smoke. A Pew poll taken days after the ruling found  57% of Americans disapproved of it, while 43% strongly disapproved. More Democrats strongly disapproved of the ruling than Republicans strongly approved of it. Support for legal abortion has registered a significant and lasting increase. Gallup found that 69% of Americans now believe the procedure should be legal through the first three months of pregnancy, up from 60% in 2018. It also found that 37% think it should be allowed in the second three months, up from 28% in 2018.

So which is it? If 57% oppose the Supreme Court decision, then presumably at least 57% favor legal abortion. (Maybe more, I don’t oppose the Dobbs decision but am also pro-choice.) And yet we are told that only 37% favor legal abortion in the second trimester.

Chapman points out that the behavior of voters does not seem to reflect these polls:

You might figure that if 63% of Americans oppose allowing second-trimester abortions, the 15-week cutoff would be an easy sell. But the court’s reversal has engendered great suspicion of measures that fall short of restoring the old status quo. When Virginians heard Youngkin propose a ban after 15 weeks, they apparently didn’t focus on “15 weeks”; they focused on “ban.” 

If the polls were accurate, then abortion should be a winning issue for less extreme Republicans like Youngkin. It isn’t. Once voters are faced with the reality of the issue, opinions change rapidly:

It’s not surprising that support has grown for permitting second-trimester abortions. The post-Dobbs experience has given Americans a new understanding of the dangers of curbing access, thanks to heartbreaking stories about women whose fetuses suffer from severe and even fatal defects but who are forced to carry them to term. Even women with complications that put their own lives at risk have found doctors unwilling to perform abortions for them. After passing its strict ban, Texas saw an 11.5% increase in infant mortality.

Many people don’t have a settled view of abortion—it depends how you ask the question. And this is true for many other issues. Consider these two poll questions:

1. Should prostitution be legal?

2. Should prostitutes be put in prison?

Will the responses be consistent?

(Yes, a person might say “Keep it illegal but have them pay a fine.” But that’s not really any different from “Make it legal and put a tax on the activity.”)

Japan is not doing well

[Update: There is an important error in this post, which commented on a claim in a paper by Jesus Fernandez-Villaverde, Gustavo Ventura and Wen Yao. I assumed that the rise in the number of old people in Japan made the US/Japan comparison a bit misleading. But labor force participation among older workers in the US has risen faster than in Japan, so that adjustment would actually strengthen their results. Thus my second claim was wrong. They also looked at other starting dates. They found that if you start the clock in 1990, Japan goes from doing slighter better than the US to slightly worse. So my first claim has some validity, but the effect is relatively small. I still believe that Japan’s performance has been disappointing, as I think they should have continued catching up to the US after 1990, but that’s a separate question from the issues that their paper examined. Mea culpa for not reading the paper before commenting on a specific claim in the abstract. The rest is the original post, without changes.]

In the period up until 1991, Japan’s economy grew much faster than the US economy. Most economists (myself included) expected Japan to continue to close the gap in per capita GDP. Instead, Japan began losing ground after 1991.

Every so often, a revisionist comes along with the argument that if you look at the data in a certain way, Japan’s actually not doing that poorly. David Beckworth recently linked to one such example:

I’m not buying this argument, for two reasons:

1. Between 1991 and 1998 the US economy grew by 29%. Japan grew by only about 7%. Even in per capita terms the US growth rate was far higher. This is when Japan lost substantial ground against the US.

But Japan’s poor performance was due to a demand side recession, and hence you might have expected them to recover over the next few years. It didn’t happen. Japan never again regained its 1991 position relative to the US.

People that wish to make Japan look better take 1998 or 1999 as a starting date, not the early 1990s. But any country looks better if you start the clock from the trough of a recession. Thus the US looks better when you start the clock from 2009 rather than 2007.

2. I don’t like using working age population as the denominator. It sounds reasonable, until you consider that a fast growing share of Japan’s workforce is 65 or over. Thus lots of its GDP is being produced by workers that are not being counted in the comparison.

I don’t have the exact figures, but it seems that about 30% of Japan’s population is 65 or over. Another 55% is between 18 and 64, and roughly 15% is below 18. That means that about 35% of Japan’s adult population is 65 or over, and the share has been rising rapidly. And while only 26% of the older group is working, that share is also rising over time. Put those two facts together, and Japan has a rapidly growing number of older workers.

Even with all of these adjustments, I’d guess that Japan’s per capita growth rate since 1998, properly measured, isn’t much different from that of the US. But since 1991, Japan has lost ground against both the US and other highly developed countries such as Germany. In 1991, you might have expected most of the cutting edge East Asian companies in high tech to be located in Japan. Instead companies like TSMC and Samsung are in countries that were recently far behind Japan in technological expertise. Many Japanese offices still rely on things like fax machines.

Is Japan doing well compared to Argentina, Algeria or Myanmar? Of course. But Japan is not doing well relative to what one might have expected after the spectacular Japanese boom of 1950-1991. In recent years, I visited both Japan and Austria. Austria seemed far more affluent.

Japan is a nation of 125 million highly educated people with great social cohesion. In the past, it has shown great ability to innovate. It should be doing better.

Bill Dudley on money and inflation

This paragraph in a FT article has me confused:

We still have people talking about money supply growth as a big driver of economic activity, when money supply is mostly driven by QE and QT. When the Fed’s doing QE, money supply grows fast; when the Fed’s doing QT, money supply shrinks. And those things may be correlated with economic activity. When you’re doing QE, you’re trying to stimulate the economy; when you’re doing QT, you’re trying to restrain the economy. But it’s not like money growth is directly responsible.

I don’t follow this. QE means increasing the monetary base. So Dudley is saying:

1. QE leads to a larger money supply.

2. QE is expansionary for the economy.

3. Money growth doesn’t matter.

The first two claims represent the classic monetarist position. The base impacts the broader money supply. Check. Increases in the base are expansionary for the economy. Check. But somehow the money supply doesn’t matter? Does the monetary base matter? If not, why is QE expansionary?

This all seems like word games. When thinking about causality one must think in terms of policy counterfactuals, otherwise any statement is simply incoherent. We saw a huge rise in M2 during Covid. Dudley seems to think that was caused by QE. Fine. But what about a counterfactual where the Fed does just enough QE to allow for only a small rise in M2. (Much less than they actually did.) Is Dudley denying that that counterfactual policy would have been less inflationary?

In the rest of the interview, Dudley insists that monetary policy is all about interest rates. That’s just wrong. Did low interest rates cause the German hyperinflation? Or was it printing a zillion German marks worth of currency?

PS. Later, Dudley says:

Continuing with QE did two things. Number one, it added more deposits to the banking system and probably created more temptations for banks like Silicon Valley Bank to take on excessive interest rate risk in their portfolio.

Now I’m even more confused, as that also sounds like monetarism. The monetary base matters, and bank deposits matter, but M2 doesn’t matter? M2 is composed of currency and bank deposits. Can someone help me out?

McMansions, cable news, and Capitol Hill High School

Give the people what they want.

Systems such as free markets and democracy are good at giving the people what they want. Some people don’t like that fact. I’ll give a few examples, but there are many more that could be cited.

When I Iived in Newton, MA, I used to enjoy walking around and looking at the gorgeous old homes. Newton is one of America’s most beautiful towns. When I travel to fast growing sunbelt cities, I now see an endless sprawl of ugly McMansions. Hideous neo-Palladian monstrosities. Mock Georgian excrescenses. An orgy of nouveau riche bad taste.

But these houses are not being built for me—architects are giving the people what they want. Don’t blame the architects; they are capable of designing whatever people want. You still see beautiful homes being built in places like Newton, or Laguna Beach, or Irvine. The “problem” is that America has a vastly enlarged upper middle class, and the newest members tend to have poorer taste than the small upper class of the early 20th century.

When I was young, TV news was somber and tasteful. Now you see popular networks full of blond bimbos screeching nonsense at the top of their lungs. But don’t blame the networks, they are giving the people what they want.

When I was young, politics was a serious business. Party officials acted at gatekeepers, assuring that lunatics would not receive their party’s nomination for national office. (Local government has always been messy.) Since then, America has become more democratic, and we are finding that what voters want most of all is for Congress to resemble their experience in high school:

1. Remember the mean girls that slut shamed each other?

2. Remember the lazy guy that pulled the fire alarm because he wasn’t prepared for the test?

3. Remember the devious guy that sucker punched people in the kidneys when they weren’t looking?

4. Remember the dumb guy who challenged the fat guy to a fight in the back alley?

Welcome to Capitol Hill High School.

The elites are appalled by all of this. But you cannot deny that we are getting what the public wants.

The founders put a 35-year age minimum on the presidency to prevent the election of a high school student. Doesn’t matter. Next year, a high school student will be elected president of the United States. We’ll get what we want—good and hard.

PS. Want more examples? Hollywood films. Reality TV. Professional wrestling. The list is endless.