Archive for the Category Forecasting


Economic indicators and the risk of “lowflation”

As we enter 2019, there are some economic indicators worth thinking about. Some are obvious, like the strong jobs growth (stronger than I expected.) Some are more subtle. Here are wage inflation (blue) and core PCE inflation (red):
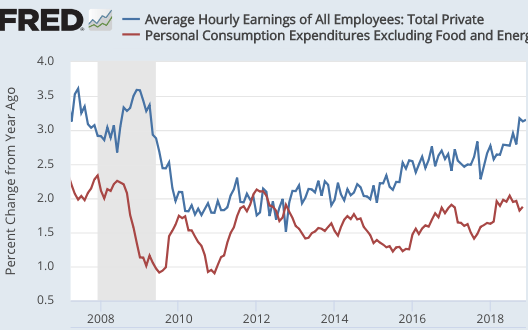
Screen Shot 2019-01-16 at 2.28.36 PMIn my view, wage inflation is far more meaningful.  But PCE inflation is what the Fed is targeting, so we also need to pay attention to that variable.  I’d expect it to follow wage inflation, but the relationship is weak.

BTW, I noticed a problem with the way they calculate core inflation, at least for the CPI.  It does not include food consumed away from home.  In my view, restaurant meals are one of the most “core” of all core inflation components, or should be.  The whole point of core inflation is to include stuff closely related to wage inflation, which is very inertial.  And yet food away from home (6% of the CPI) is considered part of “food and energy”, and excluded from core.  In contrast, I’m not sure shelter should be included in core inflation, as real estate price measures are not reliable.  But this component (1/3 of the CPI) is a part of core inflation.  This link gives the weights of the CPI basket.  The CPI is just a mishmash of unrelated and hard to measure stuff.

This is one reason why I’m less concerned with “lowflation” than many other people.  Wage inflation is steadily rising, and is approaching pre-recession rates.  We seem headed in the right direction.  NGDP growth has also been strong.

Private forecasters predict roughly 2% inflation going forward, while the financial markets seem to predict less than 2%.  How much less?  That’s hard to say.

The 5-year TIPS spread is about 1.65%.  But CPI inflation has exceeded PCE inflation by 0.25% over the past decade, so in fact the true TIPS spread (for PCE) is around 1.4%, well below the Fed target.  That may be partly due to two factors.  One is the recent fall in oil prices.  For various reasons including lags in adjustment, TIPS spreads tend to follow oil prices (the graph divides oil prices by 25, to make comparisons easier to see):
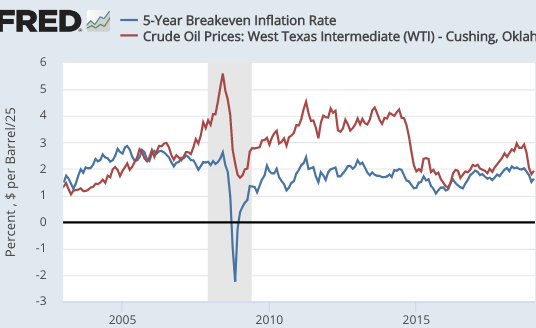
Screen Shot 2019-01-16 at 1.49.32 PMThe the sharp fall in oil prices in 2015 pushed the TIPS spread down from 2% to 1.3%.  Or at least it seemed to.  I have trouble understanding how the effect could be that large.  The recent drop should not have reduced 5-year TIPS spreads more than about 0.2%.  So that leaves perhaps a 1.6% market PCE inflation forecast over 5 years—still lower than target.

Can a liquidity premium for T-bonds explain this gap (as in late 2008)?  Maybe, but I lean toward the view that the market really does forecast slightly below 2% inflation, say 1.7% or 1.8%.  This might reflect a 50% chance of continued boom and 2% inflation, and a 50% chance of recession and only 1.5% inflation, for instance.

Another variable of interest is fed funds futures.  They normally show a rising trend over time.  Right now the current fed funds rate is around 2.4%, expected to fall to 2.3% in July 2020.  So that tells me that the market expects a bit of “lowflation” in 2019, which might eventually lead to a rate cut.  But no recession.  Of course the market is presumably pricing in a certain probability of continued boom and higher rates, and a slightly higher probability of a sizable rate cut if there is lowflation and/or recession.

In my view, 2019 will tell us a great deal about whether we have moved to a higher trend rate of growth, and/or whether policy is still too tight to hit the Fed’s 2% PCE inflation target.  It’s not impossible that both might occur—sub-2% core PCE inflation and RGDP growth above the Fed’s forecast.  This would actually be good news in a way, as the “lowflation” would mean the Fed would not have to act to slow the recovery, which then might extend for many more years.  I don’t predict stocks, but the goldilocks outcome might be good for equities.

PS.  I’m reluctant to mention stocks as an forecasting tool, because they are so noisy.  They are affected by NGDP growth, but also by trade wars, foreign growth, and other factors.  The partial recovery from late last year makes a recession slightly less likely, although I never thought the risk had reached a 50% probability.  The fairly flat yield spread points to slower growth but no recession—similar to fed funds futures.

PPS.  I’m tempted to call a Chinese recession.  If I were right it would look very good, given how I pooh-poohed all the other pundits who wrongly predicted a Chinese recession in previous years.  But I won’t.  No guts, no glory.  And I have no guts.  I predict they’ll muddle through.

When should we start worrying about inflation?

Jan Hatzius is now forecasting that inflation will soon exceed the Fed’s 2% target for the PCE:

Goldman’s Jan Hatzius wrote Sunday that unemployment should continue to decline to 3% by early 2020, noting the labor market also has room to accommodate more wage growth. Hatzius predicted that average hourly earnings would likely grow in the 3.25% to 3.50% range over the next year.

That rapid pace of wage growth could set the Fed up for a “meaningful overshoot” of its 2% inflation target.

“If unemployment is (perhaps well) below 3.50% and inflation above 2%, we think Fed officials will need to be quite confident that growth will stay at or below trend to sound an all-clear on further rate increases, which could translate into a large easing in financial conditions and a return to growth rates well above trend,” Hatzius wrote.

Hatzius wrote that the economy needs to slow to avoid overheating, and worries that inflation could run away if the Fed does not take action. For now, Goldman has a baseline forecast of 2.3% for core PCE — which it noted as within the Fed’s comfort zone — but warned that inflation is poised to move higher on President Donald Trump’s tariffs.

The note also warned that with the labor market continuing to tighten, inflation will likely push “notably, not just slightly, higher.”

Hatzius said a slowdown could stabilize the unemployment rate, and already predicts that the economy will calm to a GDP growth rate of 2.6% in the fourth quarter. But if the slowdown is not enough, unemployment could destabilize into 2020 and inflation could run rampant.

If Hatzius is correct (and I greatly respect his judgment), then Fed policy is currently too expansionary.  The Philadelphia Fed consensus forecast is for 2.1% PCE inflation in 2019 and 2020.  (I’ll be very interested in the next forecast, which should be out soon.)  On the other hand, TIPS spreads continue to show sub-2% inflation over the next 5 years (once adjusted for the CPI bias) but they are subject to bias from a modest risk spread.

So what would tell me that we have an inflation problem?  Lots of news articles saying “It’s not that bad, because if you take out the rise in the price of X, inflation is only running at Y”.  I saw literally dozens of such articles in the 1960s and 1970s, and essentially 100% of them were incorrect.

It is true to inflation indices can be distorted by the actions of individual markets, but only if it reduces aggregate supply.  In that case, you’d see rising inflation, falling RGDP growth and modest NGDP growth.  In fact, both NGDP and RGDP growth have recently been quite strong, so don’t believe any articles about it not being so bad because it’s concentrated in health care, or education, or rents, or tariffs, or kiwi fruit prices, or some other special factor.  Special factors are not an excuse when NGDP growth is at a pace that is unsustainable if we hope to keep inflation close to 2%.

I’m not a forecaster, so I’m still pretty agnostic on this.  My baseline forecast is still for a slowdown in NGDP growth (predicted by the Hypermind market) and no recession or high inflation in the near term.  That’s good.  But I’ll be watching very closely for signs of excess.  The most likely policy mistake being made right now is too easy, not too tight.

PS.  Hypermind is currently forecasting 12-month 5.2% NGDP growth.  That represents a forecast of a slowdown to 4.2% over the next two quarters, from the 6.2% (actual) rate over the past two quarters.

To boldly go where America has never gone before

Which of these statements is true:

1.  Tight labor markets are almost always followed by recessions within a year or two (1966 was an exception).

2.  Inverted yield curves are almost always followed by recessions within a year or two (1966 was an exception.)

3.  The US has never experienced an expansion lasting more than 10 years.

Actually, all three are true.  And none of the three have any necessary implication for current monetary policy. (Over at Econlog, I explain why I believe labor markets are currently tight.)

Suppose we took the first statement seriously.  If the labor market is getting tight, then the Fed might want to tighten monetary policy to get the labor market less tight.  After all, tight labor markets are often followed by recessions.  In contrast, if the yield curve inverted, then the Fed might want to loosen policy to avoid a recession.  And if the expansion has lasted for 9 years, then the Fed might want to simply throw in the towel, as history tells us that there is nothing that can be done.  A recession is inevitable in the near future.

In fact, history is not destiny.  It’s quite possible this expansion lasts for more than 10 years.  It’s quite possible that (as in 1966) a tight labor market doesn’t lead to a recession.  And its quite possible that (as in 1966) an inverted yield curve is not followed by a recession.  Unfortunately, we responded to the inverted yield curve of 1966 with an easy money policy, which created something even worse than a mild recession—the Great Inflation (which itself led to more severe recessions later on.)

History is no guide when the Fed is trying to achieve something that it has never achieved in all of American history—a soft landing.  So why am I so naive as to think this time is different?  Because Trump is President!  (Just kidding.)  One reason is because other countries have recently achieved soft landings.  Examples include the UK in the early 2000s and of course Australia.  Furthermore, the history of American monetary policy can be seen as a series of mistakes, and each time the Fed learns a lesson.  The Fed no longer creates 10% deflation.  They no longer create 10% inflation.  Now they must learn to avoid severe recessions.  I see no reason why they can’t succeed in that endeavor—Australia has already done so.

Update:  Let’s define ‘soft landing’ as at least three more years of growth once the labor market has become tight.

Screen Shot 2018-09-25 at 5.52.46 PM

Undoubtedly the US will still experience the occasional mild recession.  But we can, should, and probably will do much better than in the past.  Recall that in the 1970s, people like me who claimed the Fed could control inflation were viewed by the Very Serious People as being hopelessly naive and utopian.  The VSPs are always behind the curve on monetary policy.  They don’t understand monetary theory, and hence rely on “history”.  But history is a very poor guide when it comes to monetary policy.

And if you insist on going with “history”, then don’t tell me what the Fed needs to do to avoid the next recession.  History says a recession is inevitable, within 9 months.

Meanwhile the NGDP prediction market is up to 5.2% growth, and the number is rising.  I’ll go with the prediction market over “history”.

PS.  I increasingly believe the Fed has (perhaps subconsciously) absorbed the most important lesson in monetary policy:

Screen Shot 2018-09-11 at 2.08.35 PMPPS.  Trump in 2014:

We need a President who isn’t a laughing stock to the entire World.

The entire world today at the UN:

Ha ha ha ha ha ha ha . . .

Market monetarism is gaining ground

I recently did a post over at Econlog, discussing how Jerome Powell has adopted some ideas that sound vaguely market monetarist.  Marcus Nunes sent me another example, this time from St. Louis Fed President James Bullard:

In his talk, Bullard laid out a possible strategy for extending the U.S. economic expansion—one that relies on placing more weight on financial market signals, such as the slope of the yield curve and market-based inflation expectations, than has been customary in past U.S. monetary policy strategy. He explained that the empirical relationship between inflation and unemployment has largely broken down over the last two decades and that many current approaches to monetary policy strategy continue to overemphasize the now-defunct empirics of the Phillips curve.

“U.S. monetary policymakers should put more weight than usual on financial market signals in the current macroeconomic environment due to the breakdown of the empirical Phillips curve,” he said. “Handled properly, current financial market information can provide the basis for a better forward-looking monetary policy strategy.”

Market monetarists have long argued that financial market indicators are superior to the Phillips Curve as a forecasting tool for inflation.

On another topic, Karl Rhodes directed me to some Richmond Fed research on the zero bound.  Here’s the abstract of the paper, written by Thomas A. Lubik, Christian Matthes and David A. Price:

The likelihood of returning to near-zero interest rates is relevant to policymakers in considering the path of future interest rates. At the zero lower bound, the Fed can no longer lower rates and thus can respond to a contraction only through alternative policy measures, such as quantitative easing. Recent research at the Richmond Fed has used repeated simulations of the U.S. economy to estimate the probability of such an occurrence over the next ten years. The estimated probability of returning to the zero lower bound one or more times during this period is approximately one chance in four.

I certainly don’t have any reason to contest their finding, but I do have doubts about the method they used:

Lubik and Matthes began by estimating the TVP-VAR model over the full sample from 1961 to 2018 for quarterly data on real GDP, inflation (personal consumption expenditures inflation), and the federal funds rate. They then used the model’s estimated coefficients to produce forecasts over a ten-year horizon. The researchers generated multiple simulations of the shocks hitting the economy over the ten-year period and recorded their effects on macroeconomic variables for each quarter. The result of this process was a distribution of likely outcomes for each quarter.

In my view, the US is extremely likely to hit the zero bound in the next recession.  Thus for me, the chance of hitting the zero bound over the next 10 years is almost identical to the chance that there will be a recession during the next ten years.

If they agreed with my intuition, and used a VAR model to predict the chance of recession during the next 10 years, they might have come up with a figure higher than 25%. So does that mean that the risk of hitting the zero bound is greater than 25%?  I’m actually not sure, because I’m also skeptical of whether past performance is the best way to predict the timing of the next recession.  Yes this is true:

1. The US has never gone more than 10 years without a recession.

But these claims are also true:

2.  The US business cycle has recently been “stretching out”, getting longer.

3.  Other similar economies such as the UK and Australia have recently experienced extremely long expansions—about 15 years for the UK, and 27 years (so far) for Australia.

Is fact #1 more relevant for forecasting the risk of recession in the US over the next 10 years?  Or facts #2 and #3?

Forecasting is more an art than a science.

Was the dotcom mania “mad”? (And let’s lower the relative status of pessimists)

Tim Harford has a very good piece on bubbles in the FT.  This caught my eye:

Yet even with hindsight things are not always clear. For example, I first became aware of the incipient dotcom bubble in the late 1990s, when a senior colleague told me that the upstart online bookseller Amazon.com was valued at more than every bookseller on the planet. A clearer instance of mania could scarcely be imagined.

But Amazon is worth much more today than at the height of the bubble, and comparing it with any number of booksellers now seems quaint. The dotcom bubble was mad and my colleague correctly diagnosed the lunacy, but he should still have bought and held Amazon stock.

I wish I had bought Amazon in the 1990s, just as I wish I had bought Bitcoin at $12, when I was writing posts claiming that it was not a bubble.  But I didn’t, and given what I knew at the time there was really no reason for me to do so.  But what about the claim that “the dotcom bubble was mad”?  I do recall people saying that in 2002, after the bubble had burst and the NASDAQ fell to 1200.  But is that true?

The argument made in 2002 is that tech valuations made no sense unless you believed that tech companies would push aside old stalwarts like GE, GM and Walmart, and that companies like Apple and Amazon would become the most dominant corporations on Earth.  Well, hasn’t that happened?  Another argument was that you’d have had to believe that all the dotcom companies would be successful.  Actually, if you didn’t know which ones would be successful, it would have made sense to buy an index fund in the NASDAQ.

The NASDAQ peaked at just over 5000 in early 2000, but that was for just a very brief period.  The average “mad” dotcom investor would have purchased stock at some time during 1999 or 2000, probably at a NASDAQ level closer to 3500 or 4000.  NASDAQ is now above 7200, and if you add in dividends it would not be unusual for an investor to have doubled their money over 18 years.  That’s not particularly good for a risky investment, but it’s not horrible.  It’s a higher rate of return than T-bills, but lower than T-bonds.  But keep in mind that T-bond investors lucked out, as actual NGDP growth was far less than expected when T-bonds were yielding 6%, and if people had known what was going to happen to the US economy, yields would have been far lower in 2000.  Alternatively, if NGDP had grown as expected, the NASDAQ would be far higher today.

Just to be clear, even today it seems like the tech market was a bit frothy at the peak in March 2000, I’m not denying that.  But my point is that all of these judgments are provisional.  If people really believe that markets are irrational, they ought to be writing posts in the FT talking about the negative bubble of 2002.  What were those morons thinking when they sold tech stocks when NASDAQ was at 1200?  Were they insane? Were they idiots?  Instead, pessimism is intellectually respectable so the pessimists get off scot-free, while optimists are ridiculed for being wrong.  Why?

Here’s how the FT article starts out

“Prices have reached what looks like a permanently high plateau.” That was Professor Irving Fisher in 1929, prominently reported barely a week before the most brutal stock market crash of the 20th century. He was a rich man, and the greatest economist of the age. The great crash destroyed both his finances and his reputation.

The fact that Fisher’s wrong prediction had any impact on his reputation is a sad commentary on our society.  His forecast should have attracted no more attention than his forecast as to who would win the World Series.  Would Fisher’s reputation have been damaged if he got a baseball game wrong?

And if we really should trash people for their bad calls on the market, why isn’t Robert Shiller’s reputation damaged for his claim that stocks were overpriced in 2011, when in fact it was near the beginning of one of the great bull markets in US history?  Why trash the optimists but not the pessimists?

And why aren’t the Chinese bears being called to account for all their predictions of a crash in the Chinese economy, or of 3% average real GDP growth during the decade of the 2010s?

Just to be clear, I’m not saying anyone’s reputations should be trashed.  My complaint is that other people are trashing great economists like Irving Fisher with no justification at all.

Speaking of China, remember all those predictions that it would get stuck in the middle-income trap?  Read the following from another FT story, and ask yourself how often you read those sorts of things about Turkey, Brazil or other countries that are actually stuck in the middle-income trap:

Here, too, China is catching up. Chinese internet leaders Tencent and Alibaba have a combined valuation of $1tn. Add in another $200bn or so for Baidu, JD.com and Netease plus other listed or unlisted companies, such as Toutiao, Meituan and Didi, and the scale of the Chinese market becomes apparent. Trends emerging in China are beginning to shape the future of the global tech landscape. To its dominant role in the supply chain we can now add a “demand chain” aspect to the country. . . .

Massive investments in mobile broadband and a highly competitive handset market means that nearly all of China’s approximately 750m internet users use smartphones. Payments via QR codes, led by Tencent’s WeChat and Alibaba’s Alipay, are making cash obsolete. Dockless bikes line the streets of Chinese cities. The country’s physical infrastructure — roads, high-speed trains and airports — are facilitating as big a boost to consumption as President Eisenhower’s roll out of the Interstate Highway System in the US in the 1950s.

I have lived in Beijing for more than 20 years, yet only in the past year have I felt on returning to London or Silicon Valley that I’m going backwards in time. For urban residents, China is increasingly a study in frictionless living. Hopping on a bike, ordering a meal from a huge range of restaurants, paying for utilities, transferring money to friends — all can be done at the touch of a button. Internet services in the west offer increasing convenience no doubt — but nothing beats the experience in China.

What part of “developed country” is China not going to be able to do by 2035?  Be specific.