Archive for November 2014


Capex rising strongly during Japan’s “recession.”

If there’s one business cycle regularity, it’s that investment tends to fall more sharply than the other components of GDP.  Keep that in mind as you read the latest data dump from Japan:

TOKYO (Reuters) – Japan’s fall into recession between July-September could turn out to be less severe than feared, with new capital expenditure figures out on Monday suggesting revisions will put third quarter economic growth in a more positive light.

The 5.5 percent year-on-year rise in capital expenditure over the third quarter reported on Monday followed a 3.0 percent annual increase in April-June, which could ease concerns about recovery from a sales tax increase earlier this year.

“The revised data will show a smaller contraction in GDP that could be close to zero,” said Hiroaki Muto, senior economist at Sumitomo Mitsui Asset Management Co.

“Other data on consumer spending, factory output and business investment show these three factors will drive future growth.”

Compared with the previous quarter, capital spending excluding software rose a seasonally adjusted 3.1 percent, versus a 1.5 percent decline in April-June in an encouraging sign of vigorous business investment.

Preliminary data showed the economy contracted an annualized 1.6 percent in July-September, confirming Japan had entered its third recession in the past four years as a sales tax hike in April hurt consumer spending and business investment.

In preliminary GDP data, capital expenditure shrank 0.2 percent, versus the median estimate for 0.9 percent increase.

OK, so capex didn’t fall 0.2%, it rose 3.1%, quarter over quarter.  Just a tiny mistake.

Now about that “recession .  .  . “

The map and the territory

I’m still seeing overwhelming confusion in the media about the definition of a recession, and more importantly, what a recession actually is.  Here’s the BEA, which computes GDP:

Recession: how is that defined?

In general usage, the word recession connotes a marked slippage in economic activity. While gross domestic product (GDP) is the broadest measure of economic activity, the often-cited identification of a recession with two consecutive quarters of negative GDP growth is not an official designation. The designation of a recession is the province of a committee of experts at the National Bureau of Economic Research (NBER), a private non-profit research organization that focuses on understanding the U.S. economy. The NBER recession is a monthly concept that takes account of a number of monthly indicators””such as employment, personal income, and industrial production””as well as quarterly GDP growth. Therefore, while negative GDP growth and recessions closely track each other, the consideration by the NBER of the monthly indicators, especially employment, means that the identification of a recession with two consecutive quarters of negative GDP growth does not always hold. 

And here is the NBER, the group that economists consider authoritative on all questions about definitions of recessions:

Q: The financial press often states the definition of a recession as two consecutive quarters of decline in real GDP. How does that relate to the NBER’s recession dating procedure?

A: Most of the recessions identified by our procedures do consist of two or more quarters of declining real GDP, but not all of them. In 2001, for example, the recession did not include two consecutive quarters of decline in real GDP. In the recession beginning in December 2007 and ending in June 2009, real GDP declined in the first, third, and fourth quarters of 2008 and in the first quarter of 2009. The committee places real Gross Domestic Income on an equal footing with real GDP; real GDI declined for six consecutive quarters in the recent recession.

Q: Why doesn’t the committee accept the two-quarter definition?

A: The committee’s procedure for identifying turning points differs from the two-quarter rule in a number of ways. First, we do not identify economic activity solely with real GDP and real GDI, but use a range of other indicators as well. Second, we place considerable emphasis on monthly indicators in arriving at a monthly chronology. Third, we consider the depth of the decline in economic activity. Recall that our definition includes the phrase, “a significant decline in activity.” Fourth, in examining the behavior of domestic production, we consider not only the conventional product-side GDP estimates, but also the conceptually equivalent income-side GDI estimates. The differences between these two sets of estimates were particularly evident in the recessions of 2001 and 2007-2009.

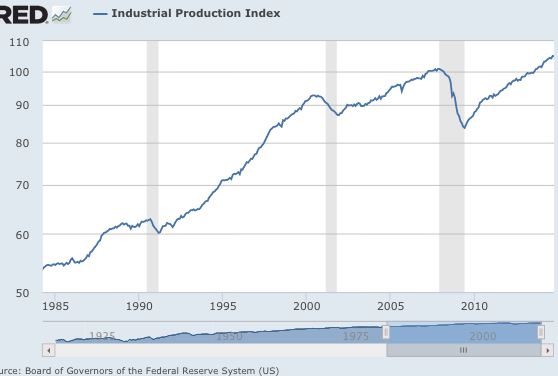
Fortunately, when you look at various monthly indicators, it is usually incredibly easy to date recessions—they look really, really different.  Here’s industrial production over the past 30 years, how many recessions can you spot?

Screen Shot 2014-11-30 at 10.15.08 AM

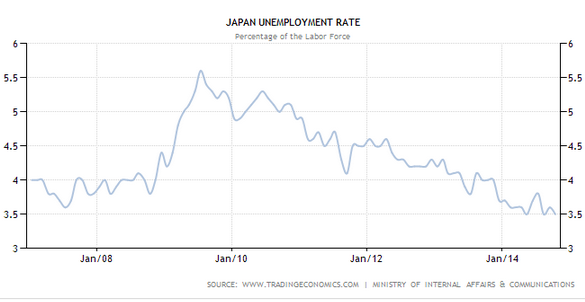
For those readers still struggling with the question, let’s try the unemployment rate:

Screen Shot 2014-11-30 at 10.15.53 AM

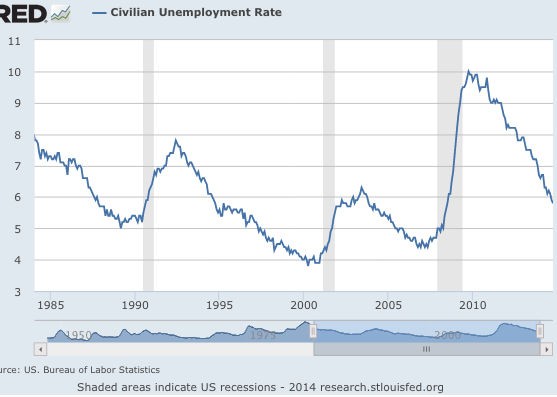
Interesting how the answer “3” keeps popping up.  But the “2 quarters of falling GDP” proponents insist that 2001 was not a recession (even though economists almost universally agree it was), and that Japan has recently experienced a recession, despite a falling unemployment rate.

Recessions really are distinct events.  Why does this matter?  Isn’t it just a question of semantics? By now it should be obvious that words matter.  Many economists think in terms of words, not reality.  The map, not the territory.  Distinguished economists tell me to stop harping on the definition of “tight money.”  But it’s precisely because most economists thought money was easy in 2008 that they don’t believe the recession was caused by a tight money policy of the Fed.  If the Fed had suddenly raised the fed funds target to 8% in early 2008, they would have blamed the recession on the Fed.  They wrongly exonerated monetary policy becasue they don’t understand the meaning of the term ‘tight money.’  In the same way, pundits who wrong believe Japan entered a recession this year are more likely to believe that monetary stimulus in Japan has not boosted AD, whereas it clearly has.

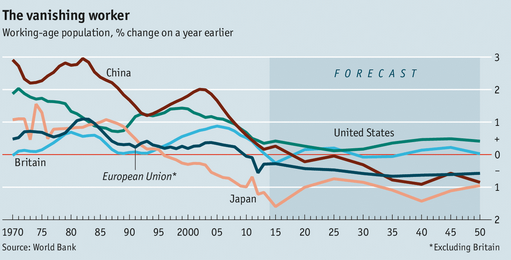
PS.  One LA Times story claimed that Japan has had 4 recessions since 2008!  And no, I’m not joking.  When looking at the following graph keep in mind that sampling errors explain movements of a few tenths of percent.  How many recessions can you spot?

Screen Shot 2014-11-30 at 11.00.48 AM


PS.  I have a new post on oil prices at Econlog.

A quick follow-up on Keynesian economics

Tim Worstall has a new piece in Forbes:

Scott Sumner points us to this interesting proof that the Keynesian economic model must be true. For the Financial Times is crowing about the fact that when government spending rises then so does GDP. And when government spending falls, so does GDP. Thus, getting government to spend more increases GDP. Proof perfect that the Keynesian model works! Unfortunately there is a little flaw with this argument. That flaw being that right at the beginning, when we define GDP, we say that an increase in government spending increases GDP. It’s absolutely nothing at all to do with the Keynesian model, nor any other economy model: it’s an attribute of the way that we calculate GDP, nothing else.

Just to be clear, I believe that if it could be shown that an increase in G will lead to an increase in GDP, at least over any significant period of time, then it would prove the Keynesian model, at least to some extent. And there are a few cases where it is true, at least to some extent.  Tim is looking at an entirely separate issue, whether government spending actually has any value.  That’s a very important point, but I’m more interested in whether it creates jobs (which I doubt.)

In the post he links to I was making a different point.  I was amused that Jim Edwards pointed to a graph that refuted the conservative criticism of Keynesianism.  What did the graph show? It showed changes in government spending (as a share of GDP.)  It showed “delta G.”  And that was it.  It showed that when G changes, G changes.  Let me repeat that in case it went over your head.  It showed that when G changes, G changes.  That was the proof.  I thought that was really funny, but I guess it went right over the heads of some of my commenters. The post had nothing to do with the validity of the Keynesian model.

Why the Japanese economy is slowing, and will continue to slow:

From Free Exchange:

Screen Shot 2014-11-27 at 8.29.47 PM

Check out the Japanese labor force “growth” rate in 2015. Soon we’ll be discussing the “trend rate of shrinkage” in various OECD countries.  We’ll need a whole new vocabulary.

PS.  I just saw that the unemployment rate in Japan fell again in October, to 3.5%. That’s the lowest rate in more than 16 years.  Gee, I wonder when their unemployment rate will start showing the effects of the “recession” that Japan fell into eight months ago.  Anyone want to offer a guess?

Meanwhile there is this tidbit:

The number of employed persons in October 2014 was 63.90 million, an increase of 240 thousand or 0.4% from the previous year.

Japan’s workforce is shrinking rapidly, and to make things worse they are in a “recession,” and yet by some wondrous and strange miracle their employment keeps rising!

Yup, that April sales tax increase sure was a disaster.  If they’d only listened to Paul Krugman the unemployment rate today would be  .  .  .  3.5%?

PPS.  And file this FT piece under, “why the media should never again discuss inflation”:

The sharp fall in oil prices provided an immediate and welcome fillip to Asian economies heavily dependent on energy imports, although the inflation-sapping effect was a mixed blessing for Japan and China.

.   .   .

For Japan, the world’s third-largest oil importer, lower input costs stand to help manufacturers and households, in turn lifting wages and the economy. But lower import bills also frustrate government efforts to lift the economy out of deflation through aggressive monetary easing.

Japanese core inflation last month fell to 0.9 per cent, a 13-month low. Economists say a further erosion in inflation from lower oil prices will raise expectations that the Bank of Japan will once again beef up its stimulus efforts.

That would lead to a steeper depreciation in the yen, which in turn could mitigate the positive impact of falling oil prices on the purchasing power of Japanese households.

Yes, and winning Megabucks would be a mixed blessing for me—I’d become ultra-rich, but it would frustrate my goal of minimizing my tax liability.

PPPS.  Neo-Fisherism is now almost indistinguishable from MM.

Finally! Proof that the Keynesian model is true

Matthew Klein has a useful piece in the FT that shows the way that government spending has fluctuated over time.  The data is reported as if changes in G passed through one for one into changes in GDP. It wasn’t clear to me why this data was important, but then I’ve never really understood the appeal of Keynesian economics.  That is, until I read the explanation from Jim Edwards over at Business Insider:

Conservatives Will Hate This: Proof That Government Spending Cuts Hurt Economic Growth

Edwards explained to me what I missed in the Klein article–proof that government spending boosts GDP:

It’s the oldest battle in politics: Whether cutting government spending helps or hurts economic growth.

The Financial Times has done everyone a favour by publishing a series of charts on how US government spending contributed, or detracted from, GDP growth. And the conclusion is pretty severe:

… austerity subtracted about 0.76 percentage points off the real growth rate of the economy between the middle of 2010 and the middle of 2011. If real government spending had remained constant at mid-2010 levels and everything else stayed constant, (yes we know these are big assumptions) the US economy would now be about 1.2 per cent larger.

There’s a secondary conclusion, too: War is good (economically), it turns out.

Edwards doesn’t bother using quotation marks, but the longer paragraph is taken from Klein.

Update:  Travis told me the lack of quotation marks was Yahoo/Finance’s fault, not Edwards.

Now you might notice that Klein refers to the “big assumptions,” which suggests that he doesn’t see his article as providing definitive proof that conservatives are wrong about fiscal stimulus.  Fortunately Edwards has the courage of his convictions.  He points out that Klein has the data to back up his claims:

This chart, from the FT’s Matthew Klein based on data from the BEA, seems to show that government has a pretty straightforward effect on GDP. When spending goes up, it adds to economic growth. When it goes down, it subtracts from it and hobbles the economy:

Screen Shot 2014-11-27 at 7.28.59 PM

Perhaps you are having trouble seeing the “proof.”  Let me help you.  The red is the state and local government contribution to growth.  This is the change in spending divided by GDP.  The blue and green are the federal defense and non-defense contribution to growth.  Add up all three and you get the total government spending contribution to growth.  So the graph shows that changes in government spending have a “pretty straightforward effect” on GDP.  The evidence is clear.

Still don’t see the evidence?  OK, let’s try again.  Each color shows the contribution of changes in government spending.  It’s the actual change divided by GDP.  Add them up and you get the black line.  That’s the total contribution of changes in G to GDP.  That’s pretty clear evidence, isn’t it?

Still having trouble?  OK, read the article again, and think deeply about the Keynesian model.  It’s sort of one of those vase/face deals—if you think hard enough you’ll eventually see what Edwards sees, that these graphs prove that conservatives are wrong.  If you still don’t see it . . . well just try harder . . .

PS.  Tyler Cowen has a very good post on Keynesian economics.  Unfortunately he gets a bit wobbly in point 15, and concedes too much.  I suggest deleting point 15 from his list and in its place repeating point #1.  Better yet repeat point #1 a hundred times in a row.

PPS.  Klein’s piece is actually pretty useful as a source of data, as long as you realize when you are reading the piece that he is not talking about the stance of fiscal policy, he is talking about government spending.  Fiscal policy involves both tax and spending changes, and the numbers would look radically different if you wrote a piece evaluating the impact of fiscal policy.

HT: Marcus Nunes