Skeptical of the China data skeptics
The problem with answering comments is that one has to swat down one conspiracy theory after. One recurring theme is that the China GDP data is fake. People breathlessly report obscure data on electricity production or rail shipments. I don’t doubt that the Chinese data is flawed, but there’s no reason to assume it’s not broadly correct. You need to look at the big picture, and with China I mean really big.
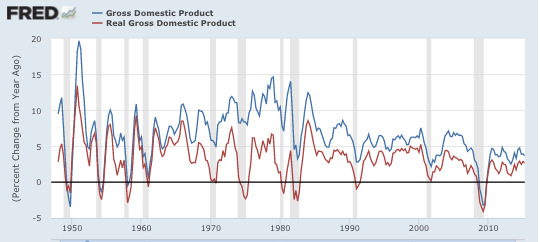
1. The quarter-to-quarter data is strangely smooth (although that’s partly an artifact of their use of year over year, rather than quarterly data.) But over the business cycle RGDP growth varies as much as in the US, indeed even more.
2. People forget that until recently China had 10% trend growth, so when it goes from 14% to 7%, that’s a big slowdown. People also forget that some sectors of the Chinese economy are probably growing smoothly. Health care, college education, subways rides (which are constrained by capacity), etc. So if the overall RGDP growth rate slows from 14% to 7%, and some sectors are growing smoothly at 10%, then the cyclical sectors are slowing extremely rapidly. And the cyclical sectors are also the commodity intensive sectors. You could easily see lots of industry data that seems inconsistent with a 7% RGDP growth rate, during a cyclical slowdown.
3. People sometimes argue that the trend rate has not been 10% in recent decades, but more like 7% or 8%. The problem with these conspiracy theories is that China’s just too big and open to world trade to cook the books in that way. That’s because over the period since 1980, that kind of cheating would lead to China’s RGDP being overstated by a factor of 2 or 3. China would now be far poorer than claimed. (Having said that, trend growth is slowing, and will probably be 5% to 6% over the next decade.)
4. The World Bank has China’s RGDP/person in PPP terms at 72.7% of Mexico, which seems about right to me (I’ve visited many areas of both countries.) By comparison, India’s at 33% of Mexico. Does anyone think China’s even close to India? Yes, China has poor rural areas, probably more than Mexico. But some rural areas (like the highly populated Yangtze delta) are much richer than you’d think.
5. These theories would also require cheating on all the sectoral data. But trade data is two sided, and other countries also report soaring Chinese exports since 1980. Chinese consumers buy 20 million cars per year, vs. 1 million in Mexico. And yet the poorer China has only 11 or 12 times Mexico’s population. India, with almost as many people as China, has a market of less than 3 million cars/year. That’s just cars, but take any appliance you wish and China looks at least as rich as the data shows, at least in terms of purchasing power.
6. Maybe the auto figures are also faked. Maybe VW and GM and all the other western car companies making cars in China are in on the conspiracy. Maybe the Australian mining firms that claim to sell a God-awful amount of iron ore to China are also faking the data, as are the auto parts suppliers. Maybe China’s not the world’s biggest exporter, not the world’s biggest carbon emitter.
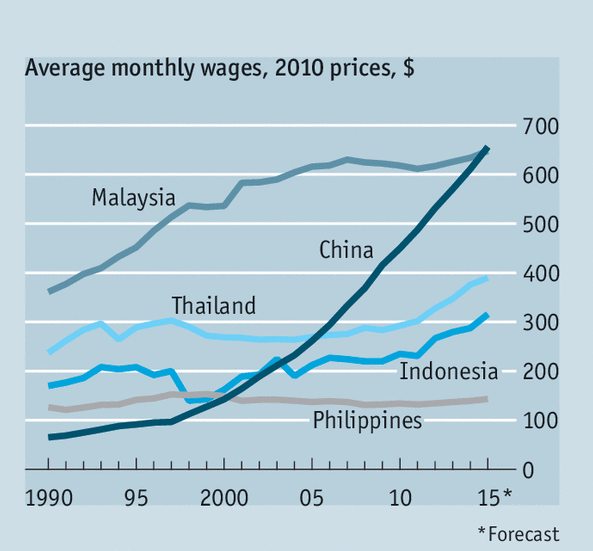
7. Or maybe China really is 72.7% as rich as Mexico. Look at Chinese wages. They only passed the Philippines in 2000, and are now more than 4 times higher. They passed Indonesia in 2003, and are now twice as high. And those two countries have been growing at about 5%/year. Indeed I find that graph hard to believe, given how much richer Malaysia is than China:
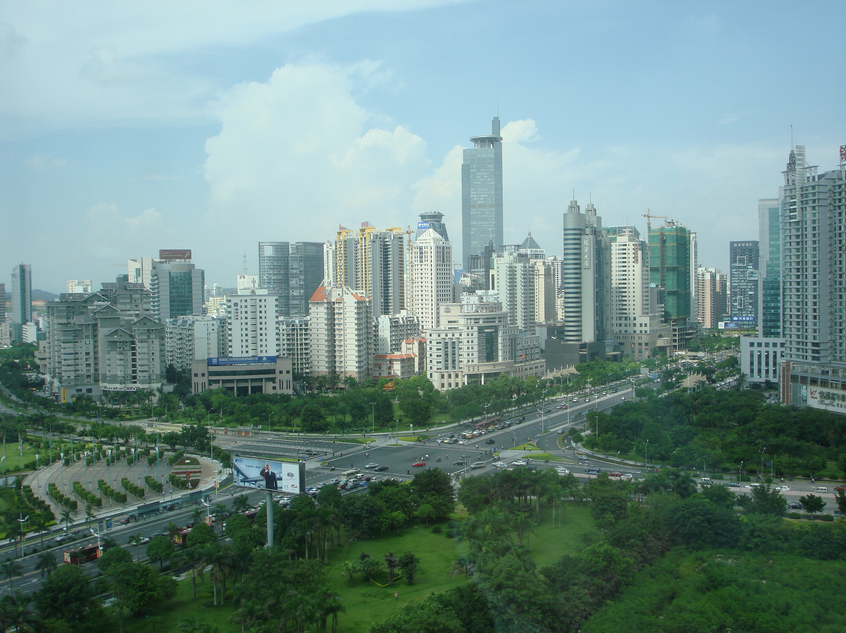
(OK, the previous picture is Beijing, so here’s a pic from Guangxi, one of China’s poorest regions):
 And the next picture is from China’s absolutely poorest province, Guizhou.
(The article I found this picture in says this province is becoming a center of “big data.” Would that happen in Chiapas?):