Archive for November 2013


A crude attempt to translate Rowe/Krugman/DeLong into monetarism

As readers know I’m not very good at mathematical economics.  Actually that’s not quite right, I’m pretty good at that part of math called “geometry,” but not so good at that part of math called “algebra.” Unfortunately most economists don’t consider geometry to be math.  So most people will want to skip this post, where I try to translate Paul Krugman’s geometric critique of Steve Williamson into monetarist language. There’s about an 85% chance I am wrong, but I’m hopeful that my smarter commenters can tell me why.

Even worse, I cannot draw graphs, so I will verbally describe changes on a graph. Anyone still reading?  I did find a graph on the internet that looks roughly like what I have in mind, however the horizontal axis in my graph is next year’s NGDP (or price level) and the vertical axis is next year’s monetary base.

Screen Shot 2013-11-30 at 9.42.52 AM


              Why the U-shape?  Recall that countries with no NGDP growth have low interest rates and hence a high demand for base money.  In Japan the base is more than 20% of GDP.  In Australia, a country that averages 6% NGDP growth, it’s only 4% of GDP.  In Zimbabwe it is (was) still lower. However the growth rate of NGDP in Zimbabwe is so fast (or was a few years ago) that the total base is still much higher than it would have been with 6% NGDP growth, despite being even a lower percentage of GDP.  On the other hand the difference between 0% NGDP growth and 6% NGDP growth is trivial compared to the difference between the base being 20% of GDP and 4% of GDP.

Let me illustrate this with a specific example.  We start at the Australian position, near the bottom of the U-shaped graph.  Now the central bank contemplates three possible policies: status quo, the Japanese option, and the Zimbabwe option.  (No idea why they’d want to move.)  Assume policy is 100% credible.  My claim is that a move toward the Japanese option would actually require a larger monetary base, as the slowdown in NGDP growth would be trivial compared to the jump in demand for base money as a share of GDP, from 4% to 20%.  Moving that way would force the central bank to print lots more base money, despite the slower NGDP growth and inflation. Sound far-fetched?  Check out the US since 2008.  We’ve seen the slowest NGDP growth since Herbert Hoover, and a big surge in the base.

The other direction is easier to explain.  It’s common sense that moving toward Zimbabwe hyperinflation would require a bigger base, despite being a smaller share of GDP.  After all, they had individual currency notes of $100 trillion.

Now draw a horizontal line that cuts the graph in two places.  The intersection on the left is likely to be at the zero interest bound, or very close.  The right is the more “normal” equilibrium.  I believe the dual equilibrium is related to the indeterminacy problem in ratex fiat money models, but am not sure.  (Here I mean “indeterminacy” in the “multiple equilibria” sense of Bennett McCallum.)

Now we finally get to the Krugman thought experiment.  The liquidity premium for government bonds increases.  That reduces the yield on government bonds relative to other assets.  That then reduces the hot potato effect, as the gap between the yield on government bonds and base money declines.  Less HPE is just another way of saying the demand for base money increases at any given level of NGDP.  This means the U-shaped graph shifts vertically upward.  At the equilibrium on the right side (the “normal” case) the equilibrium point shifts to the left.  Next year’s NGDP declines, just as you’d expect.  But the equilibrium on the left side moves to the right, suggesting that more demand for base money is expansionary.  That’s the case where Krugman criticized Williamson, translated into monetarism.

Or perhaps I’m in way over my head.

PS. This post is motivated by posts by Nick Rowe, Paul Krugman, and Brad DeLong.

From the blogosphere

Today I’ll link to some other interesting posts:

1.  Market monetarism is not haram

Left Outside has a fascinating post on Iranian monetary policy and the Islamic prohibition on “interest.” Because I’d like to ban discussion of all the “I-words” (interest rates, income, inflation, etc.), his post made me slightly more sympathetic to the Islamic religion.

Screen Shot 2013-11-29 at 10.19.58 AMThis is cool! [1] Hassan Rouhani talking about monetary policy? Could I be any more excited? No.

Despite inventing zero, arabs have no use for it, [2] at least not when it comes to central banking. Lending money at interest is haram in Islamic finance so the use of interest rates to control demand as is normal in the west doesn’t apply. So does this also means that unlike in the UK and the US there is no danger of interest rates going to zero and the economy entering the liquidity trap?

.  .  .

Sukuk is also an important concept too. This is similar to a bond in which interest is regularly paid on a principal. However, because riba is haram in Islam it cannot be structured like this. Instead sukuk imply a transfer of ownership and can look like a form of repurchase agreement. You agree to repurchase something at a certain price over a certain period of time. This echoes previous posts of mine of what saving really is. Interest rates are just symbolic, what is really happening is people buying durable things today with an expectation they will be able to sell them on for more in the future. Interest rates are our way of expressing that, Murabahah or Sukuk are another. The latter seems clearer and more honest on the mechanism actually.

(At this point, I do want to point out to all the snooty economists, engineers, mathematicians who mock post-modernism…who’s laughing now?)

.  .  .

As Lorenzo tells me, actually the Indians invented zero as a concept, the Arabs were miles behind. More here.

PS.  When I said I wanted to ban all discussion of “income,” I was referring to the microeconomic concept that includes things like “capital gains,” which are not a part of “national income.”

2.  Monetary offset

Yichuan Wang has a really nice Quartz piece on monetary offset.  Here’s an excerpt:

To get an idea of how bad it could have been, one need only look to the Euro zone. As measured by changes in Cyclically Adjusted Primary Balances, a measure of whether of government spending that adjusts for the business cycle, both the US and Europe have endured savage government austerity. Yet nominal GDP growth in the US has been steady while Europe’s has collapsed.

Screen Shot 2013-11-29 at 10.38.09 AM
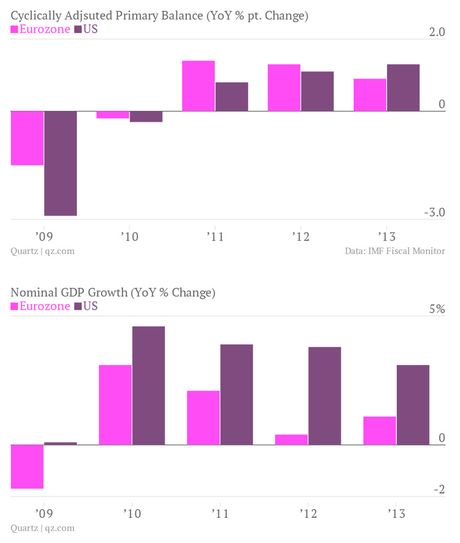
The biggest difference? Monetary policy. While the Fed been a proponent of holding down interest rates throughout the recovery, the European Central Bank actually raised rates in response to inflation fears in 2011, and just recently lowered its benchmark interest rates to 0.25%.

This experience has also shown that deleveraging isn’t a roadblock to monetary policy. From the peak of the crisis, the ratio of household liabilities to annual consumption fell around 26 percentage points from its peak of 1.44 in the second quarter of 2004. Theoretically, this should have meant that the drawdown in federal spending should have been a double whammy””both by directly lowering spending as well as hurting balance sheets. Yet the recovery barely budged, showing that even when people are paying down their debts, monetary policy can still help.This experience has also shown that deleveraging isn’t a roadblock to monetary policy. From the peak of the crisis, the ratio of household liabilities to annual consumption fell around 26 percentage points from its peak of 1.44 in the second quarter of 2004. Theoretically, this should have meant that the drawdown in federal spending should have been a double whammy””both by directly lowering spending as well as hurting balance sheets. Yet the recovery barely budged, showing that even when people are paying down their debts, monetary policy can still help.

3.  Are the Obamacare cost controls “good deflation?”

Greg Ip has an interesting piece at Free Exchange:

Therefore, a decline in the price of health services may help consumers at the expense of producers. Ordinarily, this would not be a macroeconomic issue. But it is when inflation is already too low, in which case this deceleration in prices is potentially bad.

I say “potentially” because in some circumstances, lower prices are a net positive for the economy. For example, higher productivity would enable providers to lower prices with no loss of income. Obamacare contains many incentives to raise efficiency, such as penalizing hospitals for high readmission rates, but there’s little evidence productivity as a whole has risen enough to tip the overall trend. Most of Obamacare’s impact on spending has been through brute reduction in payments: to Medicare Advantage plans and to hospitals who treat Medicare patients. The Administration hopes providers will cope with lower payments by finding new efficiencies; but they may instead simply accept lower profit margins, though over time that could drive providers out of the market, reducing supply; or they may negotiate lower input costs. And since health care is labour intensive, that means wages.

At first glance he seems to be assuming that all deflation is demand-side deflation, and hence contractionary.  On closer inspection he does draw a distinction between productivity improvements that leave NGDP unchanged and fiscal austerity that reduces Medicare/Medicaid reimbursement.

In my view this sort of reduction in transfers (lower reimbursements) is either a wash, or slightly expansionary.  If the Fed targets NGDP then lower inflation means higher RGDP. If the Fed targets inflation then more aggregate supply is expansionary.  The question is whether or not a reduction in Medicare reimbursements boosts AS.  I.e., whether or not it is a nominal wage cut, when wages are sticky. I think so, but am not certain.

I am indebted to Michael Darda and Saturos for pointing me toward the issues raised by Greg Ip’s post.

4.  Reading between the lines

When reading financial articles always try to think about what you are reading from a monetary policy/expectations perspective.  Here’s a great example from the FT:

“The signal from the Federal Reserve is driving home the point that ‘tapering’ is not tightening,” says Marc Chandler, strategist at Brown Brothers Harriman. “This seems to imply a willingness to see curve steepening, where the long-end retreats some, but that the short-end does not bring forward a Fed Funds rate hike.”

Translation:  Effective monetary stimulus will lead to higher long-term rates.  The key is to make sure those long-term rate increases reflect the impact of policy on growth, and not monetary tightening.  You do that by committing to hold short rates low for an extended period, or better yet until certain macro benchmarks are met.

As recently as late September, with benchmark 10-year US government bonds yielding 3 per cent, the Fed was forced to rule out a widely expected taper as financial conditions had tightened too much, pressuring housing and the economy. A key test is whether forward guidance can keep equities and other asset markets buoyant once the taper is imminent.

“Long-term yields are always central to any measure of financial conditions, but if the mix of other variables such as equities, front end yields and the dollar are behaving, then it’s less of an issue to see a higher 10-year yield,” says Mr Ruskin.

Translation:  Effective monetary stimulus will lead to higher long-term rates.  The key is to make sure those long-term rate increases reflect the growth impact of policy, and not monetary tightening.  That’s why you focus on other asset markets like equities and forex rates.  If equity prices are falling and the currency is strengthening, then the higher rates may reflect tighter money.  As always, an NGDP futures market would be a HUGE help.  The Fed’s failure to create and subsidize trading in a NGDP prediction market represents inexcusable laziness on their part.

5.  Fed misinformation (no pun intended)

I strongly recommend everyone look at this video of George Selgin’s informative and highly entertaining demolition of Fed misinformation on the history of American banking.  I also spoke at the same Cato event, but George was the star of the show.

6.  All hail Mark Carney

Travis sent me the following:

Mark Carney is moving the Bank of England in a direction it hasn’t taken in more than six years.

The governor took steps yesterday to head off a potential housing bubble by diluting a credit-boosting program, two weeks after raising growth forecasts and signaling interest rates might increase sooner than previously projected.

.  .  .

Carney’s measures coincide with evidence that demand and prices are rising. Lenders granted 67,701 mortgages in October, the most since February 2008, the BOE said today. Home values increased 0.6 percent in November, Nationwide Building Society said. They climbed 6.5 percent from a year earlier, the fastest pace since July 2010.

For economists at HSBC Holdings Plc (HSBA) and ING Bank NV, the measures may allow the BOE to keep interest rates lower for longer. That’s because the action by its Financial Policy Committee shows it can use macro-prudential tools to target specific problems in the economy.

“Today’s report is not particularly hawkish,” said Simon Wells, an economist at HSBC in London. “The BOE wants to use new macro-prudential tools to calm the housing market, rather than deploy the blunt instrument of higher interest rates.”

Carney has said he won’t consider raising rates until there is sustainable economic growth. He said yesterday the housing curbs will help him keep that pledge.

That’s right, use monetary policy for NGDP and more targeted policies for housing distortions.

7.  The wisdom of Paul Krugman

Simple doesn’t mean stupid. Thinking that it does, does.

“Bubbles,” cognitive illusions, and the peso problem

Let’s suppose that every once and a while an asset comes along that is extremely difficult to value.  It might have an extraordinarily high value, or much more likely it will soon be worthless.  One example might be a dotcom company (or mobile apps, if that’s the 21at century equivalent.)  Another example might be Bitcoin.

How should Bitcoin be priced?  If there is a 95% chance that it will soon be worthless and a 5% chance that it will soon hit $1000, then $30 seems like a relatively fair price.  That allows for a substantial expected gain ($50 minus interest costs would be the risk-neutral price.)  But Bitcoin is very risky, so investors need to be compensated with an above average expected rate of return.

Now consider a point in time where the asset is selling at $30, and investors have not yet discovered whether it will eventually reach $1000.  Should you predict that the price is a bubble?  Yes and no.  It is likely to eventually look like it was a bubble at $30.  Indeed 95% of such assets will eventually see their price collapse.  That’s “statistically significant.”  It’s also significant in a sociological sense.  Those that call “bubble” when the price is at $30 will be right 95% of the time, and hence will be seen as having the “correct model” of bubbles by the vast majority of people.  Those who denied bubble will be wrong 95% of the time, and will be seen as being hopelessly naive by the average person.  And this is despite the fact that in all these cases there is no bubble, as by construction I assumed the EMH was exactly true.

This post is motivated by earlier predictions that suggested Bitcoins were a bubble at $30, and hinted it might be a bubble at $2.  I predict that eventually the price of Bitcoins will fall sharply (from some level of which I am not able to predict) and people will vaguely recall:

“Wasn’t Scott Sumner the guy who denied Bitcoins was a bubble?  What an idiot.”

Defending the EMH is a lonely crusade that can only end in tears and ridicule, unless you are Eugene Fama, in which case it ends in a Nobel Prize and ridicule.  And I’m not Fama.

And yet the EMH is true . . . er, truish in the Richard Rorty sense.

PS.  The hidden agenda of this post is that spectacular price increases after incorrect bubble calls should count heavily against the bubble model, indeed roughly 20 times as heavily as a correct call in the case above.  Don’t look for reputations to be adjusted according to this metric.  Markets may be rational, but the assignment of scientific prestige in bubble theory is highly irrational.

PPS.  Of course many bubble proponents like Cowen and Krugman and Shiller deserve their high academic reputation, but for reasons unrelated to bubble analysis.

PPPS.  Bitcoin hit $1000 today.

What Germany and China have in common

(Will be home in a few days, until then this post from a week back will have to do.)

Here’s a ranking of per capita GDP (PPP)

1  Luxembourg 91,388 2012
“”  Macau 87,765 2012
2  Qatar 83,460 2012
3  Norway 65,640 2012
4  Singapore 61,803 2012
5   Switzerland 53,367 2012
6  Brunei 53,348 2012
“”  Hong Kong 51,946 2012
7  United States 49,965 2012
8  Kuwait 45,455 2011
9  Australia 44,598 2012
10  Austria 44,208 2012
11  Ireland 43,592 2012
12  Netherlands 43,198 2012
13  Sweden 43,180 2012
14  Canada 42,533 2012
15  Denmark 42,086 2012
16  United Arab Emirates 42,080 2012
17  Germany 40,901 2012
18  Belgium 39,788 2012
19  Finland 38,655 2012
20  Iceland 37,852 2012
21  United Kingdom 36,901 2012
22  France 36,104 2012

Notice that 14 of the 22 richest countries are in Europe.  Western Europe to be more specific. Northwestern Europe to be even more specific.  (I define “north” as “most people live north of the Alps,” but if you drop France, nothing much changes.)  Northwestern Europe is relatively rich. No surprise. What might be a surprise is that Germany is not relatively rich for a northern European country.  There’s actually nothing at all particularly notable about the German economy.  Even its current account surplus is not very large (in per capita terms) by northern European standards.

The only reason why Germany attracts so much attention is because it has a big population.  But even that factor is overstated.  As the following table shows it’s population is larger that that of other European countries, but not dramatically larger.

16  Germany 80,523,700 December 31, 2012 1.13% Annual official estimate
17  Iran 77,066,000 November 19, 2013 1.08% Official population clock
18  Turkey 75,627,384 December 31, 2012 1.06% Official estimate
19  Democratic Republic of the Congo 67,514,000 July 1, 2013 0.95% UN estimate
20  Thailand 65,926,261 September 1, 2010 0.93% 2010 census result
21  France[9] 65,806,000 October 1, 2013 0.92% Monthly official estimate
22  United Kingdom 63,705,000 July 1, 2012 0.89% Official estimate
23  Italy 59,829,079 May 31, 2013 0.84% Monthly official estimate

If the German states became independent countries, essentially nothing would change in Europe.  Affluent Baden-Wurttemberg (home of Mercedes) borders France and Switzerland, two countries with vastly different income levels.  Baden-Wurttemberg’s per capita income is about midway in between the two. Even wealthier Bavaria (home of BMW) borders Austria and Switzerland, and is richer than Austria but poorer than Switzerland. Eastern Germany is richer than Poland but poorer than West Germany, etc, etc. For some reason northwestern Europe is richer than average, and for some odd reason the region just north of the Alps is the richest part of Northern Europe, despite being on the southwestern edge of that region.

China differs from Germany in that it is relatively poor.  But in terms of size it stands out even more.  Just as the Nordics don’t get criticized for their huge CA surpluses, the smaller East Asian states are ignored. Germany and China are the villains.  And although Thailand is about as rich as China, no one pays any attention to how much aid Thailand sends to the Philippines.  But they do pay attention to how much aid China sends.

If you squint your eyes and look at the world a certain way then national boundaries don’t matter, or I should say they matter less and less (as China catches up to the rest of East Asian countries with similar cultures.  They still matter a lot in “Korea”)  But national borders are how the media and most economists organize information.  I share that weakness, often talking about “China” or “Germany” when I really ought to be talking about “Guangdong province” or “Bavaria” on the one hand, or “East Asia” and “Northwestern Europe” on the other hand.  Most articles talking about “Germany” are actually talking about the Nordic/Teutonic region, they just don’t know it.

PS.  A few technical points.  The richest part of Europe is actually Norway, not the region just north of the Alps, but oil affects that result. Bavaria is actually not the richest part of Germany–two small city states and the region containing Frankfurt are wealthier.

PPS.  In a recent post I argued that the China of 2043 will be very different from the China of today, in ways the current government has no control over.  This article hints at the speed of cultural change:

In Beijing’s suburban Daxing district, where several garment factories are located, young workers now flaunt smartphones and sport embroidered jeans, permed hair, and painted fingernails””a far cry from the standard work wear of a decade ago, when many strolled around factories in slippers and pajamas. 21-year-old garment worker He Xiaoje, who resembles a heavily moussed-up young John Travolta and earns 3,000 yuan ($485) per month, seems incredulous that anyone was ever content with just a dumb phone. “If it’s not a smartphone, who will use it?” Like many of China’s migrant workers born after 1980, he has higher aspirations than his predecessors.

“The first generation of migrant workers generally had no chance to get a good education; they didn’t have adequate knowledge or skills to seek better jobs,” says Huang Leping, director of the Beijing Yilian Legal Aid Center, which often assists migrant workers. “But those born after 1980 are different: they have a strong desire to be integrated into city life, and they focus on whether their career can provide social security and other benefits to root them in the cities.” In short, they expect more.

Gone are the days when simply posting a job notice on a bulletin board could bring a wave of fresh applicants to a factory gate. John Liu, the owner of Harderson International, a Dongguan factory that applies paint and decals to glass and ceramics, says he understands why assembly-line work has lost its appeal. “Living conditions in China have improved quickly. Young people now don’t have to work so hard to earn a living, and many have parents who will support them.” As China’s service sector has grown, a range of new employment opportunities have opened up, affording more choices. “A lot of those born in the 1990s can’t stand this kind of repetitive [factory] work, so they choose to stay home or do very simple cashier work,” says Liu. “It’s getting harder to find workers.”

In another 20 years the next younger generation will pity the living conditions of this generation, who pity the living conditions of the workers of 1993.

Memories of the Carter Adminstration

I think it’s fair to say that modern American progressive thought is obsessed with two issues:

1.  The need to defeat GOP obstructionism, so that progressive reforms can be enacted.

2.  The need for higher income tax rates on the rich.

If this is the agenda then California is the ideal.  The GOP is dead and the Dems have dictatorial control.   They just raised their top rate to 13.3%, and they are determined to build a “high speed rail” line from LA to San Francisco.  (The scare quotes reflect the fact that the Chinese would laugh at the “high speed” claim.)

Today I saw a list of the best governed states in America.  California came in 50th out of 50.  In fairness, this ranking was based on 2012 figures, and doesn’t account for California’s recent success in producing a “balanced budget.”  (Scare quotes again—here’s why.)  But next recession their fiscal regime, which is more leveraged to stock market gains than the average hedge fund, will once again collapse like a house of cards.  They have America’s highest taxes on the rich and the following outcomes:

The Golden State was also among the worst states in the nation for educational attainment, health coverage, and unemployment.

Even worse, this policy failure occurred in a state that in many ways is extremely “lucky.”  California has some of the most delightful weather and beautiful scenery in the world.  It is very rich in oil resources. They are able to attract highly productive people to this environment despite high tax rates.  Imagine how California would be doing if they had Texas weather and scenery.

I sympathize with some of the complaints of modern progressives.  Yes, the filibuster is (was?) a bad idea. Yes, the modern GOP has regressed significantly from the Reagan era.  But I think the long period of conservative dominance, and then policy deadlock, has led many progressives to underestimate the difficulties of enacting a liberal vision in a polyglot society of 320 million people.  They have forgotten what caused the conservative resurgence in 1980.  It’s really, really hard to make a big and activist government work.  No one else has made an activist government work in a country so large. And based on the results from California and New York, it also seems difficult to implement in large states.

It’s too bad that JFK died 50 years ago today.  Not for Kennedy himself—no one could dream of having a more perfect life—but for modern liberalism.  It would have been instructive for liberals to see Kennedy fail during his second term, as almost all presidents do.  (And BTW, I believe Kennedy was a reasonably good president.)

PS.  Just to be fair and balanced, here’s an excellent post from Lorenzo showing that conservatives have their own set of problems.

PPS.  Here’s the NYT endorsing the Senate’s filibuster vote:

In a 52-to-48 vote that substantially altered the balance of power in Washington, the Senate changed its most infuriating rule and effectively ended the filibuster on executive and judicial appointments.  . . .

This vote was long overdue.

And here’s what the NYT said in 2005:

A decade ago, this page expressed support for tactics that would have gone even further than the “nuclear option” in eliminating the power of the filibuster. At the time, we had vivid memories of the difficulty that Senate Republicans had given much of Bill Clinton’s early agenda. But we were still wrong. To see the filibuster fully, it’s obviously a good idea to have to live on both sides of it. We hope acknowledging our own error may remind some wavering Republican senators that someday they, too, will be on the other side and in need of all the protections the Senate rules can provide.

That’s right.  During the Clinton Administration the NYT opposed the filibuster. When Bush took over they realized they’d made a horrible mistake, and that the filibuster actually was a wise policy.  No, it was more than a wise policy:

But its existence goes to the center of the peculiar but effective form of government America cherishes.

And now that the Dems are back in power the NYT recognizes that they were right all along, and that their 2005 apology was misguided.

This is why it’s often said that unless you adopt H.L. Mencken’s cynicism, politics will immediately take 15 points off your IQ.  (And we all know people at the Times who have suffered that sad fate.)  There are actually people in New York City, highly intelligent people, who think the Times is a reasonably objective paper.  I’m not kidding.

PPPS.  I won’t have much time for blogging between now and the end of the year. I have some older posts that I’ll put up, but will probably be slow in responding to comments.  I have some traveling ahead.