Archive for the Category Efficient markets hypothesis


Bubble world is here

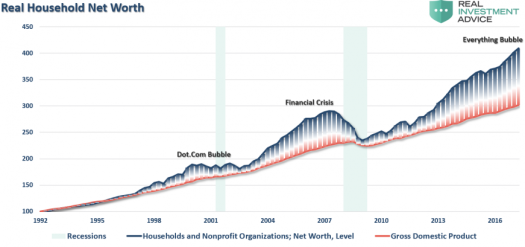
Lance Roberts has a new post with a neat graph:

Screen Shot 2018-07-13 at 7.11.59 PMI like the term “everything bubble”.  For a number of years I’ve been claiming that the 21st century would be full of “bubbles” that were not actually bubbles.  In other words, asset valuations would be higher than expected based on traditional valuation methods, but nonetheless justified.  This is from the spring of 2015:

In the 21st century, pundits will be unable to see anything other than recessions and “bubbles.”  There will no longer be periods of stable growth without “bubbles,” like the 1960s.  Of course bubbles don’t actually exist, but low interest rates as far as the eye can see means that asset prices will look bubble-like unless artificially depressed by a tight monetary policy that drives the economy into recession.

Of course we were told back in 2015 that this was all an artificial bubble due to QE, which is now being withdrawn as the Fed raises rates.  And yet asset prices keep rising.

Back in 2011 I challenged Robert Shiller’s pessimistic take on stock prices:

But (seriously) are stocks now overvalued?  Because I’m an efficient markets-type, the only answer I can give is no.   So why does Robert Shiller say yes?  Apparently because the P/E ratio is relatively high by historical standards.  And he showed that for much of American history investors did better buying stocks when P/Es were low than when P/E ratios were high.  Of course hindsight is 20-20.

I’d rather not get into the minutia of all the various ways of calculating P/E ratios.  And I have no idea where stocks are going from here.  Instead I’d like to focus on three arguments for relatively high P/E ratios in the 21st century American economy (however you’d like to measure them):

Of course I was careful not to predict rising stock prices, as if I had been successful it would lower my reputation.  I’m an EMH guy who claims it’s impossible to forecast stock prices.  But I did challenge Shiller’s claim that P/E ratios were too high in 2011.  That judgement may have been valid in the 20th century, but performance in past centuries is no guarantee of performance in the current century.

Again, the 21st century is the “bubble” century.

PS.  I was amused by this exchange in a recent NPR interview of Jay Powell:

Ryssdal: Let me ask you then about inflation and about prices which are as you say starting to tick up to where the Federal Reserve wants it to be. I’ll note here that we’re talking at 8:24 in the morning on the day that consumer prices come out. They come out in six minutes. With the caveat that this is going to air now in five, six hours from now, whatever it is, you have the number in your back pocket, you know what the number is. Inflation CPI?

Powell: Well, let’s just say that I do get a look in advance at these things. Yes.

Ryssdal: You’re not going to tell me what it is even though we are not going to air this until —

Powell: Definitely not. Definitely not.

Ryssdal: Score one for the chairman’s adherence to the rules.

Powell: Not going to say anything that would suggest what it might be.

Not even a tweet?

HT:  Pat Horan

The market and the Fed

Stephen Williamson recently made this observation:

As a side note, I thought the part of the FOMC discussion where the staff gives a presentation relating to an alternative indicator – the difference between the current fed funds rate and what the market thinks the future fed funds rate will be – was good for a chuckle. If the FOMC thinks the market knows more about what it’s going to do than what it knows about what it’s going to do, we’re all in trouble.

I have the opposite perspective; we are in big trouble if the FOMC thinks it knows more than the market about what it will do to rates in the future.

Back in late 2015, the Fed began raising their target interest rate.  At the time, they anticipated another 4 rate increases in 2016.  Markets were skeptical, expecting only about one rate increase in 2016.  In fact, rates were not raised again until the very end of 2016.  That’s because economic growth and inflation during 2016 were below Fed expectations.  The markets were correct on this occasion (not always).

If you want an efficient estimate of the future path of interest rates, look at the market forecast, not the “dot plot”.  The dot plots are primarily useful as a measure of how deluded FOMC members are in their appraisal of the economy.  Because they were too optimistic in late 2015, they set rates too high.  That slowed the recovery, and probably tilted the (very close) election toward Trump.  And now, to quote Williamson, “we’re all in trouble”.

Interest rates are now higher than in 2016, but monetary policy is actually more expansionary than two years ago.  To Williamson’s credit, he is one of the few economists who seems to understand how this can be possible.

HT:  Tyler Cowen.

Nasdaq vs. safe investments

This is a follow up to my recent post on the tech bubble.

In my view, 3-month T-bills are the best asset for estimating nominal risk-free returns that can be earned at various moments in time.  During some periods of US history, it’s possible to earn very large nominal risk-free returns (real plus inflation).  During other periods, nominal risk-free returns are depressed by a variety of factors.  During these challenging periods, other investments may or may not struggle to earn high nominal returns.  Usually they will struggle.  (Consider 1929-45).  Nonetheless, it seems reasonable to compare the performance of other investments to this risk-free benchmark.  If you don’t see why, read my previous post, especially the example of why the 30-year Treasury bonds yielding 15% in 1981 was misleading. (A commenter pointed out that those interest payments could not be reinvested at 15%, but it was still a pretty impressive nominal investment, ex post.)

Unfortunately I don’t know how to find the figures I am looking for, but I’ll present my estimates, and then let commenters who work in finance correct my numbers:

1.  A series of investments in 3-month T-bills from the end of 1999:  Roughly a 35% to 38% total nominal return. (Based on a quick look)

2.  Investing in NASDAQ at the end of 1999 (at 4069), then reinvesting dividends:  Roughly a 121% total return.

3.  Investing in NASDAQ at the absolute peak in March 2000 (at 5048), then reinvesting dividends:  Roughly a 78% total nominal return.

My point is not that those Nasdaq returns are all that impressive (especially if you were unlucky enough to buy at the absolute peak), but rather that these returns were earned in a very challenging investment climate, where risk-free returns were quite low.

It’s not obvious to me that the difference between 121% and 37% isn’t enough to compensate investors for the extra risk from Nasdaq stocks  compared to long term investments into a series of T-bills.  As I mentioned earlier, the excess returns earned by stocks from 1926 to 2000 were probably excessive, in retrospect, even accounting for risk.

Here’s how I’d put it.  In 2002, the consensus view was that 2000 had obviously been a bubble, and that Nasdaq stocks were obviously grossly overpriced at that time.  Given what we know today, a fair-minded observer would say that Nasdaq stocks may have been overpriced in 1999-2000, but it’s no longer a slam dunk that an extreme bubble ever existed.

PS.  I tried to find total returns on Nasdaq, but could only find them for the past 10 years.  During that period, 10,000 invested in Nasdaq, with dividends reinvested, rose to 36646.  But the index itself (ignoring dividends) rose by a smaller amount.  Thus 10,000 invested 10 years ago would now be 32750, if you ignore dividends.  The total return figure of 36,646 is about 11.9% higher than the simple increase in the index, over the past 10 years.  So it seems reasonable that over 18 years the total return figure (including dividends) is about 20% higher.  Thus you’d want to calculate total returns as if Nasdaq were about 9000 today (not 7500) relative to investments back at the end of 1999.  Does that make sense?  That’s how I got my estimate of total returns.

Of course real returns would be lower, but they’d be equally lower for any alternative investments (such as T-bills), so it would be a waste of time to work with real variables, even if the inflation numbers were not unreliable.

PS.  Why don’t our history books call July 2002 to April 2003 a “negative bubble” for Nasdaq?  It ranged from 1100 to 1500.  More importantly, why isn’t there even a word for negative bubbles?

PPS.  Even more importantly, why isn’t there even a word for big plunges in NGDP growth?

Happy 4th of July to my American readers.


Was the 1999-2000 tech “bubble” a bubble?

After my previous post, several commenters argued that I did not present persuasive evidence against the view that Nasdaq was in a bubble at the end of the 20th century.  They often made the following argument:

While the current level of Nasdaq is well above the 2000 peak value (of roughly 5040), the rate of return on Nasdaq has been far below the rate of return on alternative investments that are much less risky, such as T-bonds.

This is certainly a reasonable argument, but I find it unpersuasive for several reasons.  I’ll list them in order.

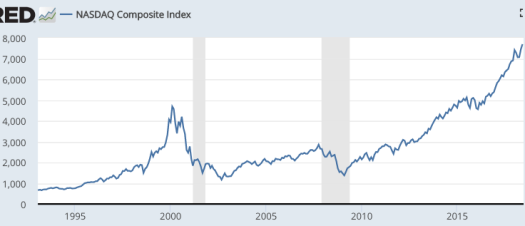
1.  I don’t think it’s reasonable to compare current prices to the absolute peak of the tech boom, which only lasted for a few days.  Whenever you look back on an asset price time series, the absolute peak level will usually look overpriced, in retrospect.  Importantly, that would be true even if there were no such things as bubbles. As an analogy, bubble predictions of Bitcoin have proved spectacularly wrong.  There were many people claiming that Bitcoin was a bubble at $30, then $300.  Last time I looked it was near $6000.  On the other hand, the absolute peak of Bitcoin was more like $19,000.  And yet I don’t think you could argue that Bitcoin was a bubble just because it briefly hit $19,000.  It’s pretty apparent that there is huge uncertainty as to what Bitcoin is worth.  Perhaps if it falls far below $30 then those who called Bitcoin a bubble at $30 can claim vindication.  But not at $6000.

2.  So here’s what I’d say.  There were widespread claims that Nasdaq was a bubble throughout the entire mid-1999 to mid-2000 period.  Most of the time, the market was trading in the 3000 to 4000 range.  Thus the current level of Nasdaq is roughly twice the level of the so-called bubble period.

3.  Even this, however is not enough to rebut my critics.  After all, T-bonds were yielding over 6% during the peak of the tech bubble, and they are a safer investment than tech stocks.  Here I’d point to the fact that long term bonds benefited hugely from an unexpected plunge in interest rates.  During most of the past 18 years, T-bills have yielded close to 1% (a bit above or below.)  And T-bills are an even safer investment than T-bonds.  For instance, I recall reading that long-term Treasury bonds lost 50% of their value during the Jimmy Carter years, even before inflation!  Then in 1982 their total return was over 40%, in a year of about 4% to 6% inflation (depending whether measured calendar year or year over year.).  That’s a pretty volatile asset.  Suppose you’d  bought a 30-year Treasury in 1981, yielding 15%.  Then suppose a friend had bought a stock that (ex post) yielded 11%/year over 30 years.  Would this suggest that the stock was overpriced in 1981?  No, it simply shows that the T-bond did far better than expected, in a relative sense.  After 1981, NGDP growth and inflation slowed sharply, which made T-bonds a great investment, ex post.  That inflation slowdown obviously reduced the nominal return on many alternative assets, such as stocks.

4.  Several commenters pointed to the fact that even (real) TIPS yields were pretty high in 2000, and Nasdaq has done poorly in real terms, relative to TIPS.  But the preceding argument also applies here.  Real interest rates also plunged sharply and unexpectedly during the 21st century.  Indeed they’ve often been negative.

5.  If you are having trouble with this argument questioning the relevance of bond yields, I can flip it around to make tech stocks look better.  Think about why interest rates plunged unexpectedly.  Much (not all) of the plunge was due to an equally unexpected plunge in trend NGDP growth, which has been far slower than expected during the 21st century.  If NGDP growth had been as fast as expected, fast enough to justify those 6% T-bond yields back in 2000, then Nasdaq would have also grown far faster.  In that case, Nasdaq would almost certainly be far higher today, say roughly 10,000.  Also, don’t forget that back in 2000, capital gains taxes were far lower than taxes on bond interest.  That made tech stocks especially attractive.

So here’s my argument.  Let’s go back to when Nasdaq was 3500 during the tech boom, a level certainly considered bubble by people like Robert Shiller (recall his initial bubble call was in 1996, when Nasdaq was barely over 1000).  I claim that this 3500 Nasdaq value was rational, if you assume NGDP would grow at the rate that bond market participants probably expected it to grow (say 5.5%/year).  If that growth had occurred, then Nasdaq would now be closer to 10000, and the market would have roughly tripled (plus dividends.)  Admittedly, even that sort of return would have been a bit lower than the historical average since 1926, but I believe markets have done well since the 1980s partly because of a growing realization that stocks were undervalued during most of the 20th century.  Thus a part of the 1982 to 2000 stock price boom was a sort of “catch up” as investors realized Shiller’s model was wrong, and historical valuations were too low. (Or historical rates of return were too high, given the risk involved, if you prefer to think that way.)  As an aside, I believe that’s why Shiller has done such a poor job of giving investment advice in the 21st century—not telling people to buy in 2009, and then saying stocks were overvalued a few years later, when in fact everyone should have been buying.  He has the wrong model, which undervalues stocks.

6.  Now let’s think about the justification for the bubble claims.  In 2000, people argued that all of these companies couldn’t be successful.  That’s true but not relevant; only some companies needed to hit the jackpot.  People also argued that these valuations only made sense if internet oriented companies eventually grew to utterly dominate the US economy.  Well, today the so-called FAANG stocks do dominate the stock market, with market valuations that dwarf the traditional corporate giants like GM, GE, etc.  I recall people mocking companies like Amazon, which made no profits year after year and were focused on growth.  So who’s the richest guy in the world right now?

Almost every single argument used against my EMH position when I started blogging in 2009, now looks far weaker.  Both Nasdaq and US housing have at least mostly recovered, even relative to trend.  The above market returns of the Ivy League school endowments are mostly gone.  Ditto for the above market returns for the hedge funds.  Bitcoin didn’t crash when it hit $30.  The people who told me the Canadian and Australian housing bubbles would crash “any day now” are still waiting, 9 years later.  And what about the overbuilt Beijing and Shanghai property markets?  Anyone willing to sell me property at 2009 prices in those two cities, widely regarded as a “bubble” even a decade ago?

I can’t prove the tech bubble was not a bubble, just as I can’t prove that people like Warren Buffett and Cliff Asness did not become rich by finding market inefficiencies.  I’d be shocked if there wasn’t an occasional case of someone spotting a market inefficiency. Almost all social science theories are technically false, in the sense that they are not completely true.  But the EMH is far less false than most of the very useful theories we teach in economics.  It’s much easier for me to find industries that violate the laws of supply and demand (say due to market power) than it is for me to beat the stock market.  I believe that 99.9% of investors should assume the EMH is true, and thus buy and hold index funds.  I believe regulators should assume the EMH is true, and thus not try to spot and pop asset price bubbles.  I believe that academic economists should assume the EMH is true, and thus replace 20th century macro with a new macro centered around real time market forecasts of expected NGDP growth, not VAR predictions of inflation and real growth.
 

Natural experiments: Can we handle the truth?

Natural experiments are being conducted all the time.  And yet I often feel like people really don’t care about the outcome of these experiments.

Let’s consider 5 popular hypotheses:

1.  The mortgage interest deduction has a major impact on the housing market.

2.  The NASDAQ was obviously wildly overvalued in 2000.

3.  Switzerland was forced to revalue its currency in January 2015.

4.  The US housing market was obviously wildly overvalued in 2006.

5.  Brexit would cause a recession in the UK economy.

In my view, natural experiments have strongly suggested that all 5 of these hypotheses are false.  And these are not trivial unimportant hypotheses, they were widely held views about some really important issues.

1. The tax bill that passed last year sharply cut back on the mortgage interest deduction.  Before that happened I read about 1000 articles warning that if we took away this deduction it would severely hurt the housing market.  We didn’t completely eliminate the deduction, but it’s more than half gone.  And yet housing continues to boom.  I have yet to see a single news article discussing this important natural experiment.

2.  The Nasdaq is now far higher than in 2000.  Of course it could be wildly overvalued today.  Unlike in 2000, however, there is no widely held view that it is wildly overvalued today.  That’s a problem for the hypothesis that it was wildly overvalued in 2000.  If true, why don’t people feel that way about the current stock market?  And you can’t point to changing economic circumstances, such as lower nominal interest rates, as those factors are linked to other changing economic circumstances, such as an unexpected slowdown in trend NGDP growth.  I.e. where would Nasdaq be today if NGDP had grown during 2000-18 as rapidly as people expected back in 2000?  Maybe 10,000?

Screen Shot 2018-06-24 at 12.31.44 PM

3.  Tyler Cowen correctly noted that Denmark would provide a good test of whether Switzerland was forced to revalue in January 2015.  We now know that Denmark was not forced to revalue.  Even worse, evidence suggests that the Swiss revaluation did not have the intended impact on the SNB balance sheet, which kept growing. That was claimed as the reason the Swiss needed to revalue.  And yet despite this natural experiment, experts continue to claim that the Swiss were forced to devalue, as in this recent podcast. It seems obvious to me that the Swiss simply made a mistake—are there any good counterarguments?

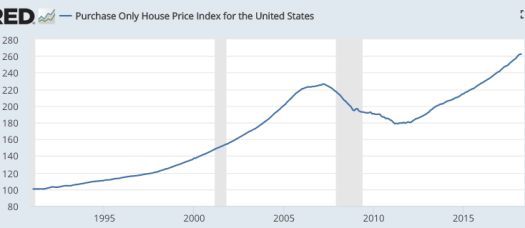
4.  There are two powerful pieces of evidence against the claim that the US housing market was overvalued.  First, many who made that claim also said the same thing about housing markets in Canada, Australia, the UK, and other countries.  And yet many of those other countries did not crash.  Even worse, America’s housing market has mostly recovered, and yet I see almost no one currently saying “America’s in a huge housing bubble, and when it crashes we’ll have another Great Recession”.  So why continue to claim the 2008 recession was caused by a housing bubble that no longer even looks like a bubble at all?  (And don’t point to housing construction; that’s shifting the goalposts.  In 2008, everyone pointed to the historically high level of house prices in 2006; housing construction never reached unusual levels during the boom.)

Screen Shot 2018-06-24 at 12.30.41 PM

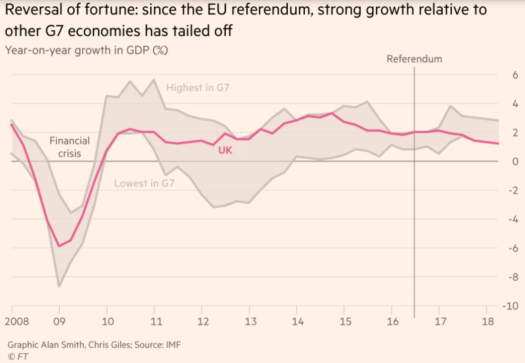
5.  This one hasn’t been entirely ignored, as the Brexit supporters pointed to a strong economy after the June 2016 vote.  The Financial Times claims that Brexit is now slowing British growth:

Screen Shot 2018-06-24 at 4.01.02 PM

In my view it’s too soon to claim that Brexit is slowing growth.  I expect it will, but the graph the FT presents does not look statistically significant to me.

Ditto on the recent corporate tax cut—it’s too soon.  Both supply-siders and Keynesians expected a short term boost to growth, for different reasons.  Only the supply-siders predicted a longer term boost.  My own view was somewhere in between.  I expect some sort of long run supply-side boost, but much less that the Larry Kudlows of the world expect.  I see perhaps an extra 2% in RGDP growth spread out many years, with most of the boost coming soon after the tax cut.  Supply-siders see the growth rate rising to a new trend of roughly 3%/year, which seems unlikely to me.  If growth is still running at 3% in late 2019, then I clearly will have underestimated its impact.  I hope I did.

I’ve done a number of previous posts on this general topic, discussing earlier experiments such as the 2013 fiscal austerity, and the 2014 elimination of extended unemployment benefits.  Those who suggested that these would be good natural experiments often ignored the results when they didn’t go as expected.  (GDP growth accelerated in 2013, and job growth accelerated in 2014.)

Many pundits can’t handle the truth, unless it confirms their prior beliefs.