Archive for the Category Inflation


Economic indicators and the risk of “lowflation”

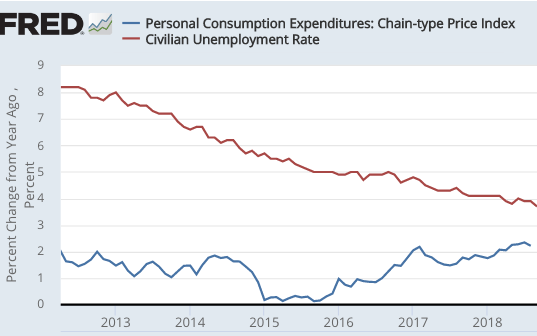
As we enter 2019, there are some economic indicators worth thinking about. Some are obvious, like the strong jobs growth (stronger than I expected.) Some are more subtle. Here are wage inflation (blue) and core PCE inflation (red):

Screen Shot 2019-01-16 at 2.28.36 PM
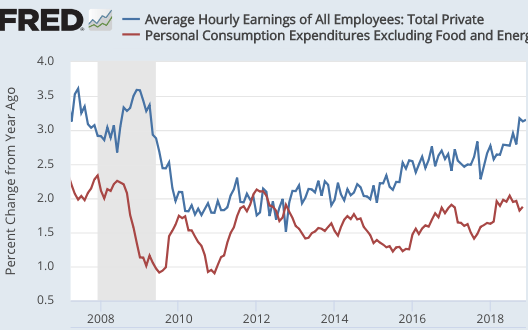
In my view, wage inflation is far more meaningful.  But PCE inflation is what the Fed is targeting, so we also need to pay attention to that variable.  I’d expect it to follow wage inflation, but the relationship is weak.

BTW, I noticed a problem with the way they calculate core inflation, at least for the CPI.  It does not include food consumed away from home.  In my view, restaurant meals are one of the most “core” of all core inflation components, or should be.  The whole point of core inflation is to include stuff closely related to wage inflation, which is very inertial.  And yet food away from home (6% of the CPI) is considered part of “food and energy”, and excluded from core.  In contrast, I’m not sure shelter should be included in core inflation, as real estate price measures are not reliable.  But this component (1/3 of the CPI) is a part of core inflation.  This link gives the weights of the CPI basket.  The CPI is just a mishmash of unrelated and hard to measure stuff.

This is one reason why I’m less concerned with “lowflation” than many other people.  Wage inflation is steadily rising, and is approaching pre-recession rates.  We seem headed in the right direction.  NGDP growth has also been strong.

Private forecasters predict roughly 2% inflation going forward, while the financial markets seem to predict less than 2%.  How much less?  That’s hard to say.

The 5-year TIPS spread is about 1.65%.  But CPI inflation has exceeded PCE inflation by 0.25% over the past decade, so in fact the true TIPS spread (for PCE) is around 1.4%, well below the Fed target.  That may be partly due to two factors.  One is the recent fall in oil prices.  For various reasons including lags in adjustment, TIPS spreads tend to follow oil prices (the graph divides oil prices by 25, to make comparisons easier to see):

Screen Shot 2019-01-16 at 1.49.32 PM
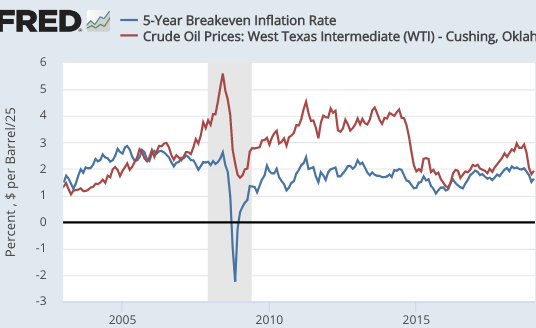
The the sharp fall in oil prices in 2015 pushed the TIPS spread down from 2% to 1.3%.  Or at least it seemed to.  I have trouble understanding how the effect could be that large.  The recent drop should not have reduced 5-year TIPS spreads more than about 0.2%.  So that leaves perhaps a 1.6% market PCE inflation forecast over 5 years—still lower than target.

Can a liquidity premium for T-bonds explain this gap (as in late 2008)?  Maybe, but I lean toward the view that the market really does forecast slightly below 2% inflation, say 1.7% or 1.8%.  This might reflect a 50% chance of continued boom and 2% inflation, and a 50% chance of recession and only 1.5% inflation, for instance.

Another variable of interest is fed funds futures.  They normally show a rising trend over time.  Right now the current fed funds rate is around 2.4%, expected to fall to 2.3% in July 2020.  So that tells me that the market expects a bit of “lowflation” in 2019, which might eventually lead to a rate cut.  But no recession.  Of course the market is presumably pricing in a certain probability of continued boom and higher rates, and a slightly higher probability of a sizable rate cut if there is lowflation and/or recession.

In my view, 2019 will tell us a great deal about whether we have moved to a higher trend rate of growth, and/or whether policy is still too tight to hit the Fed’s 2% PCE inflation target.  It’s not impossible that both might occur—sub-2% core PCE inflation and RGDP growth above the Fed’s forecast.  This would actually be good news in a way, as the “lowflation” would mean the Fed would not have to act to slow the recovery, which then might extend for many more years.  I don’t predict stocks, but the goldilocks outcome might be good for equities.

PS.  I’m reluctant to mention stocks as an forecasting tool, because they are so noisy.  They are affected by NGDP growth, but also by trade wars, foreign growth, and other factors.  The partial recovery from late last year makes a recession slightly less likely, although I never thought the risk had reached a 50% probability.  The fairly flat yield spread points to slower growth but no recession—similar to fed funds futures.

PPS.  I’m tempted to call a Chinese recession.  If I were right it would look very good, given how I pooh-poohed all the other pundits who wrongly predicted a Chinese recession in previous years.  But I won’t.  No guts, no glory.  And I have no guts.  I predict they’ll muddle through.

Beckworth interviews Ozimek

David Beckworth recently interviewed Adam Ozimek for his podcast series, and the discussion focused on monetary policy.  Ozimek pointed out that not enough attention was being paid to the lessons to be learned from the past three years of Fed policy.  The Fed began raising rates in December 2015, and even Fed officials now admit that this was too soon.  Or do they?  That’s one of the issues they discussed.

Ozimek points to interviews with some top Fed policymakers who seem to agree that the natural rate of unemployment is considerably lower than what the Fed estimated back in 2015, and also that the stance of monetary policy back then was less accommodative than the Fed had assumed.  Ozimek wants them to draw the obvious implication from that fact—that policy was too contractionary in late 2015.  There’s really no other plausible interpretation of the statements he cites, but Fed officials don’t quite seem to come out and explicitly make that admission.  This relates to my recent Mercatus policy brief, where I call on Congress to insist that the Fed periodically evaluate previous policy decisions, based on incoming data.

I also tended to view Fed policy as being slightly too expansionary contractionary during 2015-16, although mostly based on their undershooting of the 2% inflation target.  Like the Fed, I underestimated the extent of the decline in the natural rate of unemployment (Ozimek and Beckworth were ahead of me on that point.)  So what implications can we draw from this episode?

1. I believe it’s important to put this policy error in perspective.  It was a consequential error, perhaps costing hundreds of thousands of jobs for a couple of years.  That’s hardly trivial.  At the same time, the error was an order of magnitude less damaging and an order of magnitude less inexcusable that the policy errors of 2008-15.  When figuring out what went wrong with monetary policy, we need to focus almost all our attention on the mistakes of 2008-15.  That’s the elephant in the room.

2.  This episode illustrates the danger of basing Fed policy on estimates of the natural rate of unemployment (Un).  The Fed cannot accurately estimate the natural rate in real time, and hence it’s an exceedingly poor guide to policymakers.  The lesson is not “next time do a better job estimating Un”, it’s “stop trying to estimate Un, and start focusing on variables than you can measure, like NGDP.”  Under NGDP level targeting, there is no need to even measure the unemployment rate—it plays no role in monetary policymaking.

Unfortunately, the Fed is forced to rely on natural rate estimates as long as it targets inflation under a dual mandate approach, as the unemployment rate helps it to determine how much “catch-up” they need to do after a policy miss.  One of the advantages of NGDPLT is that the Fed is no longer forced to try to do the impossible—estimate Un.

They also discussed some research Ozimek did on the relationship between population growth and inflation.  I have not read the research, but if I’m not mistaken the study found a positive correlation between growth in working age population and inflation, both cross sectionally and over time.  Ozimek hypothesizes that this may relate to the impact of population growth on real estate prices.

The cross sectional correlation makes sense to me.  Cities that are growing fast tend to have higher real estate prices than cities shrinking in population, such as Detroit.  The time series correlation is less intuitive. Inflation is determined by monetary policy.  It seems unlikely that the optimal monetary policy calls for higher inflation when population growth is more rapid.  So what’s going on?  My best guess is that the correlation somehow relates to the link between population growth and interest rates, or perhaps population growth and the natural rate of unemployment:

1.  Under the gold standard, price levels were positively correlated with nominal interest rates.  That’s because higher nominal interest rates boosted the opportunity cost of holding gold, which led to less demand for gold, which is inflationary under a gold standard.  Because the expected rate of inflation is roughly zero under a gold standard, anything that boosted the real interest rate, such as faster population growth, also boosted the nominal interest rate, and hence inflation.

2.  In Japan, shocks that reduce the real interest rate seem to be deflationary, as they reduce the opportunity cost of holding yen, thus boosting the demand for yen and the value of yen.  Lower population growth might reduce the real interest rate in Japan.  Of course the BOJ should offset this, but they often do not do so.  Interestingly, they seem to have done better since 2013, enough so that the inflation rate in Japan has risen slightly, even as growth in the working age population has fallen sharply.  Over longer periods of time, however, the inflation/population growth correlation in Japan supports Ozimek’s claim.

3.  Baby boomers started entering the labor force in the late 1960s.  By itself, that’s not inflationary at all, even if it boosted real estate prices.  Recall that real estate prices are a relative price, and relative price increases are not inflationary unless they reduce aggregate supply.  But faster population growth does not reduce AS.  So what explains the Great Inflation?  One factor may have been a misinterpretation of the Phillips Curve relationship.  The faster growth in the labor force (especially among the young and women), led to a rise in the natural rate of unemployment during the 1970s.  At the time, the Fed made exactly the opposite mistake as in 2015—they underestimated Un.  This caused monetary policy to be too expansionary, in a futile attempt at holding down the unemployment rate.  Just one more reason not to use monetary policy to target unemployment.

4.  Reverse causation.  If monetary policy is procyclical then inflation will also be procyclical.  In that case, rising inflation will be associated with growing RGDP.  It will also be associated with a rising population, as the boom draws in immigrants from places like Mexico.

Note that all four of these explanations are entirely ad hoc, so I wouldn’t necessarily expect the correlation between population growth and inflation to hold in the future, at least at the national level.  Basically any correlation one finds is evidence of sub-optimal monetary policy, just as the Phillips Curve relationship is evidence of suboptimal monetary policy.

When should we start worrying about inflation?

Jan Hatzius is now forecasting that inflation will soon exceed the Fed’s 2% target for the PCE:

Goldman’s Jan Hatzius wrote Sunday that unemployment should continue to decline to 3% by early 2020, noting the labor market also has room to accommodate more wage growth. Hatzius predicted that average hourly earnings would likely grow in the 3.25% to 3.50% range over the next year.

That rapid pace of wage growth could set the Fed up for a “meaningful overshoot” of its 2% inflation target.

“If unemployment is (perhaps well) below 3.50% and inflation above 2%, we think Fed officials will need to be quite confident that growth will stay at or below trend to sound an all-clear on further rate increases, which could translate into a large easing in financial conditions and a return to growth rates well above trend,” Hatzius wrote.

Hatzius wrote that the economy needs to slow to avoid overheating, and worries that inflation could run away if the Fed does not take action. For now, Goldman has a baseline forecast of 2.3% for core PCE — which it noted as within the Fed’s comfort zone — but warned that inflation is poised to move higher on President Donald Trump’s tariffs.

The note also warned that with the labor market continuing to tighten, inflation will likely push “notably, not just slightly, higher.”

Hatzius said a slowdown could stabilize the unemployment rate, and already predicts that the economy will calm to a GDP growth rate of 2.6% in the fourth quarter. But if the slowdown is not enough, unemployment could destabilize into 2020 and inflation could run rampant.

If Hatzius is correct (and I greatly respect his judgment), then Fed policy is currently too expansionary.  The Philadelphia Fed consensus forecast is for 2.1% PCE inflation in 2019 and 2020.  (I’ll be very interested in the next forecast, which should be out soon.)  On the other hand, TIPS spreads continue to show sub-2% inflation over the next 5 years (once adjusted for the CPI bias) but they are subject to bias from a modest risk spread.

So what would tell me that we have an inflation problem?  Lots of news articles saying “It’s not that bad, because if you take out the rise in the price of X, inflation is only running at Y”.  I saw literally dozens of such articles in the 1960s and 1970s, and essentially 100% of them were incorrect.

It is true to inflation indices can be distorted by the actions of individual markets, but only if it reduces aggregate supply.  In that case, you’d see rising inflation, falling RGDP growth and modest NGDP growth.  In fact, both NGDP and RGDP growth have recently been quite strong, so don’t believe any articles about it not being so bad because it’s concentrated in health care, or education, or rents, or tariffs, or kiwi fruit prices, or some other special factor.  Special factors are not an excuse when NGDP growth is at a pace that is unsustainable if we hope to keep inflation close to 2%.

I’m not a forecaster, so I’m still pretty agnostic on this.  My baseline forecast is still for a slowdown in NGDP growth (predicted by the Hypermind market) and no recession or high inflation in the near term.  That’s good.  But I’ll be watching very closely for signs of excess.  The most likely policy mistake being made right now is too easy, not too tight.

PS.  Hypermind is currently forecasting 12-month 5.2% NGDP growth.  That represents a forecast of a slowdown to 4.2% over the next two quarters, from the 6.2% (actual) rate over the past two quarters.

Nothing like the 1960s?

Commenter Michael Sandifer left this comment:

One key difference between the current period and ’66 is that inflation is tame.

He’s referring to our relatively low inflation:

Screen Shot 2018-10-11 at 10.00.17 AMOver the previous 6 years, unemployment has fallen from 8% to 3.7%.  Inflation has mostly stayed in the 1% to 2% range, occasionally dipping below 1%, and recently rising above 2%.

In contrast, here’s the picture as of mid-1966:

Screen Shot 2018-10-11 at 10.02.27 AMIn this case, unemployment rose to a peak of 7% in 1961, then gradually trended down to 3.8% in mid-1966.  Inflation mostly stayed in the 1% to 2% range, occasionally dipping below 1%, and recently rising above 2%.

Hmmm, that sounds familiar.

I don’t expect the next 3 years to look anything like the late 1960s.  But if we are to avoid a repeat of the 1960s, it will not be because the current situation is radically different from 1966, it will be because we take steps right now to make sure than the future situation is radically different.  And that requires a dramatically less expansionary monetary policy that what the Fed adopted in 1966-69.

In the 1960s, the Fed tried to use monetary policy to drive unemployment to very low levels.  Let’s not make that mistake again.  Better to produce stable NGDP growth, and let unemployment find its own natural rate.

Teaching money/macro in 90 minutes

A few weeks ago I gave a 90-minute talk to some high school and college students in a summer internship program at UC Irvine.  Most (but not all) had taken basic intro to economics.  I need to boil everything down to 90 minutes, including money, prices, business cycles, interest rates, the Great Recession, how the Fed screwed up in 2008, and why the Fed screwed up in 2008.  Not sure if that’s possible, but here’s the outline I prepared:

1.  The value of money (15 minutes)

2.  Money and prices  (20 minutes)

3.  Money and business cycles (25 minutes)

4.  Money and interest rates (15 minutes)

5.  Q&A (15 minutes)

Intro

Inflation is currently running at about 2%.  It’s averaged 2% since 1990.  That’s not a coincidence, the Fed targets inflation at 2%.  But it’s also not normal.  Inflation was much higher in the 1980s, and still higher in the 1970s.  In the 1800s, inflation averaged zero and there were years like 1921 and 1930-32 where it was more like negative 10%!

We need to figure out how the Fed has succeeded in targeting inflation at 2%, then why this was the wrong target, and finally how this mistake (as well as a couple freshman-level errors) led to the Great Recession.

1. Value of Money  

Like any other product, the real value of money changes over time.

But . . . the nominal price of money stays constant, a dollar always costs $1

Value of money = 1/P (where P is price level (CPI, etc.))

Thus if price level doubles, value of a dollar falls in half.

Analogy:

Year      Height    Unit of measure   Real height

1980      1 yard           1.0                1 yard

2018      6 feet            1/3               2 yards

Switching from yards to feet makes the average size of things look three times larger.  This is “size inflation”.  But this boy’s measured height increased 6-fold, which means he even grew (2 times) taller in real terms.

Year      Income    Price level  Value of money   Real Income

1980     $30,000        1.0               1.0               $30,000

2018    $180,000       3.0               1/3               $60,000

The dollar lost 2/3rds of its purchasing power between 1980 and 2018, as the average thing costs three times as much.  This is “price inflation”.  But some nominal values increase by more than three times, such as this person’s income, which means the income doubled in real terms, or in purchasing power.

Punch line:  Don’t try to explain inflation by picking out items that increased in price especially fast, say rents or gas prices, rather think of inflation as a change in the value of money.  Focus on what determines the value of money . . .

2.  Money and the Price Level

. . . which, in a competitive market is supply and demand:

Screen Shot 2018-08-02 at 7.11.51 PM

Demand for Money: How much cash people prefer to hold.

Who determines how much money you carry in your wallet?  You?  Are you sure?  Is that true for everyone?

Who determines the average cash holding of everyone in the economy?  The Fed.

How can we reconcile these two perceptions?  They are both correct, in a sense.

Helicopter drop example:  Double money supply from $200 to $400/capita

==> Excess cash balances

==>attempts to get rid of cash => spending rises => AD rises => P rises

==>eventually prices double.  Back in equilibrium.

Now it takes $400 to buy what $200 used to buy.  You determine real cash holdings (the purchasing power in your wallet), while the Fed determines average nominal cash holdings (number of dollars).

Punch line:  Fed can control the price level (value of money), by controlling the money supply.

What if money demand changes?  No problem, adjust money supply to offset the change.

Fed has used this power to keep inflation close to 2% since 1991.  Before they tried, inflation was all over the map.  After they tried, they succeeded in keeping the average rate close to 2%.  That success would have been impossible if Fed did not control price level.

But, inflation targeting is not optimal:

3.  Money and business cycles

Suppose I do a study and find that on average, 40 people go to the movies when prices are $8, and 120 people attend on average when prices are $12.  Is this consistent with the laws of supply and demand?  Yes, completely consistent. But many students have trouble seeing this.

Explanation:  When the demand for movies rises, theaters respond with higher prices.  The two data points lie along a single upward-sloping supply curve.

Implication:  Never reason from a price change.  A rise in prices doesn’t tell us what’s happening in a market.  It could be more demand or less supply.  The same is true of the overall price level.  Higher inflation might indicate an overheating economy (too much AD), or a negative supply shock:

Screen Shot 2018-08-02 at 7.26.42 PM

In mid-2008, the Fed saw inflation rise sharply and worried the economy was overheating.  It was reasoning from a price change. In fact, prices rose rapidly because aggregate supply was declining.  It should have focused on total spending, aka “aggregate demand”, for evidence of overheating:

M*V = P*Y = AD = NGDP

This represents total spending on goods and services.  Unstable NGDP causes business cycles.

Example: mid-2008 to mid-2009, when NGDP fell 3%:Screen Shot 2018-08-02 at 7.43.04 PM

Here we assume that nominal GDP was $20 trillion in 2008, and then fell in 2009, causing a deep recession and high unemployment.

Musical chairs model:  NGDP is the total revenue available to businesses to pay wages and salaries.  Because wages are “sticky”, or slow to adjust, a fall in NGDP leads to fewer jobs, at least until wages can adjust.  This is a recession.

It’s like the game of musical chairs.  If you take away a couple chairs, then when the music stops several contestants will end up sitting on the floor.

The Fed needs to keep NGDP growing about 4%/year, by adjusting M to offset any changes in V (velocity of circulation).

Punch line:  Don’t focus in inflation, NGDP growth is the key to the business cycle

Why did the Fed mess up in 2008? Two episodes of reasoning from a price change:

1.  The 2008 supply shock inflation was wrongly viewed as an overheating economy.

2.  Low interest rates were wrongly viewed as easy money.

4.  Money and Interest Rates

Below is the short and long run effects of an increase in the money supply, and then a decrease in the money supply.  Notice that easy money causes rates to initially fall, then rise much higher.  Vice versa for a tight money policy.

Screen Shot 2018-08-02 at 7.26.56 PMWhen the money supply increases, rates initially decline due to the liquidity effect. The opposite occurs when the money supply is reduced.

Screen Shot 2018-08-02 at 7.43.15 PMHowever, in the long run, interest rates go the opposite way due to the income and Fisher effects:

Income effect: Expansionary monetary policy leads to higher growth in the economy, more demand for credit, and higher interest rates.

Fisher effect:  Expansionary monetary policy leads to higher inflation, which causes lenders to demand higher interest rates.

In 2008, the Fed thought lower rates represented the liquidity effect from an easy money policy.

Actually, during 2008 we were seeing the income and Fisher effects from a previous tight money policy.

Don’t assume that short run means “right now” and long run means “later”.  What’s happening right now is usually the long run effect of monetary policies adopted earlier.

Punchline:  Don’t assume low rates are easy money and vice versa.  Focus on NGDP growth to determine stance of monetary policy.  That’s what matters.

(I actually ended up covering about 90% of what I intended to cover, skipping the yardstick metaphor.)