Why do the best arguments against the RBC model involve exchange rates?
The “real business cycle” model has led some conservatives to claim that monetary stimulus will merely lead to more inflation, not more real economic growth. They don’t believe that nominal shocks have real effects.
The two most famous arguments against the RBC model both involve exchange rates. One argument was discussed in a recent post by Paul Krugman. He presented a graph showing that real exchange rates became vastly more volatile after the Bretton Woods exchange rate regime was abandoned around 1971. You might ask: So what? Is it any surprise that exchange rates became more volatile after the world abandoned fixed exchange rates? It’s not surprising that nominal rates got more volatile, but real rate volatility is a bit more of a surprise. Recall that the RBC model predicts that nominal shocks won’t have real effects. (Indeed even some non-RBC types like Milton Friedman didn’t expect such dramatic volatility.)
A second example was recently discussed by Ryan Avent; the famous study (by Barry Eichengreen) that showed countries tended to begin recovering from the Great Depression precisely when they left the gold standard. Again, if nominal shocks don’t have real effects (as some RBC proponents claim), then this pattern is hard to explain.
I don’t recall anyone explaining why economists use foreign exchange data to refute the extreme RBC view that nominal shocks don’t matter. After all, nominal shocks are also supposed to have real effects in closed economies. Why not use a more conventional indicator of monetary stimulus, such as the money supply, or interest rates, or the inflation rate? One answer is that it’s very hard to identify monetary shocks using those indicators. Low rates may reflect easy money, or they may reflect a weak economy expected as a result of tight money. A big increase in the money supply might reflect easy money, or might be the Fed accommodating more demand for base money in response to past deflationary policies. The rate of inflation might rise due to supply shocks, or due to demand shocks.
In the interwar period there was a pretty good correlation between money, prices, and output, as there were big monetary shocks that led to procyclical movements in the price level. That looks good for conventional demand-side models. But postwar data is less clear. Now the monetary authority tries to offset changes in velocity, so money and prices are much less clearly correlated with output.
Exchange rates are almost ideal in two respects. Unlike interest rates and the money supply, a rising value of the dollar is a relatively unambiguous indicator of tighter money, and vice versa. And unlike changes in inflation, it’s pretty easy to separate out changes in exchange rates that reflect exogenous policy decisions, and those that reflect other factors. For instance, both the abandonment of the gold standard, and the abandonment of Bretton Woods were pretty clearly exogenous policy decisions. Indeed they were “monetary policy” broadly defined to include “changes in the international value of one’s money.”
I prefer NGDP, but many of my critics say that indicator assumes away the question. How do we know central banks can influence NGDP? I think that’s wrong, especially if you use expectations, but nevertheless exchange rates are clearly something that governments can control.
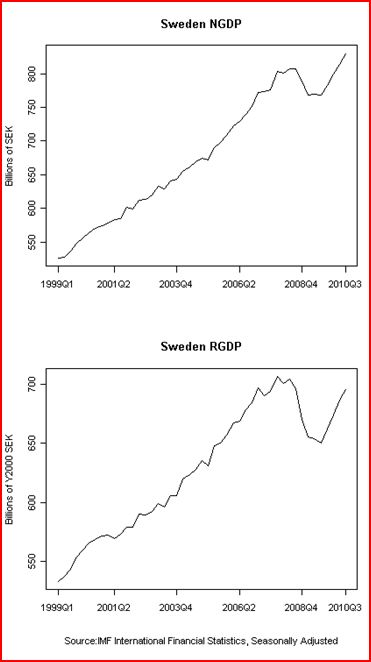
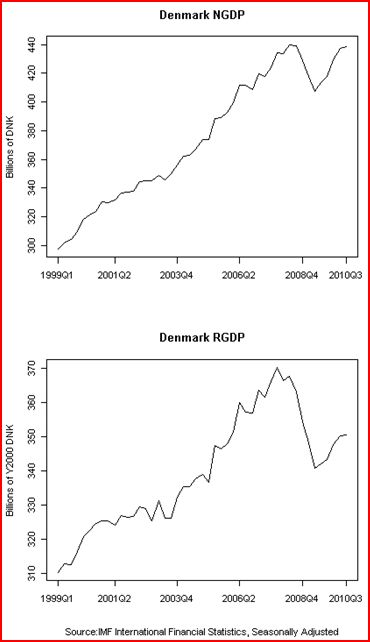
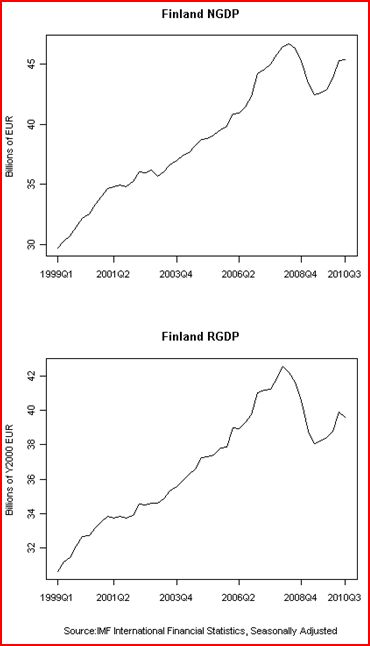
I recently mentioned some very suggestive data for Sweden and Denmark, and a commenter named Justin Irving (a student at Uppsala University) sent me data which repeats the two famous experiments that I cited above, albeit in a slightly less impressive way (only three observations.) He sent me graphs showing NGDP and RGDP for three major Nordic countries. (Norway was not included, presumably because its vast oil wealth would make it an unrepresentative country.)
.
.
.
.
.
.
.
.
.
.
.
.
.
.
.
.
.
.
.
.
.
.
.
.
.
.
.
.
.
.
.
.
.
.
.
.
.
.
.
.
.
.
.
.
.
.
.
.
.
.
.
.
.
.
.
.
.
.
.
.
.
.
In 2008 both Denmark and Finland were either in the euro, or fixed to the euro. Sweden was floating, and as soon as the recession hit it allowed the krona to depreciate sharply. As you can see from the graphs above, Sweden’s NGDP grew significantly faster than the other two. This is no surprise; both RBC and conventional macro models would predict this result. But now look at RGDP growth. The RBC model suggests that devaluing a currency will simply result in higher inflation, not faster RGDP growth. Yet it’s clear that Sweden did much better than Denmark and Finland in terms of RGDP. Why is that? I believe the faster NGDP growth caused the faster RGDP growth. A real business cycle proponent would presumably say it was just coincidence, just as it was coincidence that America started recovering in 1933 and France began recovering in 1936, etc. Lots of interesting coincidences.
All these natural tests of the RBC model lead me to wonder what we can infer from the fact that economists use exchange rates, not conventional monetary indicators, when attempting to refute the RBC. What does that tell us about contemporary monetary economics? Here are some answers:
1. Postwar conventional macro models that identify monetary shocks on the basis of interest rates or money supply changes are not reliable. Instead when researchers want convincing evidence they reach back to the definition of monetary policy provided by that “monetary crank” of the 1930s, George Warren. Warren proposed that monetary shocks were changes in the price of gold.
2. We need a variable that gives a clear and unambiguous indication of changes in the stance of monetary policy (like exchange rates), and which also can be measured in real time, (like exchange rates.)
3. The best way to get that variable would be for the Fed to create and subsidize a NGDP (and RGDP) futures market.
No longer would we have to wait for serendipitous experiments like the staggered ending of the gold standard, or the end of Bretton Woods. We’d have a perfect real time indicator of monetary shocks. We could observe how Fed actions (and policy speeches) impacted NGDP futures prices. We could observe how changes in NGDP futures impacted various real variables. The actual parameters of all sorts of macro models would lay naked and exposed, like the skeleton of a dead animal lying in the midday Libyan sun. Want to know the slope of the SRAS? Is Plosser right or is Krugman right? Just compare the reaction of RGDP and NGDP futures to a sudden Fed announcement that under the pressure of regional Fed presidents, QE2 was being ended prematurely. Something tells me that Plosser would not be happy with the answer that the markets would give him.
The experiments discussed by Krugman and Avent tell us something important (and unpleasant) about modern RBC models.
The fact that those experiments had to rely on exchange rate shocks tells us something important (and unpleasant) about modern conventional macro.


