Archive for the Category Exchange Rates


A note on the Japanese yen

My recent post on the yen triggered a number of interesting comments.  For instance, Miguel Sanchez responded to my claim:

“For those who don’t follow the yen closely, 77 is an insanely high level.”

with the following reply:

Aptly worded, though probably not in the way you intended. For those who do follow the yen closely, the real effective exchange rate is historically quite low, though it’s been off its all-time lows since the financial crisis.

I know there’s a huge and ongoing debate about how to gauge ‘fair’ value, but I would’ve thought the very basic test of whether a currency is overvalued is whether the country is running a trade deficit. Japan has and continues to run a massive trade surplus.

This is a widespread view, but it contains two misconceptions.  First, there is an implicit assumption that trade accounts should balance.  In fact, countries with good demographics (like Australia) would be expected to run current account deficits, and countries with bad demographics (like Japan and Germany) would be expected to run a surplus.  And that’s exactly what happened.  Indeed with optimal fiscal policy Japan’s surplus might well be much larger.

The second mistake is to assume that the real exchange rate is the correct variable for my analysis.  Monetary policy affects nominal exchange rates, and has no long run effect on real exchange rates. The way to tell if a currency is under or over-valued is not to look at trade balances, but rather NGDP.  By that measure monetary policy in Japan is too tight and the yen is too strong in nominal terms.

Miguel didn’t say this, but some proponents of “fairly valued” exchange rates claim that a weak yen actually hurts the rest of the world, by stealing jobs from others.  But as we saw today, the rest of the world actually gains from a weaker yen, at least when a strong yen is severely hurting the Japanese economy.

BANGKOK (AP) — Asian markets posted gains and European shares were headed higher Friday as the yen retreated from historic highs after the world’s seven leading industrial nations pledged to rein in the currency to help earthquake-stricken Japan.

This market response supports my “monetary view” of the overvalued yen, and goes against the “trade surplus view,” which implies the yen was undervalued even before the recent steps taken to depreciate it further.  As with China’s policy of fixing the yuan in late 2008 and 2009, an expansionary monetary policy during a worldwide recession helps all countries.  Macro is not a zero sum game.

“Wow. That’s all I have to say, just wow.”

Maybe someone can help me understand the following:

“Speculators are becoming increasingly confident about pushing the [dollar/yen] currency pair around,” said Michael Woolfolk, senior currency strategist in New York at Bank of New York Mellon Corp., the world’s largest custodial bank, with more than $20 trillion in assets under administration. “Everyone is curious to find out why they chose not to defend the 80 level. Wow. That’s all I have to say, just wow.”

The yen gained to 77.48 per dollar at 5:42 p.m. in New York after passing its post-World War II high of 79.75 reached in April 1995, from 80.72 yesterday.

“We’ve breached 79.75 and there was enormous support there initially and that’s given way with stop losses on a New York close in extremely thin conditions with absolutely no signs of the Bank of Japan and the selling has just snow-balled,” said Kurt Magnus, executive director of currency sales at Nomura Holdings Inc. in Sydney.

For those who don’t follow the yen closely, 77 is an insanely high level.  Japan’s currency is showing amazing strength, and the BOJ is nowhere to be seen.  Tight money in an economy that shows no signs of overheating—unless you count nuclear power plants.    I don’t get it, but then I’ve never understood anything the BOJ did or did not do.

It pains me to write this post, as I am a big fan of Japanese culture.  Although I have never been there, I love the country.  But the truth is that Japan is not particularly good at handling disasters (as we found out after Kobe), and of course has a very spotty record on nuclear safety.  On the other hand there may be a tendency for people to get overly emotional about nuclear issues, so I really don’t know whether markets are over- or under-reacting.  (Yes, I’m a typical two-handed economist.  Pay no attention to my forecasts.)

I almost threw a shoe at the TV when I heard a newsman say the nuclear power plants were built to withstand earthquakes, but that “no one could have predicted anything this severe.”  Really?  I think Chileans, Russians, Indonesians and Alaskans would have had no trouble predicting 9.0 or higher earthquakes–which are not particularly rare, at least not for a power plant built to last for many decades and located in one of the hottest parts of the “ring of fire.”  These “black swans” (which might as well be named the official bird of the 21st century) are coming more and more frequently.  The reaction of authorities makes me more likely to believe those people who warn about the possible effect of solar flares knocking out our electrical grid, or genetically-engineered flu viruses causing pandemics.

[BTW, I think my post “Stuff Happens” holds up pretty well.]

In some ways recent events remind me of the Great Depression:

1.  The central banks didn’t provide enough stimulus.  Some actions were taken, but they would only be effective if things went smoothly–no bumps in the road to recovery.

2.  There were lots of bumps.  More importantly, there were lots of shocks that wouldn’t have caused much of a problem had we not been in a depression.  Smoot-Hawley.  The November 1930 bank run. Credit Anstalt.  France delaying Hoover’s attempt to rescue Germany.  Britain leaving gold.  The election of 1932.  War scares in the late 1930s.  Often these shocks had effects that seemed quite different from what one might expect, for instance Smoot-Hawley was very deflationary in May/June 1930, despite the fact that economic theory says tariffs are inflationary.  (And remember how the Libyan uprising seemed to reduce nominal interest rates?)

I’ve indicated many times that adverse supply shocks can reduce NGDP, if they become entangled with monetary policy.  And that’s especially likely to happen in a depression, when traditional monetary tools are ineffective.  Of course just as with fiscal stimulus, the Fed can neutralize the effect on NGDP.  So why doesn’t that appear to be happening?  Partly it’s because the Fed is targeting inflation, not NGDP.  Fiscal austerity reduces inflation, something the Fed might well offset.  An adverse oil shock (or disruption of the production chain in Asia?) raises prices, and hence is less likely to be offset with monetary stimulus.  We saw the Fed fail to react to a drop in AD during late 2008, partly due to an unhealthy focus on headline inflation (which had soared with oil prices.)  Could the same thing be happening again?

I suppose some people will roll their eyes and say “Sumner thinks even nuclear meltdowns can be fixed with monetary stimulus.”  Actually, I don’t think we should react to nuclear meltdowns or any other situation by changing our monetary policy target.  I favor stable NGDP growth.  The problem isn’t that money is not becoming more expansionary, the problem is that monetary policy (in the US and Japan) is becoming more contractionary.  I’d be happy if they simply stayed put.

The article quoted above did find a few countries that still “do monetary policy”  Countries that actually have targets, that aren’t passive in the face of shocks:

The Australian dollar fell to as low as 97.35 U.S. cents, the least since Dec. 2, before trading at 97.89 cents as of 8:32 a.m. in Sydney. The kiwi dollar slid to 71.30 U.S. cents, the lowest since Sept. 2.

The Aussie tumbled 3.5 percent to 75.56 yen, while the New Zealand currency dropped 4.5 percent to 55.39 yen.

Krona Drop

Sweden’s krona dropped against most major currencies, falling 1.3 percent to 6.4826 per dollar and 2.7 percent to 12.28 yen.

Rather than say Sweden and Australia’s currencies are falling, it might be more accurate to say the yen and the dollar are rising.

Some people have argued that this event might actually help the Japanese economy.  I doubt it.  Of course there’s the broken windows fallacy, but the more sophisticated arguments are that Japan will react with major fiscal stimulus, and that this will somehow force Japan out of its liquidity trap.  I find that implausible, and I’m pretty sure that Japanese stock investors agree with me.  Still, it is certainly possible, especially given the size of Japan’s national debt.  I hope I’m wrong.

PS.  Will Wilkinson has a good post on the economic effects of disasters.  But keep in mind my cautionary note on the Great Depression.  The effect of shocks is very much context-specific.

PPS.  I know that the 77 level was something of a blip–the real question is why the yen isn’t going much lower.

NBER study finds zero fiscal multiplier . . .

. . .  in countries with flexible exchange rates (i.e. autonomous monetary authorities.)

In How Big (Small?) Are Fiscal Multipliers? (NBER Working Paper No. 16479), co-authors Ethan Ilzetzki, Enrique Mendoza, and Carlos Vegh show that the impact of government fiscal stimulus depends on key country characteristics, including the level of development, the exchange rate regime, openness to trade, and public indebtedness. . . .

Exchange rate flexibility is critical: economies operating under predetermined exchange rate regimes have long-run multipliers greater than one in some specifications, while economies with flexible exchange rate regimes have multipliers that are essentially zero. The differences in the responses to increases in government consumption in countries with fixed and flexible exchange rate regimes are largely attributable to differences in the degree of monetary accommodation to fiscal shocks in these nations. The results imply that the central banks’ response to fiscal shocks is crucial in assessing the size of fiscal multipliers.   (Italics added.)

I wonder how many multiplier studies modelled the central banks’ response in their estimates of the size of “the” multiplier.

PS.  I haven’t had time to do any blogging, and am somewhat overwhelmed with work.  If you email me don’t expect an immediate response.  I’ll try to do something on the current world situation when I have time.  This post is just a stop-gap to show I am still around.

Why do the best arguments against the RBC model involve exchange rates?

The “real business cycle” model has led some conservatives to claim that monetary stimulus will merely lead to more inflation, not more real economic growth.  They don’t believe that nominal shocks have real effects.

The two most famous arguments against the RBC model both involve exchange rates.  One argument was discussed in a recent post by Paul Krugman.  He presented a graph showing that real exchange rates became vastly more volatile after the Bretton Woods exchange rate regime was abandoned around 1971.  You might ask: So what?  Is it any surprise that exchange rates became more volatile after the world abandoned fixed exchange rates?  It’s not surprising that nominal rates got more volatile, but real rate volatility is a bit more of a surprise.  Recall that the RBC model predicts that nominal shocks won’t have real effects.  (Indeed even some non-RBC types like Milton Friedman didn’t expect such dramatic volatility.)

A second example was recently discussed by Ryan Avent; the famous study (by Barry Eichengreen) that showed countries tended to begin recovering from the Great Depression precisely when they left the gold standard.  Again, if nominal shocks don’t have real effects (as some RBC proponents claim), then this pattern is hard to explain.

I don’t recall anyone explaining why economists use foreign exchange data to refute the extreme RBC view that nominal shocks don’t matter.  After all, nominal shocks are also supposed to have real effects in closed economies.  Why not use a more conventional indicator of monetary stimulus, such as the money supply, or interest rates, or the inflation rate?  One answer is that it’s very hard to identify monetary shocks using those indicators.  Low rates may reflect easy money, or they may reflect a weak economy expected as a result of tight money.  A big increase in the money supply might reflect easy money, or might be the Fed accommodating more demand for base money in response to past deflationary policies.  The rate of inflation might rise due to supply shocks, or due to demand shocks.

In the interwar period there was a pretty good correlation between money, prices, and output, as there were big monetary shocks that led to procyclical movements in the price level.  That looks good for conventional demand-side models.  But postwar data is less clear.  Now the monetary authority tries to offset changes in velocity, so money and prices are much less clearly correlated with output.

Exchange rates are almost ideal in two respects.  Unlike interest rates and the money supply, a rising value of the dollar is a relatively unambiguous indicator of tighter money, and vice versa.  And unlike changes in inflation, it’s pretty easy to separate out changes in exchange rates that reflect exogenous policy decisions, and those that reflect other factors.  For instance, both the abandonment of the gold standard, and the abandonment of Bretton Woods were pretty clearly exogenous policy decisions.  Indeed they were “monetary policy” broadly defined to include “changes in the international value of one’s money.”

I prefer NGDP, but many of my critics say that indicator assumes away the question.  How do we know central banks can influence NGDP? I think that’s wrong, especially if you use expectations, but nevertheless exchange rates are clearly something that governments can control.

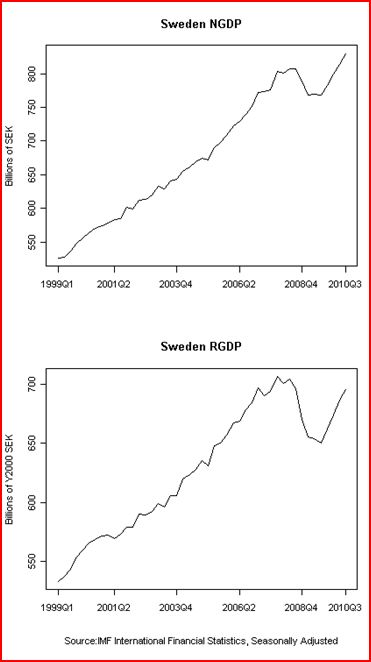
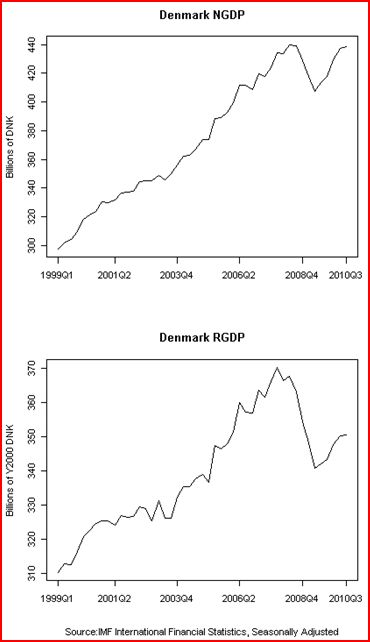
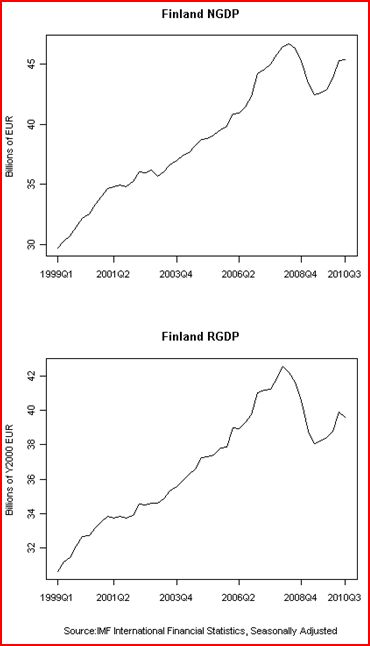
I recently mentioned some very suggestive data for Sweden and Denmark, and a commenter named Justin Irving (a student at Uppsala University) sent me data which repeats the two famous experiments that I cited above, albeit in a slightly less impressive way (only three observations.)  He sent me graphs showing NGDP and RGDP for three major Nordic countries.  (Norway was not included, presumably because its vast oil wealth would make it an unrepresentative country.)

.

.

.

.

.

.

.

.

.

.

.

.

.

.

.

.

.

.

.

.

.

.

.

.

.

.

.

.

.

.

.

.

.

.

.

.

.

.

.

.

.

.

.

.

.

.

.

.

.

.

.

.

.

.

.

.

.

.

.

.

.

.

In 2008 both Denmark and Finland were either in the euro, or fixed to the euro.  Sweden was floating, and as soon as the recession hit it allowed the krona to depreciate sharply.  As you can see from the graphs above, Sweden’s NGDP grew significantly faster than the other two.  This is no surprise; both RBC and conventional macro models would predict this result.  But now look at RGDP growth.  The RBC model suggests that devaluing a currency will simply result in higher inflation, not faster RGDP growth.  Yet it’s clear that Sweden did much better than Denmark and Finland in terms of RGDP.  Why is that?  I believe the faster NGDP growth caused the faster RGDP growth.  A real business cycle proponent would presumably say it was just coincidence, just as it was coincidence that America started recovering in 1933 and France began recovering in 1936, etc.  Lots of interesting coincidences.

All these natural tests of the RBC model lead me to wonder what we can infer from the fact that economists use exchange rates, not conventional monetary indicators, when attempting to refute the RBC.  What does that tell us about contemporary monetary economics?  Here are some answers:

1.  Postwar conventional macro models that identify monetary shocks on the basis of interest rates or money supply changes are not reliable.  Instead when researchers want convincing evidence they reach back to the definition of monetary policy provided by that “monetary crank” of the 1930s, George Warren.  Warren proposed that monetary shocks were changes in the price of gold.

2.  We need a variable that gives a clear and unambiguous indication of changes in the stance of monetary policy (like exchange rates), and which also can be measured in real time, (like exchange rates.)

3.  The best way to get that variable would be for the Fed to create and subsidize a NGDP (and RGDP) futures market.

No longer would we have to wait for serendipitous experiments like the staggered ending of the gold standard, or the end of Bretton Woods.  We’d have a perfect real time indicator of monetary shocks.  We could observe how Fed actions (and policy speeches) impacted NGDP futures prices.  We could observe how changes in NGDP futures impacted various real variables.  The actual parameters of all sorts of macro models would lay naked and exposed, like the skeleton of a dead animal lying in the midday Libyan sun.  Want to know the slope of the SRAS?  Is Plosser right or is Krugman right?  Just compare the reaction of RGDP and NGDP futures to a sudden Fed announcement that under the pressure of regional Fed presidents, QE2 was being ended prematurely.  Something tells me that Plosser would not be happy with the answer that the markets would give him.

The experiments discussed by Krugman and Avent tell us something important (and unpleasant) about modern RBC models.

The fact that those experiments had to rely on exchange rate shocks tells us something important (and unpleasant) about modern conventional macro.

What successful monetary policy looks like

A couple items yesterday got me thinking again about Swedish monetary policy.  Here’s a comment Michael Bordo made at The Economist’s “By Invitation”:

If the central bank is successful in maintaining a stable and credible nominal anchor then real macro stability should obtain. But in the face of real shocks central banks also need to follow short-run stabilisation policies consistent with long-run price stability. The flexible inflation-targeting approach followed by the Riksbank and the Norges Bank seems to be a good model that other central banks like the Federal Reserve, should follow.

I strongly agree, but nevertheless was a bit surprised to see Michael Bordo make this argument.  I recall that he had been somewhat more skeptical about QE2 than I was, and I pegged him as being a bit more conservative, or hawkish on inflation.  In previous posts I argued that the Riksbank engineered a more rapid reconomic recovery precisely because they were more stimulative than the Fed, ECB, and BOJ.  So why do we both agree on Sweden?

I think it was Tolstoy who once said:

Successful central banks are are all alike, every unsuccessful central bank is unsuccessful in its own way.

Or maybe it was Dostoevsky.

At any rate, in previous posts I’ve argued that unsuccessful policy makes the stance of monetary policy very difficult to read.  If you are successful in stabilizing inflation expectations, then interest rates might be able to provide a reasonably reliable indicator of the stance of monetary policy.  The same is true of the monetary base.  On the other hand if you run a highly deflationary monetary policy then interest rates may fall to very low levels.  Tight money might look “easy.”  Deflation can also cause the real (and nominal) monetary base to rise sharply, as people and banks hoard base money.   Thus a deflationary monetary policy might look excessively expansive to some, and excessively contractionary to others.  The policy instruments that economists rely on become much less informative under extreme conditions.

Stefan Elfwing recently sent me the newest monetary policy report from the Riksbank.  Here (p. 30) they contrast recent trends in Swedish and US monetary policy:

In December and January, the Riksbank’s final extraordinary loans to the banks (which totalled SEK 5.5 billion) matured. This meant that all of the extraordinary measures implemented by the Riksbank during the crisis have now been completely wound up. As a result of this, the Riksbank’s balance sheet total has come close to the level prevailing before the crisis in 2008. The remaining difference in the balance sheet total is due to the strengthening of the foreign currency reserve carried out by the Riksbank in 2010.

In conjunction with its monetary policy meeting in November, the Federal Reserve announced that it would start to buy government bonds in an amount of up to USD 600 billion until the end of the second quarter of 2011. These purchases are proceeding as planned and are contributing to the continued increase of the Federal Reserve’s balance sheet total.

In addition, the Riksbank has actually been raising interest rates in recent months, and just announced an intention to accelerate the pace of rate hikes.  So how can I argue that the Riksbank has pursued a more stimulative monetary policy than the Fed?  After all, the Fed is continuing its zero rate policy, and just recently announced another $600 billion in QE, to add onto the roughly trillion dollars of assets purchased in 2008-09.

In my view the more rapid return to normalcy in Sweden reflects the success of Riksbank policy during 2008-09.  But how do we measure the policy stance of the Riksbank, if both interest rates and the monetary base are partly endogenous?  I favor NGDP expectations, but I’m obviously in the minority.  Fortunately there are two other widely accepted indicators that also point to the expansive nature of Riksbank policy.

When the world crisis became severe in late 2008, the Riksbank allowed the krona to depreciate sharply against the euro:
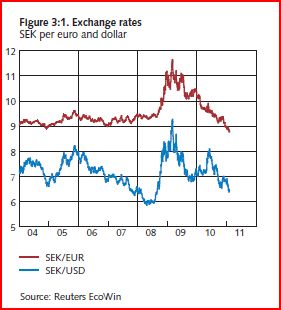
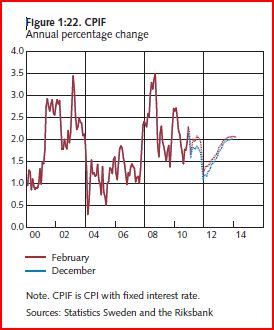
This cushioned the blow from sharply declining world demand for Swedish exports, and helped keep Swedish inflation close to the Riksbank’s 2% target during 2009-10.
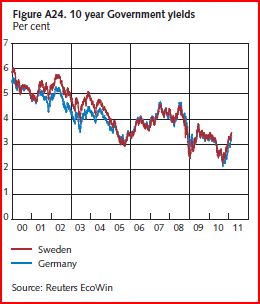
And all this was done without any loss in credibility of the Riksbanks’ 2% inflation target, as evidenced by the fact that yields on 10 year Swedish government bonds continue to closely track German yields.
One argument against my hypothesis is that Sweden did suffer a severe recession in 2009, with real GDP falling slightly faster than the eurozone.  However it is important to keep in mind that just as an individual worker or firm cannot shield itself from unemployment via complete wage and price flexibility, the same argument applies to small open economies that are exposed to a severe worldwide demand shock.  Sweden’s goods exports are close to half of GDP, if one counts goods and services they are well over 50% of GDP.  Swedish goods exports plunged more than 15% in late 2008 and early 2009.  There is simply no way Sweden could avoid a severe recession under those world economic conditions, regardless of whether they did NGDP targeting or not.

You might ask why the big depreciation of the krona didn’t prop up Swedish exports.  It may have to some extent, but consider the following example. Say a casino project  to create one of the best casino sites in Vegas orders a central air conditioning unit from Sweden. However online casinos are transforming rapidly, and a reliable site similar to casinoslotsforum.com aims to keep the readers up to date with all the latest trends and bonus promotions online! Now, assume that the construction project gets canceled because of economic problems in the US.  How much would Sweden have to cut the price on the AC unit to prevent the sale from being canceled?  Would any price cut be enough?  Sticky wages and prices in the aggregate turn nominal shocks into real recessions.  But unfortunately once that happens, price and wage flexibility at the micro level can only do so much.

Here’s some evidence from the Swedish report that supports the preceding hypothetical:

During the crisis, exports of investment and input goods in particular fell dramatically. These sectors are now primarily responsible for the strong increase in Swedish exports. The [recent] development of exports is connected with the increase of investments we now see in large parts of the world.

The depreciation of the krona might have bought Volvo, Saab and Electrolux a few more sales of cars and vacuums, as those prices fell relative to their German competitors.  But modern sophisticated economies like Sweden and Germany tend to focus on complex capital goods and inputs, which depend less on price than on demand conditions in their export markets.

If Sweden suffered a sharp fall in GDP during 2009 (slightly faster than the eurozone), what evidence do I have that monetary stimulus was successful?  I don’t have any conclusive evidence, but the report does indicate that Swedish GDP is expected to rise 5.5% in 2010 and 4.4% in 2011.  Even Germany, often regarded as the most successful of the eurozone economies, is only expected to grow 3.5% and 2.6%, that’s almost 4% less over two years.  Another interesting comparison is Denmark, which like Sweden suffered a sharp fall in GDP in 2009, and yet has a much slower recovery (2.0% GDP growth in both 2010 and 2011.)

Why did the krona rebound in 2010?  There could be a number of reasons, including sound public finances.  But one additional factor may have been the strong economic recovery in Sweden.  Recall that in late 2008 real interest rates soared in the US, but then plunged in 2009.  The original increase was partly due to tight money, and the later decrease may have reflected the weak economy in 2009.  It wouldn’t surprise me if a similar short- and long run dynamic occurred with the Swedish krona.

The Swedish report is a model of elegance, logic, and transparency.  I couldn’t help wondering why our Fed could not produce similar reports.  They clearly lay out their policy goals (2% inflation and output stability), their expectations for the economy, and the expected path of their policy instrument.  When members dissent, the reasons are clearly laid out and explained (as in the abbreviated report):

Forecasts for inflation in Sweden, GDP and the repo rate

Annual percentage change, annual average

2009 2010 2011 2012 2013
CPI -0.3 1.3 (1.3) 2.5 (2.2) 2.1 (2.0) 2.6 (2.6)
CPIF 1.9 2.1 (2.1) 1.9 (1.7) 1.5 (1.4) 2.0 (1.9)
GDP -5.3 5.5 (5.5) 4.4 (4.4) 2.4 (2.3) 2.5 (2.4)
Repo rate, per cent 0.7 0.5 (0.5) 1.8 (1.7) 2.8 (2.6) 3.4 (3.3)

Note. The assessment in the December 2010 Monetary Policy Update is shown in brackets.
Sources: Statistics Sweden and the Riksbank

Forecast for the repo rate.  Per cent, quarterly averages

Q4 2010 Q1 2011 Q2 2011 Q1 2012 Q1 2013 Q1 2014 
Repo rate 1.0 1.4 (1.4) 1.7 (1.6) 2.5 (2.2) 3.2 (3.1) 3.6

Note. The assessment in the December 2010 Monetary Policy Update is shown in brackets.
Source: The Riksbank

Deputy Governor Karolina Ekholm and Deputy Governor Lars E.O. Svensson entered a reservation against the decision to raise the repo rate by 0.25 percentage points to 1.5 per cent and against the repo rate path of the main scenario in the Monetary Policy Report.They preferred a repo rate equal to 1.25 per cent and a repo rate path that then gradually rises to 3.25 per cent by the end of the forecast period. Such a repo rate path implies a CPIF inflation closer to 2 per cent and a faster reduction of unemployment towards a longer-run sustainable rate.

Sweden shows the importance of focusing on your policy goals, and doing what is necessary to achieve those goals.  Michael Bordo had some very good observations in his aforementioned essay:

BASED on the history of central banking which is a story of learning how to provide a credible nominal anchor and to act as a lender of last resort, my recommendation is to stick to the tried and true””to provide a credible nominal anchor to the monetary system by following rules for price stability. Also central banks should stay independent of the fiscal authorities.  .  .  .

The historical examples of the Wall Street crash of 1929 and the bursting of the Japanese bubble in 1990 suggests that the tools of monetary policy should not be used to head off asset-price booms. Following stable monetary policy should avoid creating bubbles. In the event of a bubble however, whose bursting would greatly impact the real economy, non-monetary tools should be used to deflate it. Using the tools of monetary policy to achieve financial stability (other than lender-of-last-resort actions) weakens the effectiveness of monetary policy for its primary role to maintain price stability.

Thus a strong case can be made for separating monetary policy from financial stability policy. The two should be separate authorities which communicate closely with each other. However if the institutional structure does not allow this separation and requires the FSA to be housed inside the central bank then it should use tools other than the tools of monetary policy to deal with financial stability concerns. The experience of countries like Canada, Australia and New Zealand which largely avoided the recent crisis, shows that some countries got the mix between monetary and financial policy right.

Even if Mike Bordo and I don’t see exactly eye to eye on what went wrong in America, we both recognize successful monetary policy when we see it.  Set a nominal target, and do what is necessary to hit the target.  Let others worry about the financial industry.

PS. As in the UK, interest rate changes distort the CPI in Sweden.  Thus the CPIF is the better indicator, as it removes the effects of interest rates on mortgage costs.