Archive for February 2019


Just do it.

There are a wide variety of ways of thinking about monetary policy. In this post I’ll use some graphs to illustrate various policy options, with the goal of shedding light on some of the major debates of the past decade.

Let’s start with a shift from a zero percent target path for inflation to a 2% path. Let’s also assume that the Quantity Theory (QT) holds in the long run, in the sense that prices move in proportion to changes in the money supply, other things equal. But in the short run, money demand is negatively correlated with nominal interest rates. (Don’t worry if you don’t like the QT, this example will have anti-QT implications.)

Let’s assume that it is Japan that switches from a zero percent inflation path to a 2% inflation path. Also assume that the new path pushes nominal interest rates up from 0% to 2%. (I.e. assume a zero real rate of interest, for simplicity.) And finally, let’s assume that that demand for base money in Japan is 100% of GDP at zero interest rates and 10% of GDP at 2% nominal interest rates. (Not implausible assumptions, BTW.)

In the following graph, path A shows the path of the money supply that would push inflation from 0% to 2%, without any discontinuous change in the price level at the point where the policy change occurs.

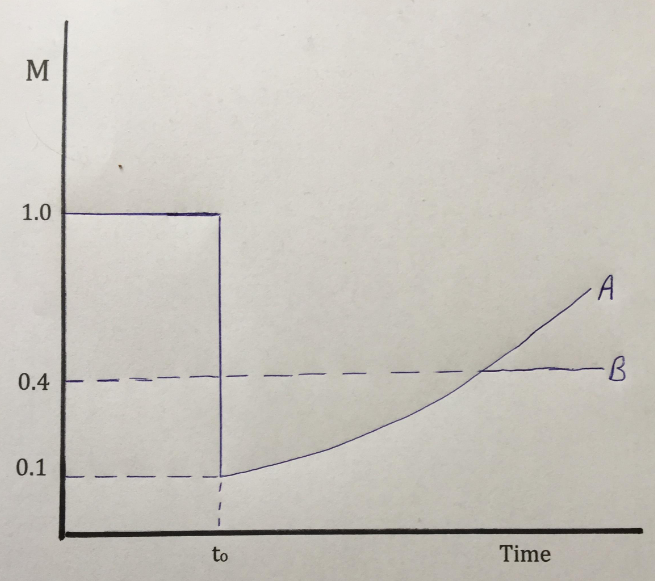
Even though the money supply plunges by 90% at time=0, the price level does not show any immediate change. The Japanese suddenly prefer to hold much smaller cash balances, because the opportunity cost of holding base money has risen from zero to 2%/year.

Once money demand has fallen by 90%, it levels off. From that point forward, the BOJ must raise the money supply at 2%/year in order to generate 2% annual inflation. It takes 72 years for the price level to quadruple, but even then the money supply remains 60% below the level just before the change in policy.

So far I’m assuming that everything works smoothly. The policy change is credible, and is expected to persist forever. The Japanese attitude toward money changes immediately, to become more like the Australian attitude. Japanese salarymen suddenly start refusing overtime, and instead go home and put on shorts, throw a few shrimp on the backyard barbie, and make rude jokes about Sheilas.

That’s already a pretty heavy lift, but it gets much worse. Let’s suppose that the money supply follows path A for 72 years, and then is expected to level off (as in path B). What then?

In that case, everything changes even today, at time=0. The hypothesis that the BOJ could reduce the money supply by 90% and at the same time start on a path of 2% inflation is entirely dependent on the public believing that this new policy will last forever. If it lasts for “only” 72 years, the effect will be radically different.

Under path A, the price level is four times higher after 72 years. Under path B it is 60% lower than at time=0. That’s because path B leads to zero money growth and zero inflation in the long run. That means that 72 years from today, real money demand will be just as high as before the t=0 policy shift, and since the money supply is assumed to be 60% lower, the price level will also be 60% lower. The path of prices over that 72 year period will also be vastly different, but I’m not smart enough to show exactly how different.

The bottom line is that it’s dangerous to engage in money supply targeting. The path for the money supply that might achieve success with 100% credibility, could lead to total failure if it’s 100% credible for only 72 years, but not thereafter. (I believe Nick Rowe made this point earlier.)

Last year, the yen briefly appreciated on news that Prime Minister Abe might have to leave office due to a corruption scandal, and the next PM was not expected to push as hard for monetary stimulus. Now imagine a scenario where even committing to 72 years of monetary expansion is not enough!

Fortunately, Lars Svensson came up with a “foolproof” escape from a liquidity trap, which does not require any unreasonable credibility assumptions:

Why would this work? The argument proceeds in several steps, to be explained in detail below: (i) It is technically feasible for the central bank to devalue the currency and peg the exchange rate at a level corresponding to an initial real depreciation of the domestic currency relative to the steady state. (ii) If the central bank demonstrates that it both can and wants to hold the peg, the peg will be credible. That is, the private sector will expect the peg to hold in the future. (iii) When the peg is credible, the central bank has to raise the short nominal interest rate above the zero bound to a level corresponding to uncovered interest rate parity. Thus, the economy is formally out of the liquidity trap. In spite of the rise of the nominal interest rate, the long real rate falls, as we shall see. (iv) Since the initial real exchange rate corresponds to a real depreciation of the domestic currency relative to the steady state, the private sector must expect a real appreciation eventually. (v) Expected real appreciation of the currency implies, by real interest parity (2.15) and (2.16), that the long real interest rate is lower. (vi) Furthermore, given the particular crawling peg (3.4), a real appreciation of the domestic currency will arise only if domestic inflation exceeds the inflation target. Therefore, the private sector must expect inflation to eventually rise and even exceed the inflation target.

Let’s illustrate his intuition with a time series graph, showing the foreign exchange value of the Japanese yen (priced in US pennies):

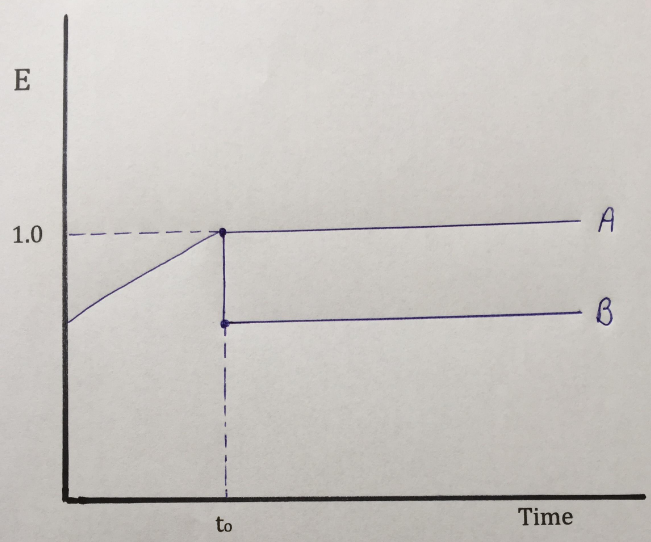
Let’s assume the yen had been gradually appreciating before time=0, and then the yen were suddenly pegged to the dollar. During the period of yen appreciation, the Japanese inflation rate would be lower than in the US, on average. If the BOJ pegged the yen to the dollar, then the long run trend rate of inflation in Japan would be similar to the rate in the US. This is illustrated by path A.

Of course PPP does not always hold perfectly, and perhaps Japan needs a bit of “catch-up inflation.” After all, the Japanese economy was somewhat depressed after years of deflation at the time Svensson first developed his proposal in 2000. To make the policy even more “foolproof” you can do a one-time depreciation of the yen, and then peg the exchange rate to the dollar. That gives you a bit more inflation, and insures against a real depreciation in the yen exchange rate from exogenous factors.

It’s actually very likely that under this policy the money supply in Japan would look much like what I showed in the first graph above. But you can’t make the opposite argument. There is no reason to assume that adopting the money supply path shown in the first graph would lead to an exchange rate graph that looks even remotely like what we see in the second graph.

This is why QE by itself is a rather clumsy instrument. What a central bank actually needs to do is commit to do enough QE to hit some sort of price target (such as exchange rates or NGDP futures prices), and if they do so they might not have to do any QE at all (as in the first graph, where they actually reduce the money supply).

Exchange rate targeting has one important advantage over money supply targeting; the money supply is automatically adjusted to reflect the degree to which the public finds the policy target to be credible. If it’s not credible, you inject much more money than if it is credible. You inject enough money to keep exchange rates stable and on target, which is also enough money to accommodate the demand for money under the new policy regime.

Svensson’s proposal is an example of a NeoFisherian monetary policy, a more expansionary monetary policy that is associated with a rise in nominal interest rates, even in the very short run. Therefore it may be useful to use this graphical approach to compare the New Keynesian and NeoFisherian policy options.

The next graph shows two possible paths for the exchange rate, two very different monetary policies. (Think of a country like Singapore, that uses the exchange rate as its monetary policy instrument.) And yet, as we will see, the change in nominal interest rates may well be identical in the two cases, even though one policy is highly expansionary while the other is highly contractionary.

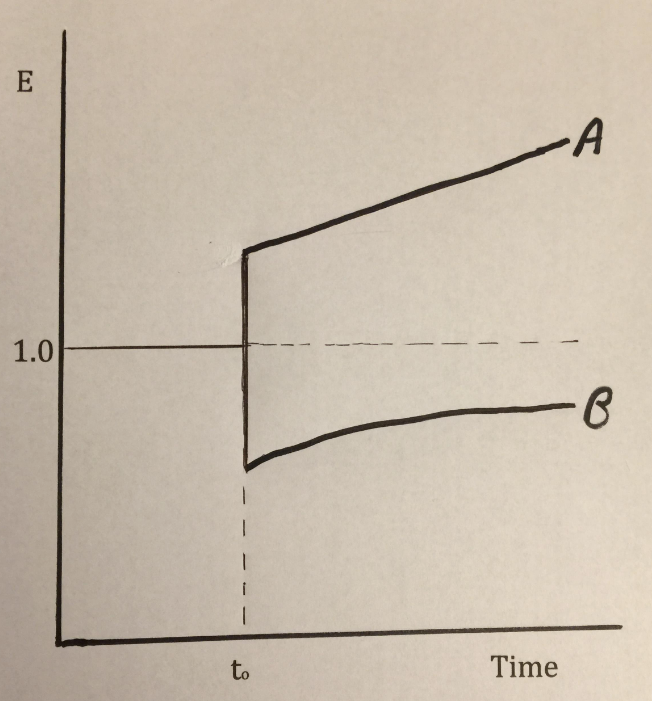
Path A is a contractionary NeoFisherian monetary policy, sudden currency appreciation with a commitment for even more appreciation in the future. This is effectively what the Swiss National Bank did in January 2015. The franc appreciated and Swiss interest rates fell due to the Fisher effect. (Or the interest parity condition, if you prefer.)

Path B is an expansionary New Keynesian policy, currency depreciation with a commitment to gradually appreciate the currency only part way back to the original level. This is “Dornbusch overshooting”, and is effectively what the US did when it announced QE1 in March 2009. The dollar fell 6 cents against the euro on the day of the announcement.

Importantly, both monetary policies are “low interest rate policies”, even as one is highly expansionary and one is highly contractionary. That’s because both feature expected currency appreciation after the initial shock, and interest parity implies that this depresses domestic interest rates.

Some people are tempted to argue that the direct effect of low rates is always expansionary; while in the NeoFisherian case this effect is offset by currency appreciation. But that’s wrong, there is no direct effect of interest rates. Changes in market interest rates are always the effect of some more fundamental monetary operation, such as open market sales, discount loans, IOR, reserve requirements, forward guidance, etc. It’s hard, but you have to stop thinking about changing market interest rates as a policy, and instead think about market interest rates as the effect of various policies.

I hope these exercises are of more than academic interest. In my view, they help us to better understand that the sort of monetary regimes that are effective have several things in common:

First, they target a price, such as the price of gold, the price of foreign exchange, the price of CPI futures, the price of NGDP futures or some sort of complex mixture of asset prices that are believed to reflect NGDP expectations. (Hopefully not the stock market, which seems to be the current obsession of the Fed.)

Second, the policy does “whatever it takes” to hit the price target. This means that the market determines the needed level of concrete steps, which will depend on the policy’s credibility.

Third, less credible policies will require more concrete steps, and hence more controversial monetary policy actions. Ironically, a clear and strong “whatever it takes” approach will boost policy credibility, and therefore require less aggressive concrete steps than a more timid approach.

Lars Svensson understood these principles back in 2000. Here are the three steps in his foolproof policy (from the 2003 version of the model):

(1) Announce an upward-sloping price-level target path . . . for the domestic price level . . .

(2a) Announce that the currency will be devalued and that the exchange rate will be pegged to a crawling exchange-rate target . . . That is, the central bank makes a commitment to buy and sell unlimited amounts of foreign currency at the [targeted] exchange rate . . .

(3) Then, just do it.

Svensson seems to be a Nike shoe fan, while I prefer Yoda’s version:

Do. Or do not. There is no try.

Tax luxury, not wealth or income

I favor very high marginal tax rates on the super rich, say 70% to 80%. But I am also opposed to all income taxes and all wealth taxes. Why?

Let’s start with the conservative argument that taxes on the super rich will deter work, saving, and investment, by reducing the incentive to build more wealth. Is it true? The answer will depend on the type of tax.

If you look at the behavior of superrich people like Bill Gates and Warren Buffett, they tend to spend only a few extra pennies on consumption, for each extra dollar they earn. Thus it does not seem like extra consumption is an important motivation for the superrich, beyond a certain point. So perhaps high taxes are not a disincentive.

Warren’s (relatively) modest house

Ah, but you might argue that they have other motivations. They like to be big time philanthropists, or they like to build their business empire up to greater and greater heights. That’s their real motivation, and a punitive tax rate would therefore discourage them from putting in the extra effort that we want to get from talented people. I agree.

But that proves my point! You don’t want a punitive tax on income or wealth; you want a punitive tax on very high consumption—say beyond $50,000,000/year. Gates and Buffett would still be able to use their income for charity and investment purposes, with no almost deterrent effect from high taxes. They’d only be punished for an excessively lavish lifestyle.

Now admittedly there might be a few billionaires that would be deterred by a high consumption tax, say Larry Ellison. But even there, the deterrent effect would be less than you might think. That’s because a lot of the high-end consumption is positional goods.

Let’s suppose that currently the biggest yacht is a 400-foot monster, and Larry Ellison wants a 500-foot one—to impress his friends. Also suppose that a steep consumption tax prevents Larry from getting this mega-yacht. You might argue that this reduces his utility, and would discourage his effort to make Oracle the best company it can be.

Ellison purchased this 453-foot yacht (then sold it to David Geffen)

But here’s what you are missing. The high tax rates would not just apply to Larry Ellison, but to all the superrich. Thus if Larry had to scale back from a 500-foot yacht to a 400-footer, his closest rival would scale back from a 400-footer to a 320-footer. The relative ranking of consumption would be roughly unchanged. Ditto for real estate, where the exact same people would still live on the ocean in Malibu, but the price of land would fall to reflect the lower consumption of the superrich. Ditto for fine art.

Larry Ellison can enjoy parties on a 400-foot yacht surrounded by young Ukrainian beauties just as much as he can enjoy parties on a 500-foot yacht, as long as his closest rivals only have 320-foot yachts. That’s how human brains work, and that’s why even a 70% or 80% tax on consumption doesn’t really deter work effort from the superrich, or at least not as much as conservatives fear.

I’m not sure the best way to implement a progressive consumption tax. One could imagine two systems, one for employees of companies and one for the self-employed. Company employees would simply pay a progressive payroll (FICA) type tax. Very simple—no forms to fill out, even for LeBron James. A wage tax is identical to a consumption tax, in the long run.

The self-employed would pay an income tax with unlimited 401k privileges (which is effectively a consumption tax). So they’d only be taxed when they consumed their income. Income from any shares you own in your own company would be viewed the same as income earned by the self-employed—i.e. “wage income”.

The heirs of the rich would receive their inheritance in 401k-type accounts, and they’d pay taxes as they pulled the money out of those accounts to consume it.

There’s a difficult issue in determining how to tax existing stocks of wealth, at the point the new system goes into place. Perhaps a compromise where existing stocks of wealth above a certain threshold are put into a 401k-type structure, but taxed at a lower rate—in recognition of the fact that a part of the wealth has already been taxed.

If your country needs to raise large sums of money (and it shouldn’t–see Singapore), you need multiple tax systems; otherwise there will be too much evasion. These might include VATs, property taxes and carbon taxes. The property tax is a sort of tax on housing consumption, to make up for the fact that VATs don’t include housing. Currently, the superrich in places like New York pay a far lower rate of property tax than average homeowners, whereas they should pay a far higher rate. The fact that even liberal cities like New York are this regressive is an indication of the confused nature of our debate over taxes. Commenter “dtoh” has proposed a VAT where the poor are rebated what a poverty line person would spend on consumption, so that the tax is not regressive.

Read the debate in the blogosphere and you’ll see that people are horribly confused by taxes; they aren’t even debating the right issues. They talk piously about the need to tax capital income, which is the worst possible way to think about taxes. Meanwhile Larry Ellison will continue to enjoy his 500-foot yacht, with the extra 100 feet made of steel and employing labor that could have been used to provide dozens of cars for average people.

Sad!

PS. Some people like the following analogy. On Christmas Eve, people bring presents and put them under the tree. The next morning, people show up and grab presents from under the tree. Should we tax those who put them under the tree, or those who take them away the next morning? Based on how much you produce or how much you consume?

PPS. This post is on the superrich. I’m not sure how to handle the far more numerous ordinary rich–perhaps a 50% MTR on consumption. That sounds bad, but don’t forget the unlimited 401k privileges for the rich self-employed. That sort of tax would actually be less than 50% of one’s income. If they are rich wage earners, you can view the system as unlimited Roth IRA privileges.

PPPS. This post was a bit unfair to Larry Ellison, as he sold his 453-foot yacht to David Geffen and bought a smaller one, which could access more ports. And he has far more sophisticated taste than Trump. But I still maintain that high-end consumption is largely about positional goods.

Right bias steering and right side deviations

If tight money is defined as below target NGDP, in what sense can below target NGDP be said to be “caused” by tight money? I’ll use an analogy to answer this question.

Imagine a ship crossing the ocean. The goal is to cross in a straight line, but the captain makes occasional mistakes and these result in a wavy path across the sea. Deviations from the straight line are called “right side deviations” and “left side deviations”. They are costly, resulting in excess fuel usage.

Steering mistakes that result in right side deviations are called “right bias steering”, and vice versa. Is there any other way to usefully define steering bias, other than by the evidence of path deviation? You can’t simply look at the steering wheel setting, because it may be turning right or left to offset wind and waves. This may not reflect steering errors.  In most cases, you can only spot biased steering by the results.

However, one can imagine a scenario where the force of waves is so powerful that even turning the steering wheel to the limit is not enough to stay on the desired path. The ship might be “trapped” away from the path by the enormous force of liquid waves pushing against it. Let’s call that situation a . . . oh I don’t know . . . how about a “liquidity trap”.

Now we have two possible causes of right path deviation. There might be right bias steering, and there might be a liquidity trap.

Now assume there are two schools of thought when it comes to steering ships. The pessimists worry that the force of waves may occasionally be so strong that the steering mechanism is unable to maintain the desired path. The pessimists argue that path deviations are caused by multiple forces, and that right side path deviations are especially likely to result from liquidity traps, because the strongest storms tend to push ships to the right.

The optimists believe that ships always have enough engine power for the captain to maintain a straight course if he does his job properly, setting the wheel at a position expected to keep the ship on the desired path. They believe that drunken captains occasionally use the “liquidity trap” theory as an excuse for incompetent steering. They scoff that the only liquidity problem is the liquid contained in the captain’s whiskey bottle.

The optimists believe that 100% of path deviations are caused by biased steering. Because there is no way to identify biased steering other than by observing path deviations, the optimists have become famous for equating biased steering with path deviations. Right side deviations aren’t just caused by right bias steering; they are effectively identical to right bias steering. Not because they are identical in a deep philosophical sense (one is a wheel setting and the other is a path), rather because as a practical matter one always implies the other.

This wasn’t true in the “Golden Age” of sailing, but it is today, especially given the widespread use of powerful modern ship engines built by the Italian firm Fiat, which are more that strong enough to offset any wind and waves.  Indeed some optimists seem to reject the laws of physics, claiming that Fiat engines have virtually infinite power, able to reach hyper-speeds.

The analogies could of course be taken much further.  Right bias steering tends to push a ship into dangerous waters, where liquidity traps are more likely.  This explains why the more competent captains are skeptical that liquidity traps even exist; they almost never see them.  Indeed one famous Australian captain never saw one during his entire 100-year career.

Here’s another analogy.  Pessimists tend to define steering bias in terms of whether the wheel is turned to the left or the right, not in terms of the setting of the wheel relative to what’s needed to keep the ship on course.

Here’s another.  Pessimists occasionally call for tug boats to nudge the ship back on course.  Optimists claim that tugboats are useless, as any competent captain will already be steering the ship back on course, and thus will “offset” the force of the tugboat.

PS.  I don’t know if this post was helpful.  For those who didn’t follow, the straight path across the water is stable NGDP growth, and right side deviation is falling NGDP.  (Left side is excessive NGDP.) Right bias steering is tight money (often associated with the political right), while left bias steering is easy money.

Optimists (i.e. market monetarists) define tight money as falling NGDP, and they also believe that falling NGDP is caused by tight money.  However, they understand that this definition only makes sense if monetary policy has infinite power to influence nominal aggregates.  And that’s only true with Fiat . . . I mean fiat money.

PPS. I suppose “port” and “starboard” deviations would be better, but I don’t want to confuse landlubbers like me.

Then and now

In 1969:

Leftists: Free speech on campus!

Conservatives: Ban speakers with communist sympathies.

In 2019:

Conservatives: Free speech on campus!

Leftists: Ban speakers with non-PC views.

(OK, I’m cheating a bit—conservatives don’t like anti-Israeli speech.)

In 1969:

Conservatives: Cut your hair and conform to society’s norms.

Leftists: I’ll wear my hair any way I choose.

In 2019:

Leftists: Stop braiding your hair and conform to your ethnic group’s norms.

Conservatives: I’ll wear my hair any way I choose.

It seems like leftists and conservatives are constantly disagreeing and constantly changing their views. Not so, they agree with each other and never change their views. Both conservatives and leftists agree that those with the most power should tell the rest of us how to live. The only thing that changes is the balance of power.

Central bankers and the Great White Whale

Here’s the Financial Times:

Global economy: Why central bankers blinked

It’s been 18 years since I read Moby Dick, but I vaguely recall that Captain Ahab made the mistake of anthropomorphizing the white whale.  Ahab had a sort of steely-eyed gaze—and didn’t blink when seeking revenge.

Central bankers need to work hard to avoid anthropomorphizing the market.  Better to view market forecasts as a sort of natural force, like wind and waves.  If market forecasts change (as they did late last year), then by all means “blink”.  

It’s nothing personal.