Archive for March 2014


5048.62: All judgments are provisional

It’s the 14th anniversary of the dotcom bubble peak.  Here are some closing prices of NASDAQ, the tech-oriented stock index:

March 10, 2000:  5048.62

October 9, 2002:  1114.11

Last Friday:  4336.22

I recall the general view in October 2002 was that the 5048 closing in March 2000 was utterly insane, an overvaluation of historic proportions.  In contrast, the closing value of 1114 was seen as; “Ah, that’s more like it.  I always knew the dotcoms were a bubble.”

I don’t wish to argue in favor of the 2000 market peak, it still looks absurdly high to me.  Rather I’d like to suggest that all such judgments are provisional.  If investors in 2000 had known what we know now (current NASDAQ level), the peak would have probably been closer to 3000.  If investors in 2002 had known what we know now, the low point would have been slightly higher than in 2000, say around 3200.

(These are ballpark guesstimates based on the notion that in equilibrium stock indices might be expected to rise at faster than the rate of inflation, but slower than NGDP growth.  The latter point is due to the fact that stock indices do not account for new firms being created, and the total value of all stocks should rise at about the rate of NGDP, in the long run.  This may be wrong, but I don’t think anything in my post hinges on these guesstimates being exactly right.  Also, I realize that if investors knew then what we know today stocks would have been risk free assets over the next 14 years.  Please ignore that fact and assume a normal return for an asset with that level of risk.)

As of today, it looks to me like investors were somewhat more insane in October 2002 than March 2000.  In absolute terms they might have been roughly equally wrong.  The values of 3000 and 3200 are roughly half way between the 2000 highs and 2002 lows.  But it’s percentage differences that matter in investment.  If you can’t see that, consider this example.  You are looking out the window at a new Mercedes parked at the curb.  You comment that the car probably cost $80,000 new, and your friend says he’d estimate it was about $1000 new.  If the actual value was $40,000, who would have made the more reasonable guess?  And yet who was closer in absolute terms?

I believe humans tend to notice absurdly over-priced assets more readily than absurdly underpriced assets.  People are more likely to talk about the fools who bought stocks when the NASDAQ was 5000, than those who foolishly sold when it was 1100 a few years later.  Or the fools that bought Vegas property in 2006, not those who sold London property in 1994.  Or those who bought Bitcoins at $1000, not those who sold Bitcoins when they were $5.  You might say that sometimes people might have to sell, but they never have to buy a particular asset.  That’s true.  But even people who sell and then reinvest in something else seem to get a pass.  It’s the buyers who pay too much who are mocked.

Of course all the judgments in this post are provisional.  If NASDAQ goes to 8000 in the next few years I’ll no longer view March 2000 prices as crazy.  And yes, 4336 may not be the “correct value” today, but it’s the best estimate that we have.  If Richard Rorty had been a finance professor he would have said the true value of a stock is that value which investors regard as true.  And he would have also said that if we later find out that that value “was not actually the true value,” all that would mean is that later on people regarded a different value as “true.”   All truth statements are provisional, (excluding the optimality of NGDPLT.)

PS.  I don’t ever recall Robert Shiller saying stocks were underpriced and that people should buy, but I recall him calling stocks overpriced on numerous occasions.  Can someone confirm this impression?  If true, why doesn’t he recommend that people buy stocks during periods like March 2009, when the S&P 500 was at 670, barely a third of its current value?

PPS.  Off topic, but I highly recommend this post by Evan Soltas.  His posts (and those of Yichuan Wang) are amazing thoughtful for such young bloggers.  Indeed for bloggers of any age.  I doubt I could have made as persuasive an argument for NGDP targeting as Evan just did.

No Texas oil multiplier (dedicated to Adam Gurri and Noah Smith)

Tyler Cowen recently directed me to a post by Phillip Longman in the Washington Monthly, which attempts to debunk the “Texas miracle.”  His main argument is that the boom in Texas is a product of the recent oil boom, not good economic policies.  Even that is questionable, as lots of other places have large amounts of oil and gas but simply choose not to frack (Europe, New York, California, Mexico, etc.)  But let’s accept the “Texas is lucky” argument for the moment; do the facts support this multiplier claim?

Unless you’ve been to Texas lately, you might have missed just how gigantic its latest oil and gas boom has become. Thanks to fracking and other new drilling techniques, plus historically high world oil prices, Texas oil production increased by 126 percent just between 2010 and 2013.  .  .  .

To be sure, only about 8 percent of the new jobs in Texas are directly involved in oil and gas extraction, but the multiplier effects of the energy boom create a compounding supply of jobs for accountants, lawyers, doctors, home builders, gardeners, nannies, you name it. Saying that Texas doesn’t depend very much on oil and gas just because most Texans are not formally employed in drilling wells is like saying that the New York area doesn’t depend very much on Wall Street because only a handful of New Yorkers work on the floor of the stock exchange.

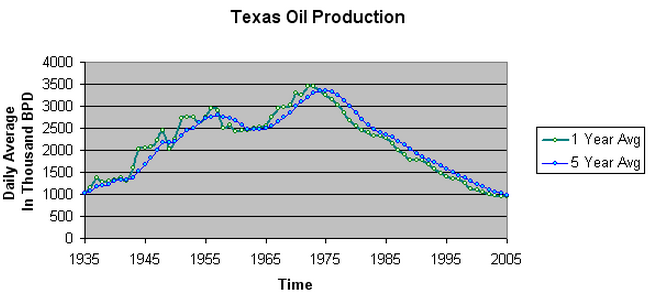
You’d think the editors of Washington Monthly would have at least checked the data, to see if his multiplier claim was accurate.  It only takes 5 minutes.  And as we’ll, see the data decisively rejects this argument.  But first a bit of history about Texas oil production.  Notice how it plunged in the decades after 1975:

Screen Shot 2014-03-09 at 11.54.03 AM

Now look at the population growth by decade:

1970-80:  27.05%

1980-90:  19.89%

1990-2000:  22.74%

2000-10:  20.63%

Texas’s population grew at roughly twice the national rate for decade after decade, even as oil output was declining sharply.  Now look at the recent trends in oil output:

Screen Shot 2014-03-09 at 11.55.09 AM

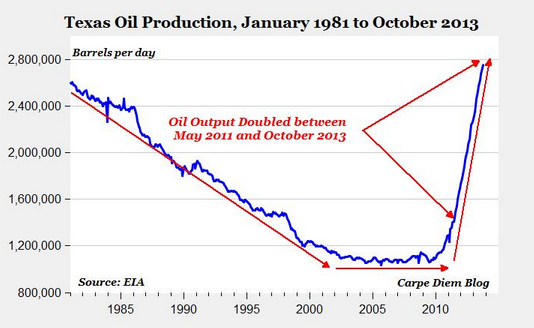
So the Texas oil boom was quite recent, beginning about 2010.  Now let’s look at the population growth figures before and after the recent boom:

2005-06:  2.55%

2006-07:  2.01%

2007-08:  2.02%

2008-09:  2.02%

2009-10:  1.85%

2010-11:  1.62%

2011-12:  1.52%

2012-13:  1.50%

Where is all the population growth from fracking?  Where is the multiplier, the spinoff jobs for other sectors? I suppose you could argue that while Texas hasn’t seen any more population growth, the unemployment rate has fallen more sharply than in other states.  After all, only 6% of the Texas workforce is unemployed, as compared to 6.7% for the country as a whole.  The problem here is that unemployment in Texas peaked at 8.3% in February 2010, versus a peak of 10% for the US.  So the fall in the unemployment rate in Texas has actually been smaller than for the country as a whole (even slightly smaller in percentage terms).  The fracking boom has not had a noticeable effect on either population growth or unemployment.

Sometimes I think that Keynesians are so convinced that there is a “multiplier effect” that they don’t even both to check the data.  At least Paul Krugman has the good sense to make the argument in terms of GDP, not population:

But I wanted to follow up on one particular point: the role of oil and gas in recent years. Longman concedes that these industries directly account for a fairly small share of the economy even in Texas, but argues that their rapid growth, combined with multiplier effects, makes them a much bigger story when it comes to Texas growth. Indeed. Let me put some numbers to this, using the BEA data on real GDP by state.

What you learn from these data right away is that Texas is indeed king of the extractive expansion. Nationwide, mining output, measured in 2005 dollars, expanded $29 billion between 2007 and 2012; Texas accounted for $22.7 billion of that expansion. Nationally, the expansion of mining was 0.2 percent of 2007 GDP; in Texas, it was 10 times that, 2 percent.

Oil extraction is very capital intensive, so I don’t doubt the Texas GDP numbers would look better than their population or unemployment numbers.  But that’s not the big story, and even Krugman admits that there’s much more to the Texas growth story than oil.  The big story is that people have been moving to Texas in large numbers for many decades, even decades when oil production was falling fast.

Sorry liberals, but there really is a Texas miracle, and it has nothing to do with “multipliers.”  It is explained by the fact that working class people like to move to states with low living costs (due to flexible zoning), and businesses and high skilled professionals like to move to states with low income taxes.  The working class cares more about the low living costs than the fact that Texas offers less expensive welfare programs than California.  They come to Texas to work, not to collect welfare.  The businesses bring them the capital they need to be productive workers.

My only quibble with Krugman’s post is that he leaves out the lack of a state income tax, which helps explain why Texas grows far faster than other south central states with hot weather and cheap houses.  The big story is that people have been moving to Texas in large numbers for many decades, even decades when oil production was falling fast.

PS. I was going to take Sunday off, but was inspired to write this post by Saturoswho is of course right about the decline in quality of my writing.  That’s what happens to grouchy old reactionaries.  But when Keynesians keep throwing softballs over the center of the plate, it’s hard to step away.  I know Adam Gurri doesn’t read my blog, but perhaps someone can tell him that Knausgaard has inspired me to adopt a maximilist approach.

Update:  Some commenters suggested that the Texas miracle is due to cheap real estate.  This post demolishes that argument.

Thomas Raffinot on the eurozone disaster

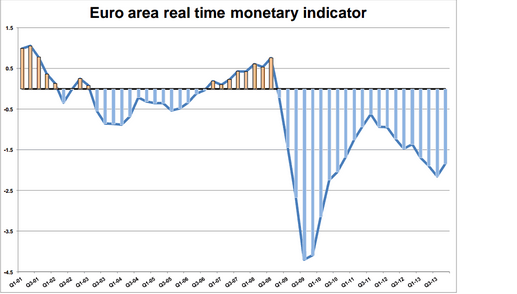
Thomas Raffinot sent me an interesting report on the eurozone.  I had trouble copying from the pdf file, but you can read the full report here.  This graph shows his estimate of how far ECB policy has diverged from the optimal policy, given the ECB’s mandate:

Screen Shot 2014-03-06 at 10.01.47 PMFree Exchange has a new post that has me a bit perplexed. Indeed there is a non-zero probability that I’m about to make a complete fool of myself.  The post explains in detail why ECB policy is far too tight, using either the unemployment or the inflation metric, and then seems to end by endorsing what it calls the ECB’s “masterly inactivity.”

Moreover, inflation appears to have stabilised for the time being though at a pretty low rate given the ECB’s target of just below 2%. The headline rate has now stayed at 0.8% since December while the core rate (excluding volatile elements like food and energy) picked up to 1% in February, having fallen to a record low of 0.7% in December. Unemployment remains high, at 12% of the workforce in January, but it has also stabilised, having remained at this level since October.

.   .   .

The crucial element in the new forecasts is what they show for the longer-term inflation outlook. The December projections had shown inflation falling from 1.4% in 2013 to 1.1% this year and then edging up to 1.3% in 2015. The new forecasts show it a little lower this year, at 1.0%, picking up to 1.3% in 2015 and reaching 1.5% in 2016. In his opening statement to today’s press conference Mr Draghi drew attention to the fact that inflation would be rising by 1.7% in the year to the final quarter of 2016, in other words more or less at the ECB’s target rate.

.  .  .

In its new capacity as single supervisor (a job it takes over formally in November) it is pulling out all the stops to diagnose the health of euro-zone banks and to ensure that the necessary treatment is administered. But in the more familiar realm of monetary policy, the ECB is pursuing a strategy of masterly inactivity.

Now perhaps this is just sarcasm.  Those who read my comment section will occasionally see me strongly objecting to comments that were intended as sarcasm, and indeed came from commenters who agree with me.  I’m a bit slow.

If it was signed “R.A.” I would immediately know that the “masterly inactivity” comment was meant derisively.  But I’m not familiar with “P.W.”

In any case, ECB policy is just completely dysfunctional.  There is a case to be made for current Fed, BOJ or BoE policy, but there is no case to be made for ECB policy. It’s completely inexcusable under any reasonable interpretation of the ECB’s mandate, even the “German” interpretation.

Meanwhile here’s what’s happening in a country that until recently was mocked by American and European economists:

Kazufumi Yamamoto is having such a hard time finding waiters and sushi chefs to fill jobs at Ganko Food Service Co. that he’s going to boost wages for the first time in more than a decade.

“Positions remain open for several months, leaving some restaurants heavily understaffed,” said Yamamoto, personnel head at the sushi-chain operator in Osaka. “The labor shortage has worsened to the point we have no choice but to increase pay.”

The troubles facing Yamamoto, 43, reflect the pressures of a labor force that’s shrinking, with just nine high school graduates on the hunt for a private-sector job now for every 10 just five years ago. Smaller companies reliant on part-time workers are bearing the brunt, pressuring them into wage gains that have yet to be reflected in the broader job market.

While nationwide pay fell in the year through January, and will probably rise less than 1 percent this year, according to economists surveyed by Bloomberg News, smaller and mid-sized employers such as hand-cleaner maker Saraya Co. are considering salary gains of 2 percent or more. The nation is within a few years of an overheated job market that makes inflation, not deflation, Japan’s challenge, economist Masaaki Kanno says.

Watch what they predict, not what they say

Lots of commenters make a big deal about the fact that some Fed officials, and Ben Bernanke in particular, often make statements implying that they don’t engage in monetary offset.  One response is that they also make statements implying that they do engage in monetary offset.  Talk is cheap, and there’s no doubt the Fed would prefer that Congress do more of the heavy lifting, so they could do less (and hence be less controversial.)

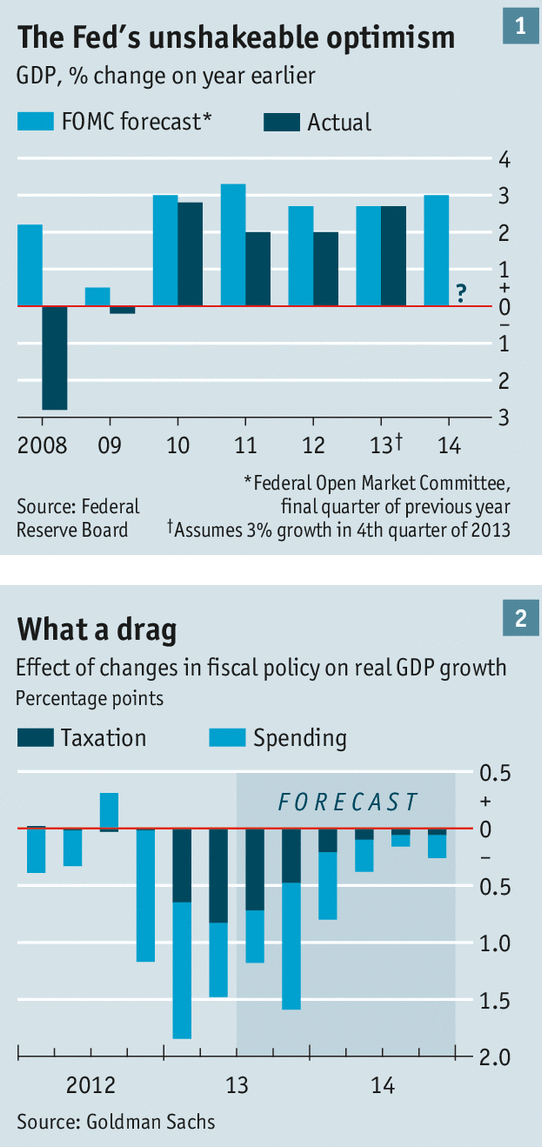
But actions speak louder than words.  How does the Fed change its forecast of RGDP growth in 2013, as a result of the big tax increases plus sequester?  Take a look at the following, from The Economist:

Screen Shot 2014-03-06 at 9.32.43 AM

Lots of people have noticed that actual GDP growth accelerated in 2013, as compared to 2012, despite all the austerity we were warned about.  But of course lots of unexpected things can happen over a 12 month period.  I find it much more interesting to look at the expected effect of austerity. Notice that expected 2013 growth is identical to expected 2012 growth.

Now some will argue that that’s only because other things were changing to offset the effect of austerity.  For instance, the Fed did QE3 and forward guidance in late 2012.

Which is exactly the point.

PS.  In fairness, I’m not sure how fully they understood the extent of fiscal austerity in their December 2012 forecast.  They did cite looming fiscal austerity when justifying their monetary stimulus of late 2012, so it was clearly understood that austerity would occur.  But in March they lowered their RGDP growth forecast from 2.65% to 2.55%, perhaps because of more information about the severity of the austerity.

The Fed lowered its GDP forecast slightly downward in the March FOMC meeting

The Fed is forecasting from 2.3% to 2.8% in GDP growth for 2013, taking down the top end of the range from 2.3% to 3.0%. The Committee noted that the private economy was growing a little faster than anticipated, and that would nearly offset the fiscal drag imposed by the Jan 1st tax hikes and the sequester. They did adjust their 2014 and 2015 forecasts lower as well, although not dramatically.

On the other hand Q1 growth was very weak, so it seems equally likely that that triggered the downgrade in forecasts, not the sequester.  Fiscal austerity might or might not have lowered the Fed’s growth forecast by 10 basis points.  That’s far from the apocalyptic forecasts of the Keynesians. 

When the storm is long past, the 5 year—5 year forward TIPS spreads will show 2% inflation

Keynes once said:

Economists set themselves too easy, too useless a task if in tempestuous seasons they can only tell us that when the storm is long past the ocean is flat again.

Vaidas Urba sent me some interesting quotations.  First Ben Bernanke at the September 16, 2008 Fed meeting, which I propose we call the “Noah’s flood meeting,” after Hawtrey’s famous remark. Here’s Bernanke:

But it was noted that the five-by-five TIPS breakeven remains above a level consistent with long-term price stability.

Vaidas also sent me the following from the ECB:

The long-term forward inflation swap rate remained broadly stable over the period under review, standing at around 2.2% on 5 February. Overall, giving due consideration to both the inflation risk premium and the liquidity premium, market-based indicators suggest that inflation expectations remain fully consistent with price stability.

I also found this from the same ECB report:

At the same time, underlying price pressures in the euro area remain weak and monetary and credit dynamics are subdued. Inflation expectations for the euro area over the medium to long term continue to be firmly anchored in line with the Governing Council’s aim of maintaining inflation rates below, but close to, 2%. As stated previously, the euro area economy is now experiencing a prolonged period of low inflation, which will be followed by a gradual upward movement towards inflation rates below, but close to, 2% later on.

There are two very serious problems here.  First, the question of whether Fed policy has long term credibility on the inflation front is quite different from the question of whether inflation is appropriate over the next few years.  I don’t doubt that even during the Great Deflation of 1929-33 most sensible people expected the deflation to end at some point, and prices to level off or maybe even rise a bit. The Fed needs to hit its targets over the next few years, and by that criterion the markets in September 2008 showed that monetary was far too tight.  The Fed should ignore 5 year forward inflation forecasts.  Indeed they should ignore inflation entirely, and focus on NGDP growth, which was falling sharply in late 2008.

The ECB report is even worse.  It actually predicts that inflation will be well below average over the next few years, and then close in on 1.9% a few years down the road. That means they are predicting a procyclical inflation rate, which is a totally insane policy.

In the past Europeans criticized me for suggesting the ECB should deviate from their single mandate to control inflation.  (BTW, it’s a lie to claim the ECB has a single mandate to control inflation.)  OK, so now even the ECB admits their policy will allow inflation to deviate from the target, and then gradually return to the target.  So they are flexible.  That should make me feel better, but then we find out they are flexible in exactly the wrong way.  A flexible inflation targeting regime calls for below average inflation when the economy is booming, and above average inflation when the economy is weak.  They plan to do the exact opposite!

The ECB is basically saying;  “We plan to continue screwing up economic policy for a few more years, but don’t worry, sometime late in the decade we’ll have an appropriate monetary policy.”  I’m sure the Greeks will be glad to hear that.

PS.  I got far behind on comments, but did respond to a few in the past 5 posts this evening.  I also have a Econlog post, if you are interested.

PPS.  Vaidas noticed the Europeans making the same mistake as the Fed made in 2008.  There is an old Chinese curse “May you live in interesting times.”  (I believe it’s apocryphal.)  How about “May you live in a large diverse economy overseen by a ‘teenager’ central bank.”  The Fed was 15 years old in 1929.  The ECB is now 15 years old.

PPPS.  My daughter will be 15 this year.