Before beginning, let me point out that many people seemed to misread my previous post. I was making no claims about causality. God knows I’m no expert in criminology! I was making a joke about people with a certain blind spot—incentive effects.
Scott,
Off Topic.
This claim by Edward Hugh reveals he really doesn’t get it.
http://fistfulofeuros.net/afoe/the-growing-mess-which-will-be-left-behind-by-the-abenomics-experiment/
“But it’s worse, the monetary expansion has driven down the value of the yen but in the context of the second arrow – a double digit fiscal deficit – this drop in value is leading to a growing not a declining trade deficit. The FT’s Tokyo bureau chief, Jonathan Soble, has an enlightening recent piece on this…”
Although Japanese nominal exports have surged by 15.2% between 2012Q4 and 2013Q3, nominal imports are up by even more, or by 16.5%:
http://research.stlouisfed.org/fred2/graph/?graph_id=149566&category_id=0
Devaluation improves a country’s trade balance only if the Marshall-Lerner condition on trade elasticities holds, and research shows that they’re not met in the majority of cases, either past or present:
http://www.emeraldinsight.com/journals.htm?articleid=17056473
That’s not to say that currency devaluation isn’t beneficial, of course it is, but the benefit flows primarily from increased domestic demand. Here is a study of the competitive devaluations of the Great Depression by Barry Eichengreen and Douglas Irwin:
http://www.nber.org/papers/w15142.pdf
The Great Depression is a particularly important historical example because then, as now, most of the advanced world was up against the zero lower bound in policy interest rates.
An examination of Figure 4 on page 48 reveals that the only countries that experienced import growth from 1928 to 1935 (the UK, Japan, Sweden and Norway) were members of the sterling block that devalued early (1931). In most of these countries net exports actually declined over the period because imports rose more than exports.
The order of recovery from the Great Depression follows the order in which they abandoned the gold standard perfectly:
http://fabiusmaximus.files.wordpress.com/2009/03/gold.png
But this wasn’t because of increased net exports.
The US devalued in 1933 which immediately led to a swift recovery from the Great Depression. Nominal exports doubled from 1933 to 1937. But nominal imports increased by 110.5%:
https://research.stlouisfed.org/fred2/graph/?graph_id=120991&category_id=0
As a result net exports went from a small surplus (about 0.2% of nominal GDP) to being roughly in balance.
France was part of the Gold bloc of countries that devalued late (1936). From 1936 to 1938 nominal exports increased by 95.4% and nominal imports increased by 80.9%:
https://research.stlouisfed.org/fred2/graph/?graph_id=120992&category_id=0
However, since imports were already substantially greater than exports, the nominal deficit actually increased by 55.4%.
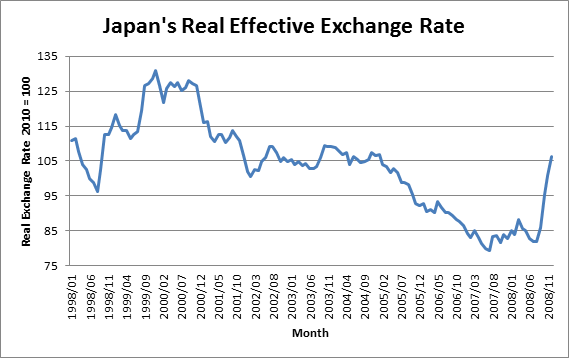
Japan’s original ryÅteki kin’yÅ« kanwa (QE) was officially announced in March 2001 and concluded in March 2006. The following is a graph of the BOJ’s estimate of Japan’s real effective exchange rate which is trade weighted with respect to 16 different currencies and takes into account their relative inflation rates:
http://thefaintofheart.files.wordpress.com/2013/06/sadowski2b_1.png
The real effective exchange rate fell from 116.25 in February 2001 to 91.09 by March 2006, when the BOJ announced the completion of QE, a decline of 21.6%.
Exports rose from 10.2% of nominal GDP in 2001Q4 to 19.3% of GDP in 2008Q3. Imports rose from 9.4% of GDP in 2001Q4 to 19.5% of GDP in 2008Q3. From 2002Q1 to 2008Q1 real (adjusted by the GDP implicit price deflator) grew at an average annual rate of 11.0%. Real imports grew at an average annual rate of 12.1%.
So there was boom in both exports and imports. But imports grew faster than exports, and net exports actually moved from surplus (0.8% of GDP) to deficit (-0.2% of GDP) between 2001Q4 and 2008Q3:
http://research.stlouisfed.org/fred2/graph/?graph_id=120989&category_id=0
It’s very telling that today the only major currency area up against the zero lower bound in interest rates that hasn’t done QE (the Euro Area) is also the only major currency zone where the trade balance has improved substantially since 2009, going from 0.6% of GDP in 2009Q1 to 3.3% of GDP in 2013Q3:
https://research.stlouisfed.org/fred2/graph/?graph_id=149559&category_id=0
But this has occurred in large part because nominal imports have been falling since 2012Q3 due to falling domestic demand. Nominal exports have barely changed since 2012Q3.
I’d add that Greece has done an especially good job of “improving” its trade balance.