Archive for December 2013


Guest blogging at Econlog

Starting tomorrow I will do a guest blogging stint over at EconLog, which is one of my favorite blogs. I’ve followed David Henderson and Bryan Caplan for many years (and Arnold Kling when he was part of the group.)  More recently they were joined by Art Carden and Bart Wilson.  Now Art is leaving and I will be given an opportunity.

I will continue to do some posts at TheMoneyIllusion, as I don’t want the brand to die out while I am at Econlog. I originally figured I’d do more non-monetary stuff at Econlog, but they are actually looking for more of a macro presence.  So I’ll use other criteria, such as the intended audience.  I may keep topics that are sort of “inside baseball” over here, where readers are more interested in the complexities of monetary policy, and cover issues with somewhat broader appeal over there. Non-economic topics such as movie reviews will stay over here, as will my more wacky political/sociological/philosophical musings.

Brace yourself for the taper

The research staff at TheMoneyIllusion.com anticipates that unemployment will fall to about 6% by the end of 2014.  If so, then market monetarists can be expected to begin tapering their calls for monetary stimulus about 12 months from today. Of course this decision will depend on the outcome of a Federal Market Monetarist Committee vote.  Some of the more hawkish members, such as Lars Christensen, are prepared to begin tapering today.  In contrast, Ben Cole prefers a data-driven approach, and is looking for the data point “hell freezes over.”

Recall that this taper forecast is not unconditional, but will depend on the future path of the economy.  If tapering does occur you can expect about 10% fewer demands for monetary stimulus each month.  When tapering is complete most market monetarists will not rest on their laurels, but instead focus on the need for more forward guidance, especially NGDPLT.  Once this recession is solved, the goal is to prevent the next recession.  That requires a new policy regime with much more robust forward guidance.

We decided to give readers a heads up on a possible taper decision, so that they’d have time to plan accordingly.  Of course if this post triggers outrage among my readers, and ad revenue falls sharply, I may delay the taper decision a bit longer.

When Bernanke and I say “data driven,” we actually mean “market driven.”

PS.  Blogging will be sporadic over the holidays.

Currency demand at Christmas

My dissertation looked at currency demand at Christmas.  Here’s what I discovered:

1.  Between December and January of each year real currency demand falls.

2.  The Fed accommodates that drop by decreasing the supply of currency by a roughly equal amount.

3.  Hence prices change very little between December and January

4.  The seasonal decline in percentage terms was much larger in the 1920s and 1970s than the 1940s.

5.  The seasonal decline as a share of GDP is fairy stable.  That’s because the cash/GDP ratio was far higher during the 1940s.

6.  The seasonal decline was concentrated in coins and small bills.

Here’s what I concluded.

1.  The seasonal variation in currency demand is due to transactions balances, not hoarding balances.

2.  Hoarding demand (and thus total cash demand) rose sharply between the 1920s and 1940s due to falling interest rates (op. cost of holding currency) and rising tax rates (benefit of hiding wealth from government in the form of currency.)  Between the 1940s and 1970s the ratio fell back to 1920s levels due to rising interest rates. The transactions demand for cash as a share of GDP varies relatively little over time.

3.  In the 1920s people shopped with coins and small bills.  By the 1970s coins could no longer be used to make significant purchases and were merely used for change in non-seasonal transactions (parking meters, phone booths, Coke machines, etc.)  I seem to recall that coin seasonality dropped due to inflation, but am not certain.  But big bill seasonality did not rise as much due to inflation as you’d expect, as consumers switched to credit cards and checks for big transactions.

4.  Because the total cash ratio to GDP was high during the 1940s, but transactions use of cash was not particularly high, the seasonal drop-off was much lower in percentage terms.  But still about the same in absolute terms, as a share of GDP.

5.  Because large bills are hoarded they wear out much more slowly than small bills.

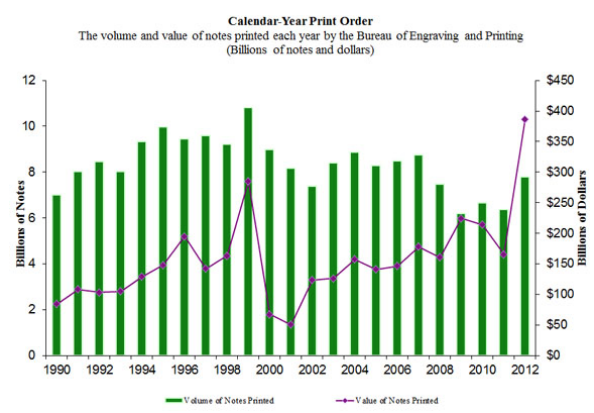
There was one policy implication that I did not discuss (or indeed realize until much later.)  If we were going to go the “old monetarist” route of targeting the money supply, the optimal policy would not have been to target the quantity of money in value terms (which is distorted by hoarding), but rather the quantity of money by volume.  I.e., the actual the number of green pieces of paper in circulation.  Dollar bills and $100 bills each count as “one bill.” In the graph below you’ll notice that the value of currency produced by the government (purple line) actually rises in 2009.  So money was not “tight” in that sense. But the volume of new currency notes issued (green bars) falls between 2000 and 2002, and also between 2007 and 2009.  (Ignore the 1999 build-up for Y2k.) So money was tight in volume terms but not value terms.  Why the difference?  

Between 2007 and 2009 the interest rate fell to zero, making it much more attractive to hoard $100 bills as a way of avoiding taxes.  In contrast, transactions fell during the recession; so fewer small bills were “needed.”  I used the scare quotes because of course in a macro sense more small bills were “needed.”  More precisely, a monetary policy regime was needed which would have produced a steady production level of bills by volume. That production is endogenous given the monetary regime, but responds to changes in goods and services transactions produced by changes in the policy regime.  This post explains the idea in more detail, using coin production.

Screen Shot 2013-12-25 at 9.41.26 AM


Have a Merry Christmas and Happy New Year.  Or to my readers who do not celebrate Christmas, just a Happy New Year.

PS.  Dylan pointed me to this funny satire by John Carney, which includes this blog.

If you look hard enough for a reason to tighten…

Now that eurozone inflation has fallen far below the ECB’s 1.9% target and seems likely to stay lower, the Germans are in an embarrassing position.  They can no longer oppose monetary stimulus by their usual arguments—that the ECB should focus like a laser on inflation targeting and ignore growth.

So now they are looking for a housing bubble in Germany to justify my their hawkishness.  JN sent me the following article:

It still enjoys a reputation as a renter’s paradise, but on Monday the Bundesbank issued a warning about the rise in house prices in Germany. In its monthly report published on Monday, the central bank said that properties in German cities “may currently be overvalued by between 5% and 10%”.

So I went to The Economist’s great interactive housing guide and plugged in real housing prices for the past 20 years:

Screen Shot 2013-12-18 at 9.24.22 AM

The top line is the US, with the famous up and down pattern.  The bottom line is Germany, where real housing prices seem remarkable stable, although they look like they have fallen about 20% in the past 20 years.

Now admittedly the 2012 endpoint is out of date, so I went to the most recent data I could find, August 31, 2013, where The Economist reported that nominal German house prices are up 5.1% in the past 12 months. So maybe real housing prices have only fallen about 15% in the past 20 years.

Having trouble seeing a bubble?  That’s why you don’t work at the Bundesbank. You just aren’t squinting at the data in the right way.  There’s definitely a bubble brewing in Germany.  After all, there is no fundamental reason why German house prices would rise 5% after falling 20% in real terms.  It’s not like Germany is the shining star of Europe, with amazing low 5.2% unemployment.  And it’s not like long term interest rates are at a record low level.  So it must be a bubble.

The article JN sent me concludes with the following paragraph:

Not all German economists are convinced by the Bundesbank’s gloomy analysis. The Institute for the German Economy in Cologne looked into the subject last year and concluded that the rise in property prices was healthy and no bubble was in sight. “In Germany we’ve seen roughly a 10% rise in credit,” said Michael Schier of the institute’s real estate team. “That simply doesn’t compare to the 150% bubbles we saw in some of the countries that were hit by the credit crunch.”

OK, 10% is not as much as 150%.  But it’s still clearly a bubble.  How could it not be?

This is insane

Why does the media insist on reporting exchange rates this way?

Screen Shot 2013-12-21 at 2.49.36 PM

Off topic, but if anyone here is good at statistics, I have a question.  I was regressing monthly stock prices on gold stocks during the late 1920s and early 1930s.  I’d like to show that the variables only became correlated during periods of exchange rate crisis (after mid-1931.)

[Update:  I actually regressed first differences of stock prices and gold stocks.]

I’ll provide the output and you tell me if the difference is significant:

Before mid-1931:  Adj R2 = .000,  t-stat =  0.55,  D-W = 1.26   n= 53

After mid-1931:    Adj R2 = .201     t-stat = 2.51,  D-W =1.81   n=22

Everything looks good to me except the Durbin-Watson from the first regression. Here’s my question.  On the one hand you could argue that the results are not meaningful, as the first D-W is too low.  On the other you could argue that the second regression is fine, and the low D-W on the first doesn’t matter because the R2 is zero anyway, so there’s no correlation at all, nothing to “correct” (which is what I’d like to believe.)

I ask because a reviewer says I can’t use the regressions, and I don’t want to do it all over (I don’t even know where the data is.)  Can I make any kind of claim here?

Will Christmas come early?