

Where to put the trend line?
There’s a now famous graph showing the big drop in American NGDP, relative to trend, after mid-2008. The slowdown was even more severe in Europe. I’ve often pointed to Australia as a country that avoided this dramatic NGDP growth decline. But commenter Declan pointed out that it sure looks like Australian NGDP crashed much like American NGDP, at least on the graph he sent me:
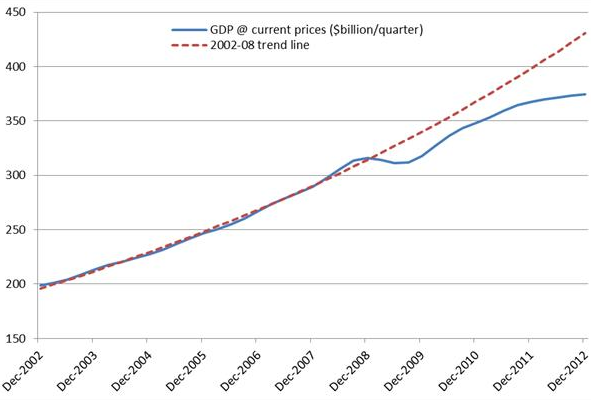
So was I wrong? Maybe, but I’m not convinced, and I’d like to know what you think. My theory is that people have their eye drawn toward trend lines that may not be real. Suppose we drew that red line slightly lower, so that 2008 was a boom period well above trend, and 2012 was back on trend.
So I did some computations, and here’s what I noticed:
Australian NGDP growth from 1996:2 to 2006:2 averaged 6.54%
Australian NGDP growth from 2006:2 to 2012:2 averaged 6.49%
Those both round off to 6.5%. That sure looks like “level targeting.” So what’s going on here, and why does the graph look so different?
I picked 2006:2 because that’s when Australia’s big commodity boom seemed to begin rapidly boosting NGDP. It grew at a 9.65% annual rate over the next 9 quarters, pushing NGDP well above the 1996-2012 trend line. Then the commodity prices fell sharply in the 2009 recession, and Australia’s NGDP actually declined a tad. Normally that would have produced a recession, but the decline was from such a peak of prosperity that it merely led to a sluggish period of slightly elevated unemployment. At least that’s what I think happened.
In contrast:
US NGDP growth from 1996:2 to 2006:2 averaged 5.5%
US NGDP growth from 2006:2 to 2012:2 averaged 2.6%
However, for the US the period around 2006:2 was probably near our peak, so I generally use mid-2008 as a benchmark; when unemployment was closer to the mid-5% range, i.e. closer to the natural rate. But the slowdown still looks very sharp.
US NGDP growth from 1996:2 to 2008:2 averaged 5.25%
US NGDP growth from 2008:2 to 2012:2 averaged 1.97%
And I think the slowdown in the US would look sharp for any plausible “before and after.”
There is probably a bit of serendipity in the Australian numbers, and given the volatility caused by commodities, as well as the probable global “Great Stagnation” now beginning, I’m not predicting Australia will keep growing at 6.5%—I’d expect somewhat slower growth going forward.
I’d welcome suggestions from commenters, and have an open mind on how to draw trend lines. But keep in mind that it’s easy to be fooled into thinking it’s “obvious” where the trend line should be, when it’s not at all obvious. When someone adds a trend line to a chart, they are subtly biasing the way you look at that chart; the way you interpret the data. I can draw a line to make it look like there was a big boom, or a big recession, depending on how high up I draw the trend line. You might think some sort of “least squares” approach is objective, but it’s not—as you still need to decide which years to include. I’m pretty sure Tyler Cowen would say even mid-2008 was above trend, in retrospect.
And of course trends change over time when central banks are not doing NGDPLT, which makes things even trickier. Even the “Great Moderation” in the US saw a subtle drop in the trend line from the 1980s to the 1990s.
Tags:
10. April 2013 at 06:43
Scott,
Why don’t you try to look at agregated nominal wages in australia? I don’t have time now to find the data, but it shouldn’t be difficult. Maybe some nice commenter can lift it for you.
10. April 2013 at 06:52
Arthur, I hope some commenter can find it–but it needs to be hourly wages.
10. April 2013 at 07:39
The trend line on the chart you show is some sort of best-fit curve. There is also the issue of scaling on both axes. a chart that showed data from the early 90’s to date and a vertical axis that started with zero would result in a less deceptive presentation.
10. April 2013 at 07:45
The question of whether real GDP is stationary is one of the most well-worn paths in the literature. But I don’t think anyone has looked at NGDP, which seems like a great metric to judge a central bank by.
FWIW, running a couple unit root tests on the Australian data (Augmented Dickey-Fuller, Phillips-Perron, KPSS, on log current price GDP), the early data is pretty much stationary, but when you look at data from about 2007 onwards that really breaks down. Perhaps there is a break around 2008-2009 (that more robust analytical techniques could handle), but even if you restrict the data to post-2010, you tend to accept the unit-root hypothesis. Note that you tend to accept the unit-root hypothesis on US NGDP even for those earlier periods.
But there is almost as much interpretation in these kind of tests as there is to manually drawing a trend line and eyeballing the trend, and further rigorous study would be required before coming to a final conclusion.
10. April 2013 at 07:48
Scott,
When I get home tonight I’ll send you a graph I made that I think will shed light on this. Long story short, Australia and Norway are both relative outliers in terms of “not a lot of lost RGDP given NGDP below trend,” and I wonder if it can be explained by viewing commodity and energy price increases as a large positive supply shock.
10. April 2013 at 08:08
I don’t like trend lines because, by definition, the best fit curve moves closer to the actual historical observations over time as new observations get added in.
I would prefer calculating a “trend end point” for each year, using only prior observations, and perhaps an exponentially declining weight scheme, and then not revising that trend end point as new data comes in. That doesn’t give a perfect linear curve, but the difference between actual outcome and trend endpoint is a good measure of policy deviation from stability.
10. April 2013 at 08:32
I’m with Neil S., the trend line starts way too late in the ballgame to show anything useful. Especially since Australia has been in an expansion since the early 90s.
10. April 2013 at 08:57
I see the same issue with labor force participation. There is a lot of hand-wringing created by assuming the LFPR in late 2007 was carved in stone for all time. Pretty much the entire decline in LFP can be explained away by a combination of long term and demographic trends and an allowance for a LFP bubble in 2006-7.
10. April 2013 at 08:58
Sorry…I just realized you probably won’t like the word “bubble”. Consider it sloppy writing & insert your own noun.
10. April 2013 at 09:08
It’s posts like these that make me wish I had as open a mind on as many occasions as Dr. Sumner. This post shows me that he is in a different class than myself in this respect. Anyway…on to the topic:
IMO, this is a tricky problem only if one a priori theorizes that there is, or should be, an underlying “trend” in the economy in the first place.
The question being considered is “Where should the trend line go?” I think the question that should be asked is “Should we even intepret a ‘trend’ at all?”
An analogy: Suppose I have been eating a ham sandwich every day for lunch for the past year. Suppose I find out that I am allergic to ham, and didn’t know it, and from now on I will not eaten a ham sandwich per day.
Now let’s fast-forward a day. Suppose I don’t eat a ham sandwich, and that nobody else takes my place either. The “trend” of ham sandwich eating has fallen by one sandwich per day.
Now, the question is should there be someone who steps up and takes my place and eats a ham sandwich that day so that the “trend” of ham sandwich eating continues on as before? If so, why? Also, is the one ham sandwich per day the “correct” trend, given that my preferences have changed? Should the trend have been interpreted as one less sandwich per day all along, given my new preferences today?
I think at first glance there are two main responses to this:
One is that there should be a ham sandwich eaten that day, because the ham sandwich seller would otherwise experience a decline in income, and we must make his interests primary. If the rules of property constrain activity such that a ham sandwich is not eaten, then the rules of property should be broken such that a ham sandwich is eaten that day. So the argument here is that there is something real in the historical “trend” that transcends market constrained activity, and should continue on for its own sake, even if it means benefiting the ham sandwich sellers at the expense of others (since there is no such thing as a free lunch).
The other is that there should not be a ham sandwich eaten that day if the rules of property constrain activity such that a ham sandwich is not eaten that day. So the argument here is that there isn’t anything real in the historical “trend” that transcends market constrained activity, and should not continue for its own sake, and thus the ham sandwich sellers lose and others who otherwise would have lost, don’t lose.
In short, the problem of this “trend” is solved by making a decision on whether or not activity is to be constrained to the market, or whether or not activity is to not be constrained to the market.
If we assume that the market process of interaction will result in one less ham sandwich eaten that day, then any prior conceived “trend” that would have seen a ham sandwich eaten that day, isn’t actually a “trend” at all. It is a unique history only. A product of past knowledge and past preferences, that are no longer applicable in the present.
Do we want to act in the future, contentwise, the same way we acted in the past, for the sake of a “trend”, no matter if initiations of violence against innocent people are needed to ensure that this smooth “trend” continues?
Understood in this way, the question of where the “trend” should go, or whether there should be a “trend” at all, are answered by implication.
10. April 2013 at 09:18
Can you find the trend by examining when unemployment is roughly at the natural rate and inflation is roughly contained? If Australian unemployment in 2006 is 5% and in 2008 is 2%, that’s evidence to draw the trend through 2006 instead of 2008.
10. April 2013 at 09:56
Does a coming “great stagnation” really change what the nominal trend ought to be?
Or this is why a futures market would be better than a CB governed target?
10. April 2013 at 10:12
Arg! Use log scales! People are terrible at eyeballing exponential curves but really good at lines.
10. April 2013 at 10:29
Ah, the perils of being a Zero Bounder;
http://www.youtube.com/watch?v=f7wkMwz5l0A
When Stockman asks to be taken back to the woodshed (about the 7 minute mark), Paul can’t deliver, because to point out that interest rates are NOT the price of money would expose a lot of his own fallacious reasoning.
10. April 2013 at 10:50
Jamie Dimon says JP Morgan is prepared for rising interest rates:
http://www.businessinsider.com/jamie-dimon-on-rising-interest-rates-2013-4
10. April 2013 at 11:10
It’s the last couple of years that’s been the issue in Australia. The 4Q-moving average of NGDP growth has declined to <2% in the last two quarters, the lowest rate since the early 1990s recession, with no indication from the RBA that they see anything wrong with that.
Further, the 2 quarters before that (March and June 2012) had <5% growth in the 4Q-ma. Outside the 4 quarters of the financial crisis, Australia had only experienced 5 individual quarters of slower 4Q-ma NGDP growth since 1993.
10. April 2013 at 11:12
Sorry, I should have said:
“Outside the 4 quarters of the financial crisis, Australia had only experienced 5 individual quarters of sub-5% 4Q-ma NGDP growth since 1993.”
10. April 2013 at 11:13
Dimon really gets it wrong. 1994 was completely different. Rates are nothing today because expected growth is low. An increase in rates would just means we’re exporting more, banks are lending, yada yada yada.
10. April 2013 at 11:57
Neil and Patrick, That’s right.
Nick, I used to be interested in the unit root stuff, until I realized that it was like trying to pin jello to the wall.
Dan, I think you are right that commodities have a lot to do with the NGDP/employment correlations. But I still don’t see the NGDP growth crash. From 6.54% to 6.49% doesn’t seem like much of a slowdown.
kebko, I have some doubts about that, but I agree that LFPR data is very ambiguous.
Geoff, And there was a time when I didn’t think you were insane.
Neal, That’s what I was thinking.
Ashok, You asked:
“Does a coming “great stagnation” really change what the nominal trend ought to be?”
Not at all, but most people (including the RBA) don’t agree with me. So NGDP growth will likely slow.
Jason, Yup.
Rajat, How about unemployment? If it’s just weaker commodity sector output, I’d guess employment would not be hit very hard.
10. April 2013 at 12:14
Scott, unemployment is at 5.4%, which is where it was in about 2004. So not too bad. But the employment to population ratio is at 2009 lows, although I know you’re not a fan of that measure.
10. April 2013 at 12:54
Kebco,
Is it true or not that our workforce is growing? If it is growing, then jobs aren’t growing fast enough to keep up and that’s the reason LFP is going down. If more people are aging into retirement than aging into the workforce or immigrating then the fall in LFP is due to demographics. Since I’ve consistently heard and read that the labor force is growing, I have to assume that the falling LFP is due to a weak jobs market.
10. April 2013 at 13:51
@Geoff: You’re too obsessed with individuals. A chemist can’t predict the future motion of an individual gas molecule either, but still the science of thermodynamics can make very strong predictions about average, aggregate properties like heat flow and pressure.
You seem to have an intuition that, if the individual behavior is hard to predict, then the aggregate behavior is surely even more impossible to predict. But your intuition is wrong. Aggregate, average behavior is in fact much more reliable to predict than individual behavior.
10. April 2013 at 14:24
I´ve noticed that many countries began a “Great Moderation” period in the early 90s. In Europe it was after the initial upheavals in the EMS (when the UK & Sweden ‘opted out). In Australia it more or less coincides with the IT regime. The trend is determined by the period during which NGDP evolved ‘smoothly’. In Australia I´ve determined that happened from 1992 to 2005. The problem with the chart you put in the text is that the trend is ‘determined’ as an average of different periods (including the period 2006-08) when NGDP ‘took-off’).
I believe my analysis gives a better picture of the Australian case:
http://thefaintofheart.wordpress.com/2013/04/04/australian-ngdp-bouncing-like-a-cat-in-boiling-water/
10. April 2013 at 15:11
Don Geddis,
Have you uncovered the underpinnings of Harry Seldon’s Psychohistory?
“A chemist can’t predict the future motion of an individual gas molecule either, but still the science of thermodynamics can make very strong predictions about average, aggregate properties like heat flow and pressure.”
We can take this in the opposite direction….The laws of celestial mechanics are well undrsood and essentially unchanged since Isaac Newton. We can perfectly predict the the trajectory of an object through space, but we can’t solve the n-body problem.
We can forecast the weather in the near term but we cannot forecast the weather more than a few days out.
People do not follow the laws of gasses. There are fads, and panics, bubbles and crashes, cause and effect leading to an unexpected chains of events. The economy is a vicitim of the peverbial butterfly effect, bubbles happen, markets crash.
Even Seldon’s plan failed to stay on track as there was a variable that he had not accounted for.
10. April 2013 at 15:15
For those who want to play with the Oz NGDP data, it is here.
A simple linear trend from March quarter 2001 to December quarter 2012 says that NGDP was above trend in 2008, below trend in 2009 and back on trend in 2010. So, yes, how you pick your tend matters.
Given the commodity boom, which has massively reversed the long run decline in terms of trade, I prefer the way Marcus presents the data too.
10. April 2013 at 15:52
Dr. Sumner:
“Geoff, And there was a time when I didn’t think you were insane.”
I’ll take that as a compliment.
Don Geddis:
“You’re too obsessed with individuals. A chemist can’t predict the future motion of an individual gas molecule either, but still the science of thermodynamics can make very strong predictions about average, aggregate properties like heat flow and pressure.”
Humans aren’t molecules. Molecules behave according to constant causality. Every single time you have the same volume of the same gas at the same temperature, there will always always always be the same pressure exerted by the whole volume of gas.
There are no similar equal constancies in relations with people. No economist has ever discovered such a constant of causality.
You are too obsessed with groups of individuals. Economists can’t predict future motions of individuals alone or in groups. If they could, they’d all be billionaires.
“You seem to have an intuition that, if the individual behavior is hard to predict, then the aggregate behavior is surely even more impossible to predict. But your intuition is wrong. Aggregate, average behavior is in fact much more reliable to predict than individual behavior.”
No, my intuition is right, not wrong. My intuition is that because I can learn over time, my past behavior displays no constants of relations than can enable me to know the future path of my own learning going forward, let alone other people’s knowledge.
You’re deluded in the belief that “strong predictions” can be made in human life. Why aren’t you a billionaire? Don’t fool yourself.
10. April 2013 at 17:11
Australia and Canada are similar countries. But compare how sharply Canadian NGDP drops in this graph:
http://worthwhile.typepad.com/.a/6a00d83451688169e2017ee72880f0970d-pi
Australian NGDP slows a bit, but nothing near as sharply as Canadian. Australia missed having a recession. Canada had a recession.
I don’t think it’s the trend line. It’s the sharpness of the drop.
10. April 2013 at 18:05
Arthur and Scott: google ‘ABS 6345.0 Wage Price Index, Australia’.
Dan S: exactly, this is basically about iron ore and coal prices.
Geoff: I agree, there is no obvious ‘correct’ trend in the absence of an explicit target, but see my comments below.
Jason: I tried, but then Excel forces the axis scale tick marks to be separated by at least a factor of 2, which is also confusing. The exponential curve isn’t huge on this timescale, and is built in to the trend line anyway.
Marcus: love the title!
Anyone still interested: I emailed Scott this graph in response to his claim in an earlier post that Australia had de facto followed NGDP level targeting. I think this is wrong whichever way you cut it: there is no NGDP trend line where we don’t deviate significantly at some point.
If you pick the period I did, we have been well below ‘target’ since ’09. If you pick some earlier period like 1996-2006 to draw the trend, then we were well above ‘target’ in the mid-late ’00s, and below it for most of the intermediate period. If you go back even further we came back to the 1960s trend line sometime in the 90s or 00s. (See Marcus’ post for yet another option where we are still above trend.)
Essentially, I don’t think anyone would look at a graph of Australia’s NGDP and say “hey, the RBA has been following NGDP level targeting”, unless they already knew we had avoided recession and were looking for an explanation.
11. April 2013 at 06:37
Rajat, Thanks. No measure is perfect, it depends to some extent on the issue being considered.
Marcus, That’s possible, but I’m more inclined to think that there is no stable trend line, and that it changes over time.
Thanks Lorenzo.
Nick, I agree.
Declan. But the period 2002-08 ends at the peak of a great boom. Obviously if your trend line goes through the peak of a great boom, what comes next will be below trend. That’s a tautology.
Having said that, I certainly wouldn’t claim that Australia fits the NGDPLT model perfectly, as you showed the deviations were longer lasting than you’d expect from NGDPLT. But I agree with Nick, the line looks much more like NGDPLT than countries like Canada (or the US/EU).
11. April 2013 at 07:34
Declan:
“Geoff: I agree, there is no obvious ‘correct’ trend in the absence of an explicit target, but see my comments below.
I would argue there is no “correct trend” WITH targeting either. For the targeter could be targeting a variable that is above or below what the market process would have otherwise brought about.
Imagine I put the entire world’s population into a “target” of induced coma, and sustained everyone through feeding tubes. There would likely arise a “trend” in people’s behavior. But is the “trend” I am “targeting”, the “correct trend”? According to you, because there is a centralized power target, as opposed to no centralized power target, we can talk of “correct trends” of people’s behavior.
Dr. Sumner:
“But the period 2002-08 ends at the peak of a great boom. Obviously if your trend line goes through the peak of a great boom, what comes next will be below trend. That’s a tautology.”
It’s a tautology no matter what you put “the” trend.
If you put “the” trend well below the 2002-2008 data, then we would still be in a “boom” right now.
There is no scientific way to superimpose any “trend” on history that extends into the future under which we are to be forced by centralized power, that is anything other than a subjective judgment of what people “ought” to do in the future. It’s really just forcing the status quo, and arresting/imprisoning those who act against the central force tasked (by the subjective judge) with maintaining the status quo.
Aparently, it doesn’t matter if market forces change would bring about deviations from the status quo. Those forces are to be “fought back”, because, well, the central bank by its very existence has to fight back against something, so maybe if they fight back against market determined NGDP, it will do the least damage.
And then the investment errors that build up over time from this constant antagonism, are ignored as insignificant, because of a new psychological insistence that fighting back against market determined NGDP is actually good for the market.
11. April 2013 at 10:30
Oops – Oz UnN now up to 5.6%.
11. April 2013 at 15:08
Scott,
“I certainly wouldn’t claim that Australia fits the NGDPLT model perfectly, as you showed the deviations were longer lasting than you’d expect from NGDPLT. But I agree with Nick, the line looks much more like NGDPLT than countries like Canada”
Good lord, has a blog comments argument actually ended in agreement!? I am happy to agree with you and Nick on the last point.
Geoff,
As long as money exists, we have to pick some value for it: $1 = 1/35 oz. of gold, a steadily declining fraction of nominal GDP, whatever. The argument wasn’t about what the ‘correct’ level of NGDP is, but whether Australia’s monetary policy is well approximated by a NGDP level growth path.
12. April 2013 at 05:21
Declan:
“As long as money exists, we have to pick some value for it”
Who’s “we”? Those calling themselves government? They’re not “we”. They’re them. You’re not me. You’re not them. I am not you. Let’s be clear on who’s who. This “we” makes it seem like you and I are controlling the supply of money.
“$1 = 1/35 oz. of gold, a steadily declining fraction of nominal GDP, whatever.”
The fact that a centralized system requires decisions on “whatever”, doesn’t suddenly make the outcomes of those decisions a “correct trend”.
“The argument wasn’t about what the ‘correct’ level of NGDP is, but whether Australia’s monetary policy is well approximated by a NGDP level growth path.”
Actually the argument was about neither of those things, but OK, if you want to consider whether or not Australia is well approximated by NGDPLT, then so be it.
12. April 2013 at 05:25
Declan, There must be a blue moon out tonight.
4. September 2013 at 05:36
[…] in fact doing PLT at 2.09%. Fitted trend lines trick the human eye, as I’ve discussed in previous posts. Do I have evidence that they were not doing PLT at 2.09%? Sure, lots of evidence. The Fed […]