

Reply to David Andolfatto
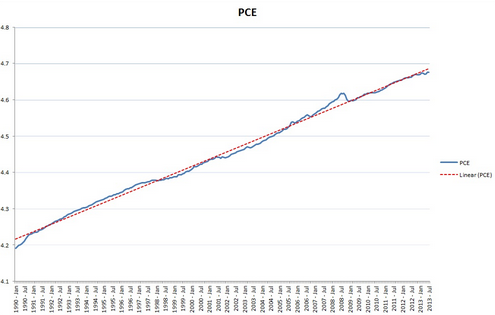
David Andolfatto has a new post raising some questions about NGDPLT. He presents this graph of the price level (in logs):
And here is an easier to see version:
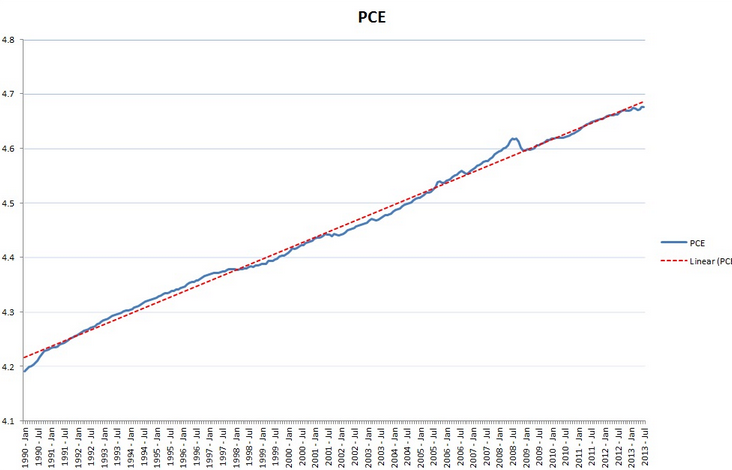
Then Andolfatto comments:
The PCE inflation rate since 1990 averaged 2.09% per annum.
What’s interesting about this diagram is that even though the Fed does not officially target the PCE price level, the data above suggests that the Fed is behaving as if it does.
As a price-level (PL) target is equivalent to a nominal GDP (NGDP) target in a wide class of macroeconomic models (especially under the assumption of constant productivity growth), then what more does the NGDP crowd expect from an official NGDP target? Seems to me that they are just asking for more price inflation and wishfully hoping that some of the subsequent rise in NGDP will take the form of real income.
Tell me I’m wrong (and why).
I think he’s wrong for many reasons, but I’ll just list a few.
1. Government price indices don’t measure the prices that are of macroeconomic interest. For instance in the 6 years after the housing bubble peaked the US, BLS data shows housing prices rising by about 10%, while Case-Shiller showed a 35% decline. Housing is 39% of the core CPI. That’s a big deal.
2. But even if the data were accurate, prices are the wrong variable, and models that suggest PLT is equivalent to NGDPLT are simply wrong. Indeed one of the strongest arguments for NGDPLT is that it does better when productivity growth is unstable. And productivity growth in America is unstable.
3. It’s also a mistake to draw a trend line on the assumption that the Fed is doing PLT at 2.09%, if it is not in fact doing PLT at 2.09%. Fitted trend lines trick the human eye, as I’ve discussed in previous posts. Do I have evidence that they were not doing PLT at 2.09%? Sure, lots of evidence. The Fed called for fiscal stimulus in late 2008 and early 2009, which would have been sheer madness if they had been doing PLT at 2.09%. As you can see from the graph, the price level was actually above target in 2008, suggesting an overheating economy. That strongly suggests the trend line is in the wrong place.
4. You might respond that the trend line sure looks accurate. Yes, but I could draw a different trend line that would look equally accurate from 1990 to 2008, and then show the price level below target after 2008. Who’s to say that’s not right? Indeed that trend line would be far more consistent with the Fed’s calls for fiscal stimulus, and complaints from Fed officials that demand has fallen short of their goals.
If PLT and NGDPLT really were similar policies, then why does NGDP look far below trend since 2008, while the price level (according to Andolfatto, but I have my doubts) is right on trend?
Unfortunately I don’t know how to add trend lines to St Louis Fred graphs. But here’s the graph I’m thinking of, from January 1990 to September 2008. If you assume the Fed was doing PLT during that period, and fit a trend line, I claim that the period after September 2008 would entirely lie below the trend line. That would be partly because the slope would be steeper, and partly because the trend PL would be higher in September 2008 than on Andolfatto’s graph.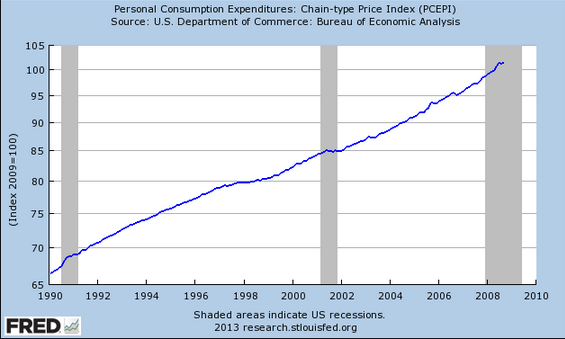
HT: Mark Thoma, Bill Ellis.
Tags:
4. September 2013 at 06:17
I think your third point is weaker than the rest. The price level targeters could have thought that there were expectations that inflation would decline sharply. They could argue that additional fiscal stimulus would have been needed even though they were above the price level now. They may have been below in 1 or 2 year out forecasts.
4. September 2013 at 07:33
If you make the assumption of “especially under the assumption of constant productivity growth” then he is right that NGDPLT and PLT will achieve the same results.
If the only thing that changes is AD then either kind of targeting will lead to identical adjustments to the money supply and identical results in terms of inflation and NGDP.
If the changes are on the supply side (either because of real or psychological factors) then the results will start to vary. PLT in the face of a supply shock may lead to unnecessary monetary tightening and a recession.
It is possible that even NGDPLT may lead to unnecessary tightening if the demand for labor falls sufficiently that the labor market doesn’t clear even when the NGDPLT is hit. In this case nominal wage targeting of some kind would be needed to ensure optimal RGDP is hit.
4. September 2013 at 07:40
I prefer NGDP targeting…but worth noting is that Bank of Thailand targets between 0.5 percent and 3.5 percent inflation…that flexibility could come close to NGDP targeting in practice…when did 2 percent become sacred?
4. September 2013 at 07:50
Point #4 is interesting, but not likely correct. I was very surprised, actually, but pre-Sept2008 trend is very close to the trend for the entire series.
I also do not know how to add trendlines FRED, but excel can come to our rescue. Downloading the data from FRED that you used to generate your final figure (PCEPI), I can fit two frendlines in Excel — one pre-Sept2008 and one for the entire series. (I fit an exponential line, which is like fitting a linear trend to the log-transformed data).
You can download the figure here: https://dl.dropboxusercontent.com/u/6874356/PCEfit.pdf
The two trendlines are virtually identical. I display the equation for both, though you can see a minor divergence near the end. The overall conclusion is that the PCE price index data returns to a pre-crisis trend.
4. September 2013 at 07:55
Scott: I redrew the trend fitted through Jan 1990 – July 2008 (the local peak of the PCE series). There is virtually no change in the result. (Also, remember to log the series next time).
4. September 2013 at 08:13
I had a deja vu readin this one. Until I realized that Nick Rowe already did this but instead of FED and PCI it was Bank of Canada and CPI. More here: http://worthwhile.typepad.com/worthwhile_canadian_initi/2013/01/the-bank-of-canadas-success-and-failure.html
Short summary:
1) PCI price level targeting (or even PCE price level targeting) is not core inflation targeting – which is superior in terms of monetary policy (read Mankiw for why is it so)
2) Even 1 is wrong. Price level and inflation targeting is a mistake. Keeping price level does not help us prevent recession. You do not need models to tell you that. Look at real world and learn. So the only thing that should suffice is Scotts point #2.
4. September 2013 at 08:21
“especially under the assumption of constant productivity growth.” Well, it is mainly because productivity growth isn’t constant that NGDP targeting is in fact both theoretically superior to, and sometimes very different from, inflation targeting. The productivity surges of the later 90s and 2001-7 were important instances in which inflation targeting called for greater easing that NGDP growth targeting would have–with what some consider to have been very unfortunate consequences.
4. September 2013 at 08:26
BLS housing vs. Case Shiller housing.
It is my understanding that that the BLS is interested in rents, and treats homeowners as landlords who rent from themselves.
Rents can increase as prices fall.
Somewhat related to #3… If we broke this into 5 year periods, we would have 5 rather different trend lines. It is all about the endpoints.
4. September 2013 at 08:26
I use the GDP deflator. When I use the Great Moderation period, the price level is slightly below trend.
One obvious difference is that the GDP deflator includes the prices of newly produced homes.
More generally, the impact of monetary disequilibrium of the prices of capital goods is entirely ignored. Normally, spending on consumer goods is more stable an so one would expect that much of the impact of monetary disequilibrium on prices would show up in capital goods prices and not consumer goods prices.
Why focus just on consumer goods? It makes the Fed look good? Because most voters care about higher consumer price inflation and so that is what politicians care about?
Or is it we are generating a price level whose purpose to estimate changes in the real standard of living. It’s purpose isn’t to proxy monetary disequilibrium?
4. September 2013 at 08:28
By the way…
The Fed was unable to prevent the run up in the CEP due to high gas prices right away, but it did a could job of reversing the deviation. The chart shows exactly how price level targeting is a disaster in the face of supply shocks.
4. September 2013 at 08:30
NOW FINALLY THE DEBATE MOVES ON!!!
You’ll note that years ago I was drawing this line, and well, since I’m not whatshisname, making a bunch of other graphs, I got a tepid response.
But MM’s BEST ANSWER is NOT that “well the Fed was calling for stimulus in 2008, so…. blah blah blah”
Instead MM’s best response is “YEP! And if we followed NGDPLT, right there in Jan 2005, the Fed futures market would have started jacking rates to get that thing back to trend.
——
I think this is tautologically true:
It is IMPOSSIBLE to say well let’s draw a line, where NGDPLT would never require us to raise rates, cool off, whatever.
AND 2005-2008 is THE STEEPEST LINE on the chart.
——
Look, from 1997-2000 its easy to assume we got some serious Real GDP, productivity gains were massive.
Then after 2000, corporations figured out how to run more efficiently, and didn’t have to rehire, and Greenspan allowed his desire to get back to level at 2005, OVERWHELM him and we did obscene things with housing.. we did dirty things that you should never do with housing.
When taxi drivers have 2-3 flip homes. When Vegas bartenders have flip homes. There is something wrong.
If we have a new unemployment equilibrium and Greenspan was trying to use housing to break past it starting in jan 2005…
Let’s dance around and scream MM would have stopped Greenspan in his tracks. That’s a huge claim!
We have to be able to show when exactly historically NGDPLT would have taken the historical punchbowl away!
4. September 2013 at 08:31
Scott, your objections sound a lot like: “That’s all well and good in practice… but how does it work in theory?”
The hurdle is not whether “its different this time” and nominal measurement quibbles. The question is whether NGDP to LR trend has been and is a good policy indicator.
Bottom line, is the empirical NGDP to LR trend a better policy guide than interest rates?! Unequivocally yes.
Take US NGDP back to 1790, take the best fit with fewest assumptions (why does it need to be log, anyway — just fit it, and recalculate as necessary. It does not have to work in perfect theory — lord knows that the Fed’s reaction function doesn’t.). You see that wars and 1970s inflation dragged NGDP some 40% above long run trend, and the civil war was nearly 100% above trend. Right now, US NGDP is some -30% below trend.
http://www.measuringworth.com/usgdp/
Besides, NGDP is not exactly a random walk — >95% explanation with NGDP LR trends is — again — BETTER THAN RATES. Technology, capital, and population have reliably grown in the US at LR exponents. It has never been “different this time” other than cyclical variation (which can last decades), and those who go out on this IDTT limb are consistently wrong in the LR.
And, if you are really desperate to do additional work, there are estimates of potential NGDP to cross-check whether NGDP is LR mean-reverting:
http://research.stlouisfed.org/fred2/graph/?g=m4h
4. September 2013 at 08:33
How is NGDP measured? Do you have an old post where you describe what metrics the FED would use and how accurate and timely they are? Most macro economic data I hear (like unemployment stats) are often inaccurate when first complied and subject to large revisions later. If people like Peter Schiff can argue that current inflation numbers are phony, I suspect NGDP numbers would also be subject to disbelief by partisans.
4. September 2013 at 08:36
Here you go, Scott. 🙂
http://andolfatto.blogspot.com/2013/09/a-reply-to-sumner.html
4. September 2013 at 09:36
…and, to be certain, CPI targeting, however defined, is nothing like NGDP targeting — monetary policy can independently destabilize RGDP . Total stabilization is the point, and targeting the mix of RGDP and inflation in NGDP is superior to targeting either component.
http://www.nber.org/papers/w4439.pdf?new_window=1
4. September 2013 at 09:50
George Selgin,
Exactly. Arguing against NGDP targeting on the assumption of constant productivity growth skims over the key empirical issues. It’s like arguing for a money supply target on the assumption of constant velocity.
4. September 2013 at 12:36
[…] Scott´s response: […]
4. September 2013 at 16:19
Bill’s point about the deflator is a good one, it seems to me. If you have models that claim NGDPLT is comparable to PLT, presumably they are models where NGDP growth is the sum of RGDP growth and inflation. Is that right? And if so, then the inflation rate that is implicitly used is the GDP deflator, which Bill says has run under target in recent years.
Lots of other good comments, I refer you to my newer post.
4. September 2013 at 18:32
How is NGDLT better than plt? How does it get us out of the liquidfity trap?
4. September 2013 at 23:46
[…] at 3:46 on September 5, 2013 by Mark Thoma Reply to David Andolfatto – TheMoneyIllusion A reply to Sumner – MacroMania Second reply to David Andolfatto – TheMoneyIllusion The […]
4. September 2013 at 23:47
[…] Reply to David Andolfatto – TheMoneyIllusion […]
5. September 2013 at 00:32
@lxdr1f7
MM belive that the liquidy trap is nothing but a theoretical artefact of keynsian models and is not real. Setting expectation and QE are the tools, it does not matter what the intrest rate is.
5. September 2013 at 03:09
nickik
fair enough so how do set expectation?
5. September 2013 at 03:17
W. Peden. You’re a bad man, but I like you. 🙂
Reading Friedman’s famous Presidential address, it is striking how he just fails to take that extra step and apply expectations to money quantity targets in the way he applies to them inflation and unemployment trade-offs.
6. September 2013 at 16:16
[…] figures for the last five years are consistent with weak real growth. (NOTE: I wrote this before Scott Sumner replied, but I think I anticipated most of Scott’s points. These days, I almost never publish a post […]
6. September 2013 at 16:46
lxdr, It allows expectations to move inversely to actual NGDP. So in a deep slump expected future NGDP growth rises sharply (relative to expected inflation.)