

The Quantity Theory at the extremes (#3)
Our initial look at the quantity theory was very positive. Over long periods of time the growth rates of M and P are highly correlated, in a sample that includes high inflation countries. Even better, some of the discrepancy is explained by growth in real GDP. And better still, the coefficient on RGDP growth was approximately negative one. Let’s use an example to think about what that means.
Suppose a country has 40%/year money growth. Your first guess might be 40% inflation. But now you find out that RGDP growth was 5%/year. Now your best guess for inflation is 35%, as RGDP growth seems to reduce inflation roughly one for one. OK, but then why not simplify the model by using NGDP as our scale variable instead of prices? Instead of going:
inflation = money growth – RGDP growth + other stuff
We could have:
NGDP growth = money growth + other stuff
I had Patrick Horan do a simple regression of NGDP growth on money growth, and this is what he got:
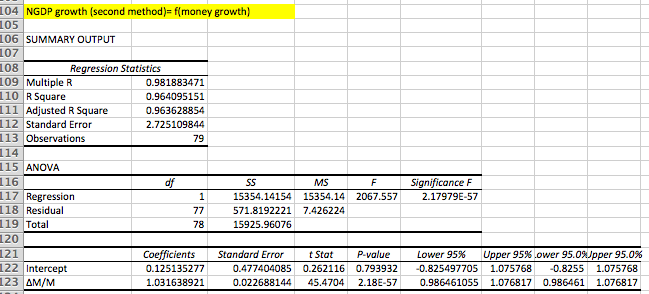
The adjusted R2 is better than for a simple regression of inflation on money growth, and almost exactly the same as when we regressed inflation on both money growth and real GDP growth (in the previous two posts.)
Let’s think a bit more about real money demand:
M/P = f(RGDP, other stuff)
The real GDP factor is obvious. People have more demand for real cash balances as they get richer, and make more purchases. That addresses the benefit of holding cash. But what about the cost? There are several ways of thinking about the opportunity cost of holding cash, such as inflation and nominal interest rates. Inflation is the loss of purchasing power from holding cash and nominal interest rates are the foregone earnings from putting that wealth into an alternative asset. Fortunately, the Fisher Effect suggests these two variables will be highly correlated when inflation is extremely high. So the “other stuff” could be proxied by either the inflation rate, or (better yet in my view) the nominal interest rate.
But real money demand assumes that the price level is the right scale variable. If we shift over to NGDP, we get the following:
M/NGDP = f(i) = Cambridge K
or
NGDP/M = V(i) = Velocity
In the data set of 79 countries (in this post) there were 12 cases where inflation was higher than the money supply growth. In each case, real GDP growth was positive. This meant that in those 12 cases the velocity of circulation grew faster than RGDP over a period of 30 or 40 years. That’s actually pretty impressive, as most countries see considerable RGDP growth over 40 years. If velocity grew even faster, then those 12 cases exhibit a pretty large total increase in V, which is a violation of the simple QTM assumption that velocity is stable.
Let’s suppose our models of money demand are correct. What would it take for velocity to increase sharply? The demand for money would have to decline sharply. And that is mostly likely to be caused by a big increase in the opportunity cost of holding money. So you’d expect to see a big rise in V in countries where the inflation rate/nominal interest rate increased very sharply. Unfortunately the table doesn’t show the change in the inflation rate, just the average level. But think about it, if the inflation rate rose very dramatically over that period, isn’t it likely that the average inflation rate would be rather high? Not certain, but fairly likely. You normally won’t see the inflation rate increase by 20% or 40% in countries like Switzerland and Germany, where the average rate of inflation was only about 3%.
The preceding view of money demand suggests that there should only be a few countries where inflation exceeded average money growth over 30 or 40 years, and that most of those cases would be countries where the average inflation rate is quite high. And that’s exactly what we observe. There are only 12 such countries out of 79, and yet they comprise 8 of the top 14 inflation rates.
So now we have our complete money supply model:
M/P = f(RGDP, i)
and delta M/P = delta Y – V(i)
Or to make the model even simpler:
NGDP/M = V(i)
And:
delta NGDP = delta M + delta V(i)
Nominal GDP growth depends on two factors, money base growth plus the change in velocity. And velocity is a function of the nominal interest rate.
This means that when the inflation rate rises very sharply, inflation will often be even higher than the money growth rate. But that’s not really a big problem for the quantity theory of money. No one gets too upset if Argentina has 73% money growth and 76% inflation. The problems come in the other directions, and for two reasons:
1. When inflation slows, money growth is often higher than inflation, and sometimes even higher than before inflation slowed, for a brief period when there is a one-time adjustment in real cash balances. That looks bad for the QTM. This occurred briefly in the early 1980s, when inflation slowed from 13% to 4%, and the public then chose to hold larger real cash balances (and velocity fell.) At low rates of inflation these discrepancy stand out more, and tend to discredit the entire QTM approach.
2. This problem becomes especially severe at near zero interest rates. Recall that base money is the world’s most liquid asset. It has some really appealing qualities. When interest rates fall to zero you are reducing the opportunity cost of holding this desirable asset all the way to zero. So there can be enormous increases in base money demand. This problem can also occur if the central bank foolishly chooses to pay market interest rates on bank reserves.
To summarize, at the zero bound the demand for base money can soar, and the money supply growth rate can vastly exceed the inflation and NGDP growth rates. This is where the QTM looks worst.
But even in this case, money is what drives inflation and NGDP. If the liquidity trap lasts forever then bonds become money, and the money supply gets redefined to include bonds. In the far more realistic case where the liquidity trap is expected to be temporary, long term rate stay above zero, and permanent monetary injections still boost the price level and NGDP according to the QTM.
So far I’ve focused on exogenous changes in the money supply, which is the model that works best for the high inflation cases. The next post will examine monetary regimes like Bretton Woods and the Taylor rule, where the money supply is endogenous. We will see that the correlation between money and prices greatly weakens, despite the fact that changes in the money supply still cause in one for one changes in P and NGDP.
Tags:
12. August 2015 at 18:33
Why would should the interest rate ever be lowered to the zero bound in the first place, then, rather than always going for permanent money injections (preferably surprises, I guess)? Are interest rates just a terrible policy tool?
12. August 2015 at 18:52
This confusing post reminds me of the math trick where you ask a person to add, subtract, multiply and/or divide a ‘secret’ number known only to them, and in the end you can guess what the number is. That is, the entire post is nothing but trickery.
But the takeaways here are the tiny sentences that belie Captain Sumner’s claim that all is well in the ship called HMS Monetarism Titanic. Such as: “velocity grew even faster, then those 12 cases exhibit a pretty large total increase in V, which is a violation of the simple QTM assumption that velocity is stable” – yes, indeed. And: “To summarize, at the zero bound the demand for base money can soar, and the money supply growth rate can vastly exceed the inflation and NGDP growth rates. This is where the QTM looks worst.” – I am impressed that Sumner put the last sentence in “QTM looks worst”. If it was his apt pupil Sadowski, this sentence would have been dropped.
12. August 2015 at 19:13
“from a practical point of view, it would be one of the worst things which would befall us if the general public should ever
again cease to believe in the elementary propositions of the quantity theory.”
Scott, in the spirit of this quote from Prices and Production, I must say that why I don’t particularly care for the analytical approach this post series has taken, I believe they are providing a valuable service nonetheless, not least because evidently, judging from many of your own commenters, one of the worst things which could befall us, if it hasn’t happened, is perhaps dangerously close to happening.
13. August 2015 at 01:08
If V is stable for a given growth rate of the monetary base why do we need NGDP level targeting? Why not just make the base grow by x% each year?
13. August 2015 at 02:32
I must say, I am really enjoying these posts. Very lucidly argued, though I have reservations on certain points, which if I get the time to articulate them, I will post.
13. August 2015 at 02:38
” When inflation slows, money growth is often higher than inflation, and sometimes even higher than before inflation slowed, for a brief period when there is a one-time adjustment in real cash balances. That looks bad for the QTM.”
I don´t think it does. In fact, it´s an implication of the theory. Take my chart on inflation and Base/NGDP in Brazil here: https://thefaintofheart.wordpress.com/2013/03/26/scotts-quiz-illustrated/
When inflation quickly dropped from 50% month to “nothing”, money demand soared. Monetary equilibrium requires that Ms increase to offset the fall in velocity.
13. August 2015 at 03:35
This post reminds me of my early days working on LA development when people still thought that inflation was caused by greedy labor unions, fiscal deficits, gasoline taxes, and exchange rate devaluations, pretty much the same cast of characters today’s inflation hawks finger. Ah the joy of finding a significant negative coefficient when regressing real money balances on inflation! When it seemed that the beginning and the end of macroeconomics was the Friedman rule.
Even then, however, we did not believe that inflation was bad per se, but because it led people to economize unnecessarily on something it was costly to produce, money, and because it made it harder to write long-term contracts; without computers, floating interest rates and inflation adjusted contracts are not easy. And we knew what even today is not know widely, that only real, not nominal capital gains should be taxed. Exchange rate should be flexible; the IMF with its resistance to devaluation and adjustable exchange rates was our bête noire.
The idea that a monetary authority would ever allow a persistent lack of nominal demand depress real growth never entered our minds, allowing us to be super classical. Only policy caused distortions in relative prices (interest rate ceilings, directed credit, and import restrictions were the worst) and shortages of domestic and foreign saving for investment and could hold back real growth.
As Samuelson said, quoting Wordsworth, “Bliss was it in that dawn to be alive, but to be young was very heaven!”
13. August 2015 at 03:43
I’m looking forward to the next post which I hope will take up what (supposedly) went wrong when monetary targeting was (supposedly) tried in the US and the UK. If it was not “unacceptable” interest rate volatility, what was it.
BTW, glad to have your opinion on the Fed paying interest on reserves. I think that has been a vastly under-commented and discussed policy instrument.
13. August 2015 at 04:03
Scott,
“When interest rates fall to zero you are reducing the opportunity cost of holding this desirable asset all the way to zero. So there can be enormous increases in base money demand. This problem can also occur if the central bank foolishly chooses to pay market interest rates on bank reserves.”
When Fed starts ‘tightening’ it will start raising the interest it pays on reserves. So this increase in the IOR rate will be accompanied by a fall in base money demand, which seems to contradict what you are saying above.
13. August 2015 at 04:27
“So this increase in the IOR rate will be accompanied by a fall in base money demand”
No, raising interest rates on reserves reduces the opportunity cost of holding base money.
13. August 2015 at 05:15
Michael, You asked:
“Are interest rates just a terrible policy tool?”
Yes.
Andrew, In the end, the lesson of this series will be that we need to take the quantity theory very, very seriously.
Peter, That’s a big “if”, as V is not always stable.
Marcus, Yes, I should have said it looks bad for the simplistic version of the QTM, but not the more sophisticated version.
Thomas, Of course Friedman also knew that the coefficient on inflation was negative.
Philippe. You are confusing two concepts. A higher IOR increases the demand for base money, and is contractionary. A higher market interest rate decreases the demand for base money, and is expansionary.
What matters is the gap between market rates and IOR.
13. August 2015 at 05:27
Ok.
13. August 2015 at 05:41
I take QTM seriously. Print more money.
13. August 2015 at 06:06
Peter,
One could alter that statement and arrive at an important truth: GIVEN V is not stable, why not target NGDP and achieve the optimal possible outcome of a base money growth target?
13. August 2015 at 10:30
I go on vacation, and Sumner takes a math class. hmmm…
13. August 2015 at 11:01
[…] Source […]