

The economy is racing ahead at 2%
(I’m not being sarcastic.)
Many people (actually almost everyone) have trouble interpreting growth data. There’s a tendency to conflate the normal rate of growth in an expansion with the long run trend rate of growth in RGDP. Actually, the trend rate of growth in RGDP is measured over the entire cycle, including both expansions and recessions.
The real growth rate in the US over the past 10 years has averaged slightly above 2%. A few years ago I predicted that it would have slowed to less than 2% by now. I was wrong. Today’s data shows that growth continues right at 2% over the past 12 months.
But I was not wrong because productivity has grown faster than I expected; I was wrong because the economy continues to expand at a rate well above its underlying trend rate of growth. (Here we should cut the Fed a bit of slack, as they made the same sort of error that I made.)
In an accounting sense, the strong 2% growth rate has been produced by slow productivity growth combined with a rising employment-population ratio:
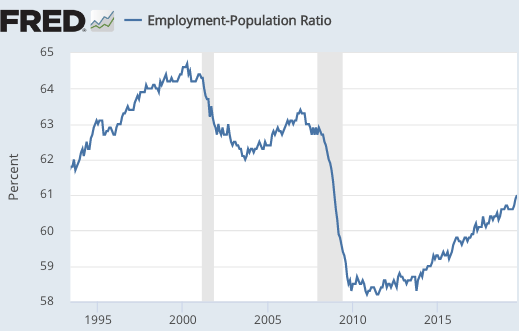
You might think that this graph shows that the employment population ratio remains sharply depressed. Not so, adjusting for demographic changes it is near the 2000 peak. As baby boomers retire, you’d expect to see a decline in the ratio, as only about 24% of healthy people over 65 are still working (and even fewer disabled people). The ratio is modestly below peak for ages 25-54, and well above peak for 55-64 and over 65.
Take a look at the employment ratio for the 55-64 age group:
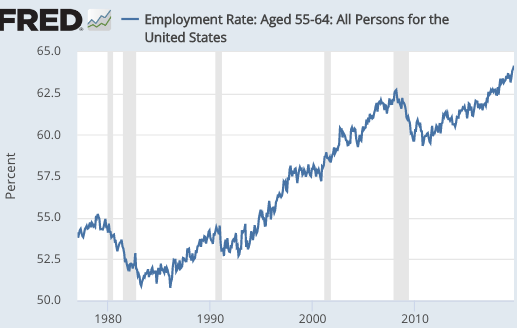
Notice that this ratio is now 64.2%, far above the 58% ratio at the peak of the 2000 tech boom. The over 65 ratio is also rising briskly. (Think about all those old codgers working for Uber.)
This is what I got wrong. I thought that growth would slow to 1.5% by now, because I didn’t expect so many old people like me to be working. Indeed, 5 years ago I fully expected to be retired by now—-so I didn’t even correctly forecast my own labor force participation rate at age 64! (Actually, I would be retired if my Mercatus opportunity had not come along.) Old boomers are harder working than previous generations (albeit in much softer jobs.)
Can this surge in labor force participation continue for some time? Yes, I’m duly chastened by my inaccurate forecasts of 5 years ago. But here’s what I do know, the labor force participation rate cannot go above 100%. We’ll need more immigration at some point if we want to maintain 2% RGDP growth—a lot more.
Here’s the most important point I’d like to make. The trend rate of growth is the growth rate that occurs when the age-adjusted employment-population ratio is stable. Because this ratio has recently been rising briskly, even faster than the aggregate data show due to composition effects, we are now growing at well above the economy’s long run trend rate of growth.
That’s right, the recent 2% RGDP growth derided in the media as “weak” is actually very strong, reflective of an unsustainable boom. It might last for several more years, but it’s ultimately unsustainable. The Great Stagnation continues.
PS. I rarely agree with the Germans on monetary policy, but this is an exception:
The head of Germany’s central bank has said he opposes using monetary policy to tackle climate change, setting up a potential clash with Christine Lagarde, who plans to explore the idea after she becomes European Central Bank president on Friday.
Tags:
30. October 2019 at 10:02
Yea, if the boomers could retire already so that some of us younger people could move up into management that would be great…
Stop hoarding the opportunities boomers!
30. October 2019 at 10:06
I’m going to actually reply to my own comment, yea I know. It got me thinking however that if the proportion of management level jobs are staying with one group of people for proportionately longer, this would have downstream economic effects on Xers and more likely Millennials. We hear about home purchases and families being delayed, perhaps a large component to this is that Millennials have to wait longer than previous generations to move up due to the longer life expectancy, and later retirement, of the older generation.
Drawing this out. Let’s say that my generation works 5-10 years longer than boomer generation. Well, there is a cap on how high ANYONE can rise within a company(CEO), meaning that there is a topline of advancement. Later retirement is basically going to cause an inclining bottleneck toward the top as people live longer and work longer. Maybe the economic divide in the future will be more about age rather than class?
30. October 2019 at 10:06
Scott: Why has growth been so slow? I get the immigration and the labor force points that you made, and we probably need more labor force growth.
But I would believe an aging workforce would have been counteracted by the economic spillover effects of a fast growing Asia and Africa, and the dramatic cost reduction in many inputs of production caused by global trade.
Perhaps not 3% growth, but maybe something from 2.5%-3% growth. Yet, we have grown only around 2% growth, and other developed countries like Japan and Germany have done even worse.
I really think the supply side picture in America has dramatically deteriorated in the last 40 years. Especially manufacturing, which we used to be a global leader, being suprassed in sophication by countries like Germany and volume by countries like China.
30. October 2019 at 10:41
Scott, re the bundesbank. I fear this is a case of a stopped clock being right twice a day. By their protestations they also appear to disapprove of monetary policy being used to tackle low inflation. i am not sure if they approve of monetary policy being used to do anything.
30. October 2019 at 11:00
John, Productivity growth and labor force growth have both been slowing.
30. October 2019 at 11:43
Scott,
There is nothing about latter 90s that makes me think the economy was running at full-potential over that period, relative boom nothwithstanding. Yes, RGDP growth was above the long-term trend, but why should we trust the long-term trend RGDP growth to be indicative of RGDP potential? Look at all the mismanagement by the Fed, particuarly on the tight money side since the Volcker regime change. I think the fact that the unemployment rate never reached the low level it has recently is telling.
So, obviously, there’s no reason to think the epop ratio is a particularly good indicator concerning potential RGDP growth or NAIRU.
So, does the current rather historically low rate of unemployment tell us anything about NAIRU or potential growth? Maybe, but even if the rate of additional employment is slowing down, with wages rising faster, it can merely mean we’re closer to potential than we were before these rate changes. It doesn’t mean we’re at potential yet.
As I predicted 3 years ago, unemployment will continue to go down, and to the degree the Fed allows it, RGDP growth will be higher than most expect. I think potential RGDP is around 3.5%, and there’s still opportunity for even higher temporary catchup rates.
While I’m at it, I’d like to address your observation that productivity growth began its decline in 2004. This is certainly a fact, but not necessarily relevant to this discussion. That’s because, it appears there was a supply shock that began around the same time, particularly with oil. There’s a rather noticeable negative covariation between oil prices and productivity.
I think productivity growth could be a good bit higher, and if the Fed would give it a run way, we’d see it.
It’s unfortunate that we may never find out if I’m right, as the Fed seems hopelessly behind the curve with its inflation targeting regime.
30. October 2019 at 12:14
Measuring trend real GDP growth just seems fraught with danger to me…
There are two big trends in the post-war data: 1) the baby boomers entering the labor force from the late 1970s through the 1980s, 2) the increase in the share of women in the labor force in the first half of the sample. It’s not just about age…
And what about NGDP growth? It slowed to 3.5% QoQ annualized and 3.7% YoY, hardly “racing ahead”. On a YoY basis, it has slowed for five straight quarters from a peak of nearly 6% in Q2 2018.
30. October 2019 at 13:35
Scott: I saw this interesting article on markets and competition and prices about US vs Europe in those fields. The argument is that EU regulations made markets in Europe more competitive and dragged prices down in areas like Air Fares, Internet access, and cellphone plans.
https://www.theatlantic.com/ideas/archive/2019/10/europe-not-america-home-free-market/600859/
What do you think?
30. October 2019 at 15:03
Mike, You have missed the point. A rising employment/population ratio means we are growing above trend regardless of where the natural rate is.
Monetary policy doesn’t affect long run productivity growth.
John Hall. Yes, of course. Trend rates of growth change over time, but that has no impact on anything I said.
And yes, NGDP growth has been slowing, exactly as I predicted. The previous rates were completely unsustainable.
John, I agree about the EU.
30. October 2019 at 15:49
Many jobs are physically easy, so we might expect the increase in labor force participation rates among seniors to continue to rise.
It is an interesting question whether seniors are working as they want to, or because they have to.
There was once a day when women withdrew from the labor force when they got a husband and “didn’t have to work anymore,” and old people retired.
Well, times change.
What is puzzling is the relatively low productivity increase rates seen even within the manufacturing sector.
30. October 2019 at 22:11
Scott,
What are you calling long run productivity growth? You argued that money was too tight for years after the Great Recession, and were correct in my view. I’m arguing that money is still too tight, roughly a few years longer than you thought it was too tight.
My perspective predicted an eventual unemployment rate considerably lower than even most market monetarists were predicting. Empirically, my perspective wins in that sense, but doesn’t mean it’s correct. It may just be coincidence.
I think you’ve fallen victim to the mindset that seems so common after recessions, particularly long and deep ones. That is the secular stagnation mindset.
And for sure, there are drags on growth like demographic changes, but that doesn’t mean there can’t be somewhat offsetting factors.
I think real GDP potential is likely lower than it was 20 years ago, but higher than most believe. I also think RGDP potential was higher than realized 20 years ago. I don’t have reason to believe that even the milder secular stagnation that I believe is occurring will last as long as most think.
We’re slowly, gradually entering an era that will allow for increasing productivity growth at increasing rates. This will not occur as quickly as hype suggests, but will occur nonetheless. To paraphrase Larry Summers, such changes often take longer to noticeably begin than expected, but then occur at a rate that’s literally shocking.
We are slowly entering the era of cognitive processing rate-per-capita increases.
31. October 2019 at 06:23
Scott:
This is nonsense. RGDP growth is being held down by low NGDP growth, which is being suppressed by tight money by the Fed. The GDP yield from produced assets has been essentially constant for the past 60+ years. The growth of produced assets is being held down by slow NGDP growth. No matter how low the corporate tax rate, companies won’t invest more if they can’t sell what they can produce with their existing capital.
The CRB Index, which is a “good enough” indicator of the real value of the dollar, is at 177 right now, far below its 10-year average of 246. If the Fed were to bring the CRB Index up to 246, NGDP growth would surge. RGDP growth would top 4% for a time, and investment would rise enough to sustain long-term RGDP growth of more than 3%.
Over the past 4 quarters, NGDP growth has averaged only 3.74%, with RGDP at 2.03%. Why would an NGDPLT’er like you think that 2% RGDP growth was “above trend” when NGDP growth is this low?
31. October 2019 at 06:34
Scott,
Unless I’m actually missing your point, my point is that sustainable growth could be higher still. That’s the real tragedy here. In my view, were still in a depression, using Krugman’s definition from several years ago.
31. October 2019 at 07:55
Good post, but I still think we can manage 2% growth under current immigration levels. Side note- real median compensation (according to Social Security) increased 9.1% between 2012 and 2018, while real average compensation rose just 7.6%. So, one cheer for the little guy. Increased immigration would push in the other direction I think.
Still, yes, while the codgers are flexible and unpredictable, increased presence in the workforce is not a surprise at all. Recall that in 1999, when the oldest boomers were 53, we were all gonna retire at 55. Those plans got derailed, Boomers pushed the Sisyphean rock up the hill, then 2008 hit. As an older GenXer myself, I can report that virtually everyone in my (middle, middle, middle class) milieu NEEDS to work to 65 or 70 except for the guy who didn’t go to college and got a maintenance job with the village with a pension.
31. October 2019 at 08:10
Mike, It’s possible that sustainable growth might be higher than I estimate, but not for the reasons you present. The fact that unemployment has fallen further than I expected has no bearing on this question. Changes in unemployment have no bearing on trend growth. The problem is productivity and population growth.
As for secular stagnation, productivity growth was very high during the 1930s. Thus slowdown in productivity growth is not typical of the aftermath of a major recession. I don’t “believe in” secular stagnation, I SEE IT
Louis, You asked:
“Why would an NGDPLT’er like you think that 2% RGDP growth was “above trend” when NGDP growth is this low?”
NGDP growth can’t be holding down RGDP growth to below trend because the employment population ratio is rising. The way that NGDP affects RGDP is via the labor market. Productivity growth during the Great Depression was quite strong. Have you checked NGDP growth during the Depression?
This has been my view from the very first day I started blogging. Lots of readers seem to now think that I believed that more NGDP could miraculously raise RGDP growth without boosting employment. I’ve always adhered to the “natural rate” model. NGDP affects the labor market, and supply side factors determine productivity. If you want faster growth then you need supply side reforms like more immigration and freer trade. I don’t see that in DC right now.
31. October 2019 at 17:38
Dominic,
Your model is that boomers are sitting in their high-paying jobs, and not making room for the next generation to move up.
There is a flaw in your logic. New companies are created every day. And most of the fastest growing are young companies. Some of these have quickly become some of the largest companies in America. Amazon, Facebook, etc. are all less than 20 years old.
If you want to be CEO, then you should be looking to start something new rather than working your way to the top of some old-timey blue-chip
31. October 2019 at 22:48
Scott, if official inflation measures are exaggerating actual inflation (whatever that mean), then rgdp would be higher than measured and thus productivity growth would be higher than what it seems like?
1. November 2019 at 02:02
Does the state of the labor market impact the propensity of businesses to substitute machines for workers?
1. November 2019 at 05:27
Scott,
Ever consider possibility that producers will substitute capital for labor if the labor supply tightens?
1. November 2019 at 11:34
Matthias, Yes. RGDP is highly subjective.
Burgos and dtoh, Answered after my next post.
2. November 2019 at 01:07
Scott,
Yes, there is some secular stagnation, due to demographic factors as I indicated above, but I think tight money is more important. Here’s another way to express my view, at the risk of appealing to crude monetarism:
https://fred.stlouisfed.org/graph/?g=poSP
As you can see from the graph, change in MZM velocity pretty reliably negatively covaries with changes in unemployment. What do you notice about velocity since the Great Recession? We’ve had the longest period of negative growth in velocity since 1960, before which the data isn’t available. Coincidence?
And in the months leading up to the Trump election, until the trade war really began to bite and money tightened some more, we finally saw velocity falling at a slower rate, and eventually even beginning to rise a bit. This was, I think, associated with the economy getting closer to full employment, but still being perhaps .5-1.5% away or so. We started to see hints of a more rapid rise in inflation that corresponds to the accelerating slope of the SRAS curve, nearing the vertical AS curve.
Regarding your claim about the relationship between monetary policy and productivity, I think this evidence is very suggestive that I may be onto something:
https://fred.stlouisfed.org/graph/?g=poT9
You can expand the time frame, and the relationships hold. There’s obvious significant positive covariation between MZM velcity and these measures of productivity.
3. November 2019 at 14:42
Here’s a thought: mortgages (housing debt) and college education (student debt) are encouraging higher labour force participation in some groups while family law (particularly child support debt) is encouraging lower labour force participation in other groups.
Hence higher education folk working longer, lower education/income males working less.
Not the only thing that is happening, but might be part of what is happening.
3. November 2019 at 20:32
Mike,
You found the smoking gun! Seems like a lot of us felt like this was a monetary policy problem and you made a very convincing case. Well done.
4. November 2019 at 01:13
[…] Original Post […]
4. November 2019 at 02:55
Scott Freelander,
Thanks. If you’re not careful, people will think we know each other. 😉
4. November 2019 at 03:12
Scott,
I think money’s been too tight since about 1995. Yes, the tech boom should have been bigger, and longer lasting. In fact, perhaps it should have merely slowed, and never should have crashed.
I’d suspected this for a while, but the evidence I’ve recently found offers the first unambiguous evidence for this perspective that Ive seen.
https://fred.stlouisfed.org/graph/?g=ppyp
Notice, that when EPOP and MZM velocity are indexed, it makes it clearer that economic growth started to slow in 1995 as velocity started to fall. And expectations for weaker growth going forward began to be reflected in falling long-term rates and inversions in the yield curve.
https://www.treasury.gov/resource-center/data-chart-center/interest-rates/Pages/TextView.aspx?data=yieldYear&year=1995
So, the EPOP should have gone a little higher than it did in the late 90s, continuing into the 2000s. And, tight money has kept the EPOP particuarly depressed since.
And the magnitude of the apparent effects of falling velocity on GDP growth, interest rates, and employment are roughly what one would expect if the neutral interest rate should roughly equal expected NGDP growth at monetary equilibrium, in an economy without debt that is otherwise driving nominal interest rates up.
4. November 2019 at 06:56
I’ll add here that the idea that nominal and real rates are not good indicators of the stance of monetary policy substantially begins to fall apart upon close examination.
r*=~Y growth aside, it’s pretty unambiguous, for example, that when the FFR is above short-term nominal rates, the Fed intends to tighten. Further, the behavior of long-term nominal rates provides pretty reliable clues about the effectiveness of the effort to tighten, sans something like Operation Twist that puts a relatively greater emphasis on bringing down long rates.
True, nominal rates over the very short-term can be too volatile to be useful, but over months?
Further, if you believe an increased flow of savings from the developing world should lower r*, ceteris paribus, why shouldn’t that boost US investment? Shouldn’t accommodative policy keep r* constant, on average, allowing for a boost to real GDP and real GDP potential?
The idea that negative real rates, particularly over long periods of time and over much of the yield curve, don’t indicate money is tight make me scratch my head. And this is especially true when the Fed is roughly achieving it’s long-term inflation target. Negative real rates result when expected inflation exceeds the real rate. Why should an economy expected to grow have negative real interest rates for an extended time if it is somewhat close to monetary equilibrium?
4. November 2019 at 11:05
Michael, I don’t understand what those correlations are supposed to show. Are you claiming causation?
4. November 2019 at 15:30
Scott,
I don’t completely assume causation, as I want to be open minded. But, my impression is, from a monetarist perspective, causation goes from low velocity due to money demand taking a bite out of aggregate demand.
There is the clear negative correlation between changes in MZM velocity and unemployment. There is also the weaker positive correlation between MZM velocity and productivity. Yes, productivity very briefly spikes early in recessions, but I suspect that’s just an artifact. I’m guessing hours are cut more quickly than measured output, briefly.
Then, you have the indexed broad EPOP ratio versus indexed MZM velocity, and EPOP starts to rise more slowly in 1995 just as MZM velocity starts to sink at a faster rate. Then, outright decline begins with the 2001 recession. Coincidence, or do I have the causal relationships wrong?
Then, let’s look at the timing of the drop in productivity growth. There was a large drop in productivity growth that persists in many advanced economies, often abruptly beginning during the Great Recession. In the US, productivity growth began a decline in 2004 that worsened, started with the Great Recession. Most of the cause of the ’04 decline may have been an ongoing supply shock, however, especially regarding oil. And there does seem to be negative covariation regarding oil prices and productivity.
Previously, all the evidence I saw that seemed to indicate there might be tight money could also have been interpreted as being due to secular stagnation., or other possible causes. There was a alot of ambiguity. However, falling money velocity doesn’t seem so ambiguous.
To be clear about what I think is likely happening fundamentally, the money supply has since 1995, but not so has money demand, leading to a net fall in velocity.
4. November 2019 at 15:32
That is, the money supply has grown since 1995, but so has money demand, leading to a net fall in velocity.
5. November 2019 at 09:01
Scott,
If this Fed paper is right, it’s also consistent with my hypotheses, including that r* = NGDP growth expectations in monetary equilibrium.
https://www.wsj.com/articles/timiraoss-take-research-suggests-neutral-rate-may-be-even-lower-than-thought-11572951868
8. November 2019 at 09:37
Michael, For some reason I can’t access that article, even though I have a WSJ subscription.
9. November 2019 at 12:39
Scott,
Yes, that article requires a $2000 annual subscription to their special reporting on the Fed. I didn’t catch that at first, either.
I keep checking to see if the paper will be listed on the author’s Fed page:
https://www.federalreserve.gov/econres/michael-t-kiley.htm
Maybe I should email him.
He estimates that r* is somewhere just below zero, if I recall correctly, according to an economist on Twitter. I recall it being within about 25 basis points from an estimate based on the notion that r* = NGDP growth in the expectations, monetary equilibrium.