Confusing “history” with numbers

It turns out “Canucks Anonymous” is Adam P.  Here he discusses the 1974 recession:

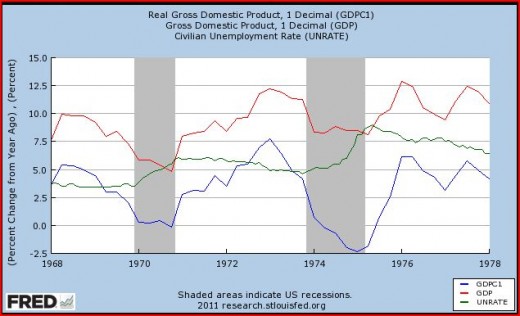
Below is a time series plot of real GDP growth, nominal GDP growth and the unemployment rate during the 1970s.  On the eve of the supply shock NGDP growth is running about 10%, real GDP growth is running around 5% and unemployment is about 5%.  Now, 10% NGDP growth is a higher level than you’d typically choose to target but the important thing to notice is that in the preceding 4 years or so the unemployment rate is extremely stable right around 5%, inflation is also very stable as both real GDP growth and NGDP growth are accelerating virtually in parallel.  It certainly looks like an economy in equilibrium.

Now, when the shock hits real GDP growth of course plummets as is required for the episode to warrant the name “supply shock”, but look at NGDP growth, it is remarkably stable!  This is exactly the response of monetary policy and NGDP growth that the market monetarists want, this is supposed to prevent unemployment from rising but if fails miserably!  Unemployment rises sharply and remains elevated for several years.

Furthermore, as we all know there was subsequently an acceleration in inflation that got somewhat out of hand, you might even say an inflation overshoot perhaps?

This is an amazingly pure test case, NGDP did exactly as the market monetarists would want and the whole thing is a total failure.  Monetary policy does not appeared to have fixed the situation.

I was somewhat in a state of shock after reading the preceding.  It would be difficult to find a worse test of market monetarism in all of American history.  Remember, we favor a stable 5% NGDP growth rate.  Let’s examine all the flaws in Adam’s analysis:

1.  NGDP growth rises sharply in the early 1970s, from barely over 5% to a peak of 12.5% in 1973.  Then it falls to about 8% in the recession.  Also recall that market monetarism is a natural rate model.  That means even if NGDP growth had remained at 12.5% in 1974, and even if there had been no oil shock, we still would have expected a recession.  The preceding demand-side growth certainly pushed unemployment below the natural rate, and hence a relapse was inevitable in 1974.

2.  Now add on the fact that NGDP growth slowed by 450 basis points in 1974.  If the decline had started from a 5% baseline, that would be like a decline to 0.5%.

3.  Now add on the fact that there was a severe real shock to the economy, in the form of a dramatic reduction in OPEC oil production.  Also recall that our economy was much more oil intensive back then.  The easiest way to consider this case is to assume the AD curve is a hyperbola.  Then if aggregate supply shifts left, we’ll have a recession, even with NGDP targeting.

4.  Even worse, the data from this period was completely distorted by price controls.  Economy-wide price controls were installed in 1971, and gradually phased out in 1973 and 1974.  So the inflation and NGDP data for 1974 was biased upward by the removal of price controls.  Money may well have been even tighter than it looked.

5.  It’s also widely acknowledged that the natural rate of unemployment rose sharply during the 1970s—market monetarist policies have no control over that variable.

But even if you ignore price controls, and ignore the oil shock, and ignore the rise in the natural rate of unemployment, the recession of 1974 is roughly what a market monetarist would expect if the Fed revved up NGDP to get Nixon re-elected, and then slammed on the brakes in 1974.

To add insult to injury, Adam suggests that market monetarism is somehow to blame for the inflation overshoot of the late 1970s.  Recall that NGDP grew at an 11% rate from 1972 to 1981.  We recommend a 5% rate.  Those extra six percentage points pushed inflation from 2% to 8%.  There’s no mystery here, inflation rose because the Fed was ignoring the advice of market monetarists, and regular monetarists as well.

An amazing pure test case?  I don’t think so.  But if it was, market monetarism passed with flying colors.  In my view it would be much more interesting to look at a period where NGDP growth was highly stable.  Marcus Nunes had some great posts showing that when NGDP growth got more stable, so did RGDP growth.

Adam continues:

To conclude lets take a look at another historical episode.  The following plot shows NGDP growth, real GDP growth, inflation and unemployment from 1957 to 1967 in the US.  Inflation is extremely stable while real output growth varies a lot and thus NGDP growth is very volatile as well (both inflation and NGDP are included because the inflation series is ex food and energy).

Why would someone choose 1957-67?  That’s the tail end of the Eisenhower/Kennedy low inflation period, and the first three years of the easy money policy that led to the Great Inflation?  In addition, when NGDP growth slowed sharply (1957 and 1960) so did RGDP.  So what’s that supposed to show?

Then one final shot at yours truly:

Unemployment stays stable around 5% the whole time.  So, which outcome do you prefer?

Actually no.  Unemployment rises to about 7% in the two recessions (when NGDP growth slowed sharply) and fell below the natural rate in 1966, as NGDP growth was excessively fast.

Scott Sumner says “I make no apologies for ignoring these little toy models, and having my policy analysis incorporate a complex mixture of politics, macroeconomic history, well-established basic economic principles, and logic.”

I pointed out here that “well-established basic economic principles” shouldn’t really be on that list, can we strike “macroeconomic history” as well.

If you are going to trash me for not knowing any “macroeconomic history” (history I lived through) you might want to read up and find out what actually happened to the US economy during the period you are discussing.  History is more than numbers.

I don’t want to be too negative here.  Adam did provide a useful public service.  He showed that when NGDP growth slows sharply we usually get recessions.

The myth of Volcker’s 1979 assault on inflation

Commenter Russ Anderson pointed me toward a Fed publication that discusses the Volcker disinflation:

Twenty-five years ago, on October 6, 1979, the Federal Reserve adopted new policy procedures that led to skyrocketing interest rates and two back-to-back recessions but that also broke the back of inflation and ushered in the environment of low inflation and general economic stability the United States has enjoyed for nearly two decades.

This may be technically accurate, but it’s highly misleading.  It creates the impression that Fed policy became contractionary in 1979 and that this gradually broke the back of inflation.  But this simply isn’t so; monetary policy during 1979-81 was highly expansionary, as evidenced by rapid inflation and NGDP growth.  The Fed only because serious about inflation in mid-1981, when it raised real interest rates sharply.  This immediately broke the back of inflation.  So much for long and variable lags.

The picture is complicated by two factors that seem to support the official narrative:

1.  Monetary policy was briefly tightened in late 1979 and early 1980.

2.  There was a brief recession in early 1980.

Both of those facts are true, but highly misleading.  The tight money of late 1979 was not really all that tight, and it lasted very briefly.  By late-1980 monetary policy was highly expansionary, indeed perhaps the most expansionary in my lifetime.  Only in mid-1981 did the Fed seriously commit to tight money.

The recession of early 1980 was the shortest and mildest recession of the post-war era.  And it occurred against a backdrop of deindustrialization in the rust belt, and punishingly high taxes (MTRs) on capital.  The unemployment rate rose to a peak of 7.8%, but it was nearly 6% during the 1979 boom, evidence that President Carter’s bad supply-side policies were hurting the economy.  In addition to high tax rates, we had energy price controls.

Although the recession officially began in January 1980, RGDP actually rose in the first quarter.  As late as March 1980 few expected a recession, the economy seemed to be in an inflationary boom.  Yes, the Fed raised the discount rate from 12% to 13% in mid-February, but about the same time the January CPI numbers came in at an 18% annual rate.  Gold peaked at $850 in January.  Thus in mid-March Carter put credit controls into effect to try to slow the economy and this pushed RGDP down at a 8.4% rate in the second quarter.  Soon it became clear we were in recession, and the controls were quickly phased out.  The recession was over by July, and housing and auto production recovered quickly.  Nevertheless, during the ensuing recovery unemployment leveled off in the 7% to 7.5% range, despite ultra-easy money.

I’m probably the only person who’s ever called monetary policy during 1980-81 “ultra-easy.”  This is right smack dab in the middle of the infamous Monetarist Experiment of 1979-82, the one that “broke the back of inflation.”  But facts are stubborn things.

In mid-1980 the Fed panicked at rising unemployment, and cut interest rates back into the single digits, despite 13% CPI inflation during 1980.  The result was predictable.  NGDP started recovering briskly in the third quarter.  But it was the next two quarters that were truly astounding; during 1980:4 and 1981:1, NGDP grew at an annual rate of:

.

.

.

.

.

That, my folks, is easy money.  I can’t even recall a faster rate over six months, although I don’t doubt there were some.  Think about how NGDP was “recovering” at just over 4% during 2010, and how the Fed huffed and puffed and pushed NGDP growth up to . . . 3.4% so far this year.

Yet this hyper-charged growth in AD did not significantly reduce unemployment.  Believe it or not, 7% was probably the natural unemployment rate by 1981.  It is not true that tight money cost Jimmy Carter the election.  His poor supply-side policies combined with his neglect of inflation produced a high misery index on election day.  That would have happened with or without Volcker.

In 1981 Reagan took over and supported Volcker’s fight against inflation.  By mid-1981 the Fed got serious, and real interest rates began rising sharply.  NGDP growth plunged into the low single digits.  During the recovery Volcker did allow relatively rapid NGDP growth, but not enough to re-ignite inflation.  Once RGDP growth leveled off, NGDP growth also slowed.  The recovery was also helped by Reagan’s good supply-side policies, such as much lower MTRs, energy price decontrol, and a tough stance toward public sector unions.  For the first time in my entire life the US began growing faster than most other industrialized countries.

So the 1979 assault on inflation is mostly myth.  It was just a blip in the ongoing Great Inflation, which didn’t peak until early 1981, when NGDP growth peaked.  Only in mid-1981 did the Fed get serious about inflation, and the results were almost instantaneous.  CPI inflation during Sept 1980- Sept. 1981 was 11%, over the following 12 months it plunged to less than 5%.  NGDP growth from 1981:3 to 1982:4 was at only a 3.4% annual rate.  Why did almost everyone get it wrong?  Because almost everyone believes in long and variable lags.  And many people focus on nominal interest rates.  And because it makes a good story.

PS.  You might ask if monetary stimulus today might lead to disappointing results, just like in 1980-81.  The answer is no, for reasons I’ll explain in the next post.

The things we teach that aren’t true

One could write an entire book discussing all the assertions in economics textbooks that are not true.  I seem to recall that Coase complained that economics textbooks kept using lighthouses as an example of goods that can only be supplied by the government, even after it was shown that private organizations had supplied lighthouses.

I don’t know whether textbooks claim that supply shocks help explain the high inflation of the 1970s, but at a minimum they leave that impression.  In fact, the high inflation of the 1970s was caused by monetary policy.  As the following data suggests, NGDP rose extremely rapidly during the 1970s and early 1980s.  Because RGDP rose at pretty much the same (3%) rate it rises in any other decade, fast rising NGDP is both a necessary and sufficient condition for the Great Inflation.  The only question is what caused such rapid growth in NGDP, or M*V.

1970 5.5
1971 8.5
1972 9.9
1973 11.7
1974 8.5
1975 9.2
1976 11.4
1977 11.3
1978 13.0
1979 11.7
1980 8.8
1981 12.1
1982 4.0

To the extent that oil shocks have any effect on NGDP, it is probably contractionary.  That’s why NGDP growth slowed in 1974 and 1980.  Thus the energy price shocks contributed almost nothing to the Great Inflation, although they help explain why inflation was higher in some years than others, as oil shocks tend to temporarily depress RGDP growth.

Marcus Nunes sent me a quotation from a 1997 paper by Bernanke, Gertler and Watson:

Macroeconomic shocks such as oil price increases induce a systematic (endogenous) response of monetary policy. We develop a VAR-based technique for decomposing the total economic effects of a given exogenous shock into the portion attributable directly to the shock and the part arising from the policy response to the shock. Although the standard errors are large, in our application, we find that a substantial part of the recessionary impact of an oil price shock results from the endogenous tightening of monetary policy rather than from the increase in oil prices per se.

Bernanke got to put this theory in action in late 2008, when the Fed tightened monetary policy in response to the high oil prices of mid-2008.  In this case monetary policy was much tighter than in 1974 or 1980.  In those earlier cases, NGDP growth slowed a bit, but RGDP slowed much more, producing “stagflation” in both years.  In contrast, in late 2008 monetary policy was so tight that we ended up with a disinflationary recession in 2009.

I was looking at the GDP deflator data and noticed an interesting pattern.  During my entire life (I was born in 1955) the GDP deflator rose by 1% or less only twice.  Any guesses?  Hint, they were the two years when many right wing economists predicted skyrocketing inflation as a result of the Fed’s supposedly “easy money” policy of late 2008.  The period right after they doubled the monetary base in just a few weeks.  That’s right, only 2009 and 2010 saw a GDP inflation rate of 1% or less.

The implication of the Bernanke, et al, study is that the Fed shouldn’t overreact to supply shocks, or else they might trigger a recession.  Let’s see how they respond to the current surge in oil prices.  The early indications are that nothing has been learned:

One of the Federal Reserve‘s leading hawks warned Wednesday of the risks of maintaining easy monetary policy in the face of rising commodity prices

PS.  Some people think that Jimmy Carter had “bad luck” because of the 1979 revolution in Iran.  Look at NGDP growth in the years before the revolution—a period when oil prices were stable.

Update, 2/26/11:  Marcus Nunes just sent me this link to his blog.  He had previously made the same point, with much more comprehensive data.

HT:  Marcus Nunes

Is my faith in markets warranted? (Reply to Caplan)

In a recent post, Bryan Caplan questioned my faith in markets as the best indicator of the impact of government economic policies:

Forbes provokes Sumner to don the robes of hanging judge for the hypocritical right:

“If Forbes is right, and the markets are made up by a bunch of fools, then why not go with socialism?”

.   .   .

His verdict rings true, but it reminds me of an earlier question that’s still bugging me: Why did financial markets like Nixon’s price controls so much?  What gives, Scott?  Was it just a random error, or what?

When you don’t have strong arguments, it is best to substitute quantity for quality, use some misdirection, and end up with an appeal to religious authority.  I’ll do all three.

I was only 15 when Nixon made his famous August 15th price controls announcement, so I apologize if my memory fails me on a few points.  But here is what I recall:

a.  Nixon installed a “temporary” wage/price freeze, which was to last for 90 days.  It was widely (and correctly) anticipated that this freeze would be followed by a period of looser controls.  It was also anticipated (correctly) that the weaker price controls would be easy for firms to evade.  Wage controls were the real issue, price controls provided political cover.

b.  Nixon pulled an FDR, and did an end run around the Fed by devaluing the dollar against gold by 10%.  This had the effect of devaluing the dollar against many other major currencies.  He also closed the gold window.

c.  He cut taxes.  I don’t recall exactly which ones, but I believe there were income tax cuts and a cut in excise taxes on cars.

1.  My first argument is that it is not clear that the positive stock market response was in reaction to the wage/price controls announcement.  The stimulus to AD was very impressive, and could explain at least part of the response.  Nevertheless, for two reasons I do not want to rely on this excuse.  First, because my hunch is that the stock market did welcome the wage/price controls, or at worst was neutral on them.  Furthermore, the monetary stimulus was probably unwarranted, as NGDP growth was adequate.  So what are some other possible reasons for the market reaction?

2.  Wage/price controls combined with monetary and fiscal stimulus were a very potent mixture, almost sure to benefit the economy in the short run, and boost the odds of Nixon’s re-election.  However the response of the markets was stronger than what one would expected from a mere increase in the probability of Nixon being re-elected.  (The stock market rises about 2% on a 100% increase in the odds of a Republican winning.)  And of course this argument would cut against my view that markets can tell us something about the wisdom of policy initiatives.

3.  At the time, the controls were viewed as a sort of “incomes policy,” a way of shifting the Philips curve to the left and making it easier to reduce inflation.  Some European countries were believed to have had success with this sort of policy, although the record was definitely mixed.  If you believe that nominal wages were above the optimal level in 1971, perhaps due to the strength of unions, then wage controls can actually improve the performance of the economy.  I recall reading that Hitler used wages controls to spur a rapid recovery in Germany after 1933, although I suppose Hitler is not someone I want on my side.  So let’s move on.

4.  Perhaps the wage controls combined with stimulus to AD were seen as a way of shifting income from labor to capital.  I am pretty sure that corporate profits did well for the next two years, although someone should check-double that.  In that case the market response might have been “rational” but again it would not support my argument that markets can tell us something about the wisdom of policy initiatives.

5.  Ex post, the wage/price controls were a significant error, but recall that the markets had no idea what was coming next.  They did not know that after 1973 productivity growth would slow sharply, causing monetary policy (which was excessively focused on real output and unemployment) to go off course and allow inflation to drift much higher.  And of course they had no idea that OPEC would drive energy prices much higher in 1973.  As far as I know, nothing like OPEC had ever been seen, at least at that scale of operation.  I do think that even under the best of assumptions the markets misjudged the Phillips Curve relationship in 1971, as did the vast majority of economists.  Which brings me to one of my strongest arguments.

6.  As far as I can recall most economists supported the wage/price controls.  This is important because this whole debate was motivated not by the question of whether markets are perfect, but rather whether they are better guides to policy effectiveness than the experts.  And in this case the experts were wrong as well.  So even in this 38 year old case, which admittedly looks very bad for EMH people like me, the experts seem to have done no better.

7.  My claim is that one should look at the response of real stock prices.  Usually the price level doesn’t change much from day to day, so a large rise in nominal stock prices translates into a large rise in real stock prices.  And that was also true on August 16, 1971.  But also note that US stock prices in terms of gold and foreign exchange fell sharply, as the 10% dollar devaluation was much bigger than the rise in the Dow (which I seem to recall was around 3% or 4%.) I really don’t have a good answer as to what to do in this sort of situation.  Obviously if the Fed suddenly announced a policy of hyperinflation, the nominal value of stocks would soar.  But that does not mean a policy of hyperinflation would be wise.  Because many prices are sticky in the short run, you have to be careful in interpreting the response of markets to nominal shocks.  Nevertheless, I stand by my previous discussion of market responses to policy in the Great Depression, and also in 2007-09.  I think the markets did correctly point out which monetary policies would be helpful, and which were woefully inadequate.

I suppose I should be flattered that Bryan had to go back 38 years to find an example where the markets clearly seemed to have blown it.  Especially since even in this example the experts did no better.  And I can find many more examples where the “experts” failed us.  I would also note that Bruce Bartlett made a similar comment (in my old blog), so apparently this example has become part of the folk wisdom that economists use when anyone cites market responses to policy to show that the “emperor has no clothes.”  But since when is a single anecdote enough to discredit an economic argument that has the virtue of being consistent with economic theory, especially given that dozens of anecdotes can be found to discredit the counterargument that experts are smarter than markets?

In fairness to Bryan Caplan and Bruce Bartlett, there may be many other such counterexamples, perhaps they simply chose the most famous example.  I admit that I was surprised by the seemingly positive market response to the Obama stimulus package, for instance.   At this point I am tempted to trot out a religious argument.  Recall how when someone mentions a particularly gruesome example of genocide committed by the “good guys” in the Old Testament, Christian fundamentalists will say something like; “The Lord moves in mysterious ways, we are not in position to second guess him.”  Don’t the Catholics also see this sort of  presumption as a sin?  Perhaps the same is true of market responses to policy announcements.  Maybe the markets thought the Obama stimulus package showed that the government was determined to avoid a depression, and that they would do whatever was necessary to boost AD.  Or that it would indirectly make monetary policy more stimulative, by increasing the money multiplier.  The stock market moves in mysterious ways, it is not for us free market believers to question its infinite wisdom.

Returning to reality (now that I have offended Protestants, Catholics and Jews), I suppose in the end my best defense of 1971 would be the following.  The markets correctly saw that 1972 was going to be a very good year.  I first heard of Arthur Laffer when he used the stock market to forecast NGDP growth in 1972; most other economists used econometric models.  Laffer forecast higher nominal growth that the others, and was right.  My hunch is that the stock market correctly understood that the stimulus would lead to higher NGDP over the next few years, which would justify higher nominal stock prices.  In addition, the wage controls would weaken the power of unions and allow this higher nominal growth to show up in higher profits.  They correctly understood that firms could evade the price controls and in any case most firms were monopolistic competitors and would like like nothing better than to have a slightly smaller price increase, but a much bigger market.  Ex post the market was wrong.  Nixon’s policy failed for all sorts of reasons; a misunderstanding of the Phillips Curve, a mistaken belief that the sort of incomes policies that were workable in small consensual societies like Austria could work in the US, bad luck with OPEC and crop failures, etc.  But I don’t think the market reaction was quite as irrational as it might seem in retrospect.  And again, most economists made similar mistakes at that time.

So how about the following:  We will not use market responses to directly evaluate whether a particular policy is good or bad.  Rather we will use markets to answer technical questions, such as how much inflation or NGDP growth we are likely to get next year and the year after.  Right now the TIPS market says we can expect just over 1% inflation for the next few years.  The political and economic right says inflation is a much bigger problem than unemployment.  Let’s revisit this question in two years and see who was right.