Archive for the Category Inflation


Was NeoFisherism vindicated?

Rajat directed me to a new post by Stephen Williamson, which suggests that recent events provide support for the NeoFisherian view.  The Fed has been gradually raising their interest rate target since late 2015, and inflation has gradually risen from near zero up to roughly 2%.  In addition, nominal interest rates are positively correlated with inflation rates at the international level.

Here are three ways of interpreting that evidence:

1. Higher interest rates cause higher inflation.  (NeoFisherism)

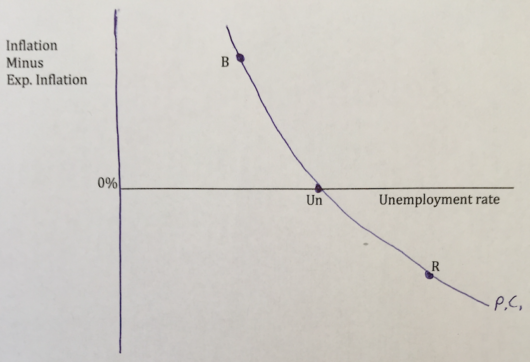
2. Low unemployment led the Fed to fear inflation (Phillips Curve), and they tightened monetary policy to prevent inflation from overshooting. (Keynesian)

3. The Fed did not tighten at all.  Contra NeoFisherism, raising the interest rate target is usually contractionary, ceteris paribus.  But the Fed often raises rates during periods when the natural rate is rising, and in most cases they raise rates more slowly that the natural rate is rising.  This means that while it is true that raising rates is usually contractionary, ceteris paribus, in the majority of cases a period of rising interest rates is also a period of increasingly expansionary monetary policy. I would argue that 2017 was no different. So I also reject the Keynesian view.

I prefer the second and third explanation to the first because the NeoFisherian view is inconsistent with the response of asset prices to unexpected changes in the central bank’s nominal interest rate target.  And I prefer the third explanation to the second because the Phillips Curve is not a reliable way of forecasting inflation, and changes in the nominal interest rate are not a reliable indicator of changes in the stance of monetary policy.

Off topic, I just returned from a monetary conference at the Hoover Institution, which was attended by no fewer than 4 Fed presidents.  I was delighted to see both John Williams (who was recently appointed to the New York Fed), and Robert Kaplan (Dallas Fed) mention both price level and NGDP level targeting as promising options to think about.  While neither endorsed these policy options, I had the impression that if the Fed were not already committed to inflation targeting, these two Fed presidents would probably be favorably inclined to one of these two approaches.  Kaplan seemed especially interested in NGDP targeting.  However, I don’t expect the Fed to change its policy target as long as things are going well.  Instead, I’d expect some consideration of level targeting the next time we go into a recession, and hit the zero bound.


Applying Occam’s Razor to the forward value of the yen

After my previous post, Brian McCarthy left the following remarks:

I believe there is a fair bit of empirical evidence that current spot rates are a better predictor of future spot rates than are current forward rates. So a naive “long carry” strategy does generate positive returns over time. The reason this “free money” isn’t arbitraged away, I would imagine, is that the strategy doesn’t have a good sharpe ratio. ie low returns relative to the volatility. In market slang it’s “picking up pennies in front of the steam roller,” involving a significant risk of ruin if done “in size.”

So the market really does “expect” the yen to be at 106 in 30 years, which is where it is today.

This is a good argument, but in the end I favor the alternative view.

Over the past 40 years, the US price level has risen from 1 to 3.975, while the Japanese price level has risen from 1 to 1.556. That means the US price level has risen by 2.555 relative to the Japanese price level.  Over the same period, the yen has appreciated from 241.37 to 106 to the dollar, a ratio of 2.227.  So the appreciation of the yen in the very long run is pretty close to the change predicted by PPP (although over shorter periods there are quite wide discrepancies.)

So here’s how I look at things.  The simplest explanation for the forward yen trading at 50 is that the public expects Japan to continuing having lower inflation than the US, just as has been the case for the past 40 years.  They expect the yen to continue appreciating, just as it has over the past 40 years.

The alternative explanation is possible, but involves more “epicycles”:

1.  Yes, the Japanese yen has been appreciating in the very long run.

2.  Yes, the Japanese inflation rate is consistently lower than in the US.

3.  Yes, the 30-year forward yen is trading at a strong premium, just as you’d expect if these trends were going to continue.

4.  But these facts are actually unrelated.  Starting right now, the Japanese inflation will suddenly rise to US levels, even though the markets don’t seem to expect that.  And starting right now the yen will stop appreciating.  And instead some other “real factor” explains why the forward yen is trading at a strong premium, some real factor that would cause 30-year Japanese real interest rates to be hundreds of basis points lower than American real interest rates.

That’s all theoretically possible, but isn’t the simplest explanation that the forward yen is at a strong premium because investors expect the spot yen to appreciate, and they expect the spot yen to appreciate for the same reason that it’s strongly appreciated over the past 40 years?

PS.  After I wrote this post (a few days ago), I discovered a similar post written earlier by Julius Probst, who has a very nice monetary economics blog.  He anticipates my basic point.  But read his post anyway, as it ends with some interesting remarks on Japanese monetary policy.


Is an NGDP Phillips Curve somehow “wrong”?

I touched on this issue over at Econlog, but I’ll try again here in slightly a different way.

The original Phillips Curve from 1958 had nominal wage inflation on the vertical axis.  (Actually the original original PC was developed by Irving Fisher in the 1920s, and used price inflation.) Then American economists switched to price inflation in the 1960s.  In the 1970s and 1980s, economists accepted the Natural Rate Hypothesis and the expectations-augmented Phillips Curve was developed:

When inflation is higher than expected you are in a boom, and when it’s lower than expected you are in a recession.

But inflation probably not the right variable, for standard “never reason from a price level change” reasons.  Higher inflation can reflect more AD, or less AS:

So what is the right variable?  As far as I can tell, the Phillips Curve should be using unexpected changes in NGDP:

So here’s my question to economics instructors.  Suppose you have an advanced topics chapter at the end of macro 101, which covers the standard Phillips Curve (using inflation), and discusses the Natural Rate Hypothesis and the importance of expectations.  Would it be acceptable to have a section at the very end of that chapter with the final two graphs shown here?  I.e., the two AS/AD graphs to show students the downside of using inflation as an indicator of whether the economy is overheating, and the NGDP version of the Phillips Curve to explain to students why more and more economists favor NGDP targeting.

Or is there something I am missing, which makes NGDP unsuitable for the vertical axis of a Phillips Curve?

PS.  The principles textbook I’m working on will be ready for consideration later this year, available for use in classes in the fall of 2019.


Do demographics explain disinflation?

No they don’t; monetary policy determines the rate of inflation.  But the Wall Street Journal’s “Daily Shot” sees things differently:

Over the long run, economists think that demographics dictate inflation trends. The collapsing US labor force growth is expected to be a drag on the CPI.

Really?  I’ve never met an economist who thinks demographics determine inflation.  Now let’s look at the graph the WSJ uses to back up this claim:

People are far too impressed by this sort of simple correlation.  Let’s look at what the statistician had to do in order to make labor force growth and inflation look correlated:

1.  The scales for the two lines are completely different.  The left scale shows labor force growth, and tops out at 2.8%.  The right scale shows inflation, and tops out at nearly 9%.

2.  Both graphs use 10 year moving averages, which smooths out a lot of the short term volatility.

3.  The civilian labor force graph uses a 4 year lead, to make the peak growth rate line up with the peak inflation rate.

If the data were any further massaged it would turn into a bloody pulp.

Here’s what people often do.  They find two time series that each have a long period of upswing, followed by a long period of downswing.  They could have just as well have used interest rates, or some other variable.  But they chose inflation and labor force growth.  Then they smooth the data, adjust the two scales so that each peak has the same height, then use leads or lags to make the peaks line up on the horizontal axis as well.

Even worse, they use two series that are not linked according to any economic theory that I am aware of.

This is too sloppy to get published in an academic journal.  But the stuff that does get published is often flawed in a similar way, just to a much lesser extent.  The errors are more subtle.

PS.  Check out US labor force growth rate from 1865-96 (high).  Then check out the rate of inflation (negative).

HT:  Daniel Griswold

Why is inflation so low?

I have a new piece on low inflation in US News and World Report:

Surprisingly, the recent undershoot of inflation had occurred during a period when the Fed has been raising interest rates, a policy that is normally aimed at slowing, not increasing, inflation. It’s as if a ship captain responded to persistent headwinds by turning the rudder in the wrong direction.

Off topic, a couple National Review pieces caught my attention:

In Rome in 1973, a grandson of the richest man in the world, J. Paul Getty, was kidnapped. In All the Money in the World, director Ridley Scott’s bizarre take on this story, Getty is the villain, while the kidnappers are simply dutiful professionals tasked with carrying out their unfortunate mission as best they can despite Getty’s intransigence about paying them ransom.

They don’t use the term ‘nepotism’, but that’s what this is all about.  Nepotism is frowned on in the US and Northern Europe; indeed favoring your relatives at the expense of society is viewed as completely unethical.  In most of the world things are exactly the opposite; it’s viewed as unethical not to favor the well being of one’s grandchildren over the best interest of society.

I doubt that many Sicilians would agree with me, but my utilitarian value system forces me to view Getty as a hero, not a villain.  The world would be a better place if everyone viewed things as I do, and no one paid ransom to kidnappers.  (That doesn’t mean I’d refuse to pay ransom, just that I’d be a hero if I did.  I never claimed that I’m a hero.)

Hollywood often promotes utilitarian values, but this is less true in the case of economic issues.  In those cases, Hollywood focuses on the “seen”, not the “unseen”.

Here’s the excellent Ramesh Ponnuru in the National Review:

Many Republicans credit Trump for presiding over a strong economy, too. It’s a point that requires some context. Job growth has not been quite as fast as it was in Obama’s last year, but you’d expect it to slow after an expansion this long.

That’s a defensible argument, but only if you assume that the entire alt-right/Trump campaign was built on a pack of lies.  Recall the economic “carnage” that Trump referred to in his inaugural address.  Recall the claims of 30% to 40% unemployment.  Recall the claims that downtrodden unemployed workers in West Virginia, Wisconsin, Pennsylvania and Michigan voted for Trump out of desperation.

So yes, it’s possible that job growth slowed in 2017 because Obama left Trump with an American job market that was already “Great Again.”  I’m not going to take a position either way on this issue; just point out that Trumpistas can’t have it both ways.

US News has a new article pointing out that the legalization of pot in Colorado did not lead to the total disaster predicted by drug warriors:

Over at Econlog I have a recent post discussing Portugal, which has decriminalized the use of all drugs.  Heroin addiction has fallen sharply, again just the opposite of what the drug warriors predicted.

I’d have a tad more respect for conservative Republicans like Jeff Sessions if they spent less time gloating over tax cuts for corporations, and instead expressed a bit of remorse over the millions of lives they have ruined with their punitive policies.  Policies that we now know were ineffective.  Here’s one example from Reason magazine:

About a year later she was picked up in another undercover sting.  This time, having turned 18, she was arrested for prostitution (a misdemeanor) and possessing a small quantity of marijuana (a felony).  The conviction shattered her dreams of someday becoming a nurse.

Now, she says, “I’m a single mother with a felony and I will be labeled a loser and a whore for the rest of my life.”  Mere months ago, she was being exploited.  Today, for the same behavior, she’s a criminal.

HT:  Ben Cole