Archive for the Category Inflation


Erdogan reasons from a price change

[I wrote this a few weeks ago, and then decided not to post it.  After today’s news I changed my mind.]

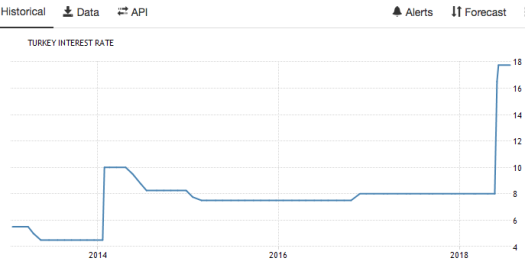
Turkish President Erdogan claims that the way to lower inflation is to have the central bank hold down interest rates.  How’s that theory working out?

Turkey’s central bank sharply lifted its annual inflation forecast on Tuesday to 13.4 per cent just a week after keeping interest rates on hold as it grapples with a weakening currency.

The move to raise the outlook from a previous forecast of 8.4 per cent in April comes amid concerns by investors about the independence of the central bank, which has come under pressure from Recep Tayyip Erdogan, the Turkish president, who is a self-declared “enemy” of high rates.

Murat Cetinkaya, the central bank governor, pushed back against claims that political interference is limiting his ability to tackle soaring inflation. Consumer price inflation hit 15.4 per cent in June — a figure three times higher the official 5 per cent target.

NeoFisherians correctly point out that a monetary policy that produces a sustained period of low inflation will be associated with low nominal interest rates.  But cutting the central bank policy rate does not cause inflation to fall, just the opposite.

As an analogy, ownership of a Ferrari is strongly correlated with being wealthy.  However purchasing a Ferrari does not cause one to be wealthier, just the opposite.

PS.  In fairness, the Turkish central bank did recently increase rates sharply.  But it was too late; years of holding rates at 8% let the inflation genie out of the bottle.  Now it’s playing catchup.

Screen Shot 2018-07-31 at 11.36.41 AM

Inflation before the oil shock

Tyler Cowen recently linked to an interesting William Fischel paper from 2016:

In the 1970s, unprecedented peacetime inflation, touched off by the oil cartel OPEC, combined with longstanding federal tax privileges to transform owner-occupied homes into growth stocks. The inability to insure their homes’ newfound value converted homeowners into “homevoters,” whose local political behavior focused on preventing development that might devalue their homes. Homevoters seized on the nascent national environmental movement, epitomized by Earth Day, and modified its agenda to serve local demands, thereby eroding the power of the prodevelopment coalition called the “growth machine.” The post-1970 shift in the American economy from industrial employment to knowledge-based services rewarded college graduates and regions that specialized in software and finance. Residents of suburbs in the larger urban areas of the Northeast and West Coast used existing zoning and new environmental leverage to protect the growth rate of their home values. The regional spread of these regulations has slowed the growth of the economy and perpetuated regional income inequalities. I argue that the most promising way to modify this trend is to reduce federal tax subsidies to homeownership.

1.  Consider it done.  The 2017 tax bill will lead to 60% fewer people using the mortgage interest deduction.  That didn’t take long!  Seriously, I do think this reform will help, but we should not expect miracles.  So far it doesn’t seem to have dramatically slowed the rate of appreciation in home prices, although it’s plausible that the increase would have been a bit faster without the tax change.

2.  The environmental movement did have some major successes, such as cutting air and water pollution.  But the requirement for “environmental impact statements” now seems like a major mistake, and indeed might actually hurt the environment by making it harder to build in major cities.

3.  Not to get too picky, but the idea that OPEC touched off the Great Inflation is a myth.  Here’s inflation before the oil shock of October 1973:

Screen Shot 2018-08-08 at 12.52.30 PM

During the early 1960s, inflation averaged a bit over 1%/year.  Monetary stimulus beginning in the mid-1960s pushed the rate up to 6% by the end of the decade.  A slightly tighter monetary policy led to a very small recession, and pushed inflation down to 4.3%.  Price controls then pushed (measured) inflation down to 3% in 1972.  But those controls were used by Nixon as cover to pump up NGDP growth to 9% right before the 1972 election.  By the third quarter of 1973, year over year NGDP growth was running at over 11%, and 12-month CPI inflation was up to 7.4%.  And this is all before the first OPEC oil shock.  It was a demand-side problem.

BTW, budget deficits also played no role in the Great Inflation, as they were quite modest during this period.  If budget deficits caused inflation, by 2019 we’d be well on our way to hyperinflation.  Overall, the Great Inflation was almost 100% monetary policy, even as year-to-year volatility was impacted by oil prices (after October 1973).

Despite these nitpicks, the Fischel abstract sounds basically correct to me—it’s a good way to frame the housing problem.


NeoFisherism in Turkey

From the FT:

The Turkish lira led a broad drop in emerging market currencies on Tuesday after President Recep Tayyip Erdogan vowed to take greater control of monetary policy if he wins elections next month.

Mr Erdogan has for years harboured a deep antagonism towards high interest rates, taking the unconventional view that they cause rather than curb inflation. Last week, he warned that they were “the mother and father of all evil”, fuelling concern that he would not allow the central bank the freedom to raise rates.

The Turkish president told Bloomberg that cutting interest rates would lower inflation. “The lower the interest rate is, the lower inflation will be,” he said. “The moment we take it down to a low level, what will happen to the cost inputs? That too will go down . . . you will be able to get the opportunity to sell your products at much lower prices . . . The matter is as simple as this.”

PS.  A new paper by Warwick J. McKibbin and Augustus J. Panton makes the case for NGDP targeting:

Looking to the future the importance of supply shocks being driven by climate policy, climate shocks and other productivity shocks generated by technological disruption as well as a structural transformation of the global economy appear likely to be increasingly important. This suggests an important evolution of the monetary framework may be to shift from the current flexible inflation targeting regime to a more explicit nominal income growth targeting framework. The key research questions that need further analysis are: how forecastable is nominal income growth relative to inflation?; and what precise definition of nominal income is most appropriate given the ultimate objectives of policy (nominal GDP, nominal GNP or some other measure that is available at high frequency (e.g. big data on spending)). Also, the issue of growth of income versus the level of income is an open research question with many of the same issues to be faced as the choice between inflation targeting versus price level targeting.

The CPI and housing prices

Nine years ago I did a post discussing how the CPI was distorted by mis-measurement of housing prices:

Good News! There was no housing crash.

At least according to the US government.

The BLS claims that housing prices are up 2.1% in the last 12 months.  Why does this matter?  For all sorts or reasons, but first let’s try to figure out what really happened.  According to the BLS, housing makes up nearly 40% of the core basket of goods and services.

Category    weight     inflation

Housing     39 %             2.1%

Other         61%              1.4%

Overall      100%             1.7%

Suppose that instead of rising 2.1%, housing costs have actually fallen 2.1% over the past 12 months?  In that case the core rate would be zero.  Which number seems more likely?  For much of the past year house prices have been falling at more than 2% a month.

Bloomberg reports a new academic study that reached similar conclusions:

New research shows that the CPI is slow to reflect changes in prices—and, equally important, understates the degree to which prices move up and down. The problem stems from the way the government calculates the price of shelter, a category that makes up one-third of the index.

Three economists have developed an alternative measure that captures price moves as soon as they occur and shows the full range of changes. If it had existed in 2008-09, when the economy was in the deepest recession since the Great Depression, it would have shown far deeper deflation than the Bureau of Labor Statistics registered. The official CPI, they write in a new paper, was overstating inflation by 1.7 percentage points to 4.2 percentage points annually during the Great Recession. More recently, they write, the problem has been the opposite: Annual readings have understated inflation by 0.3 to 0.9 percentage points. Those are huge disparities given that forecasters make a big deal of fluctuations of just one or two tenths of a percentage point in the official rate.

Here’s a graph that shows how big a difference it makes:

Screen Shot 2018-05-10 at 8.33.59 PM

That correction is actually a bit larger than even I would have expected.  But even if their method is not perfect, I have little doubt that the basic point is correct; the CPI is less volatile than an alternative price index that reflects actual market prices in the economy.

The problem they point to is similar to the one I mentioned back in 2009. The BLS uses rent payments on existing contracts that do not reflect the market rent on apartments currently on the market.  During a slump, it’s not unusual for a new tenant to get one or two months free rent:

The economists behind it are Brent Ambrose and Jiro Yoshida of Pennsylvania State University’s Smeal College of Business and Edward Coulson of the Merage School of Business at the University of California at Irvine. Their latest version is described in an April 20 academic paper titled “Housing Rents and Inflation Rates.” The key difference from the CPI is that their measure factors in only new rental leases, including those of new tenants and old ones who recently renewed. The BLS, in contrast, also includes rent paid by tenants whose leases weren’t up for renewal in the latest month, which means it’s slower to pick up on changes in market conditions.

Kudos to Ambrose, Yoshida and Coulson for putting a spotlight on a very important flaw in the CPI, which many professional economists use too uncritically.

Where the FTPL applies

The fiscal theory of the price level does not explain very much in the US.  Inflation often soars much higher during periods when the national debt is low and falling (the 1960s) and falls sharply when the deficit increases dramatically (the 1980s).  But the FTPL does explain the inflation dynamics of Argentina:

“The [peso] price action looks like a loss of confidence by foreign investors coupled with some form of “capitulation” by domestic investors,” he added. “Markets need to see a radical tightening in fiscal policy in order to stabilise the situation, and that includes cutting wage hikes in order to fight inflation.

There is also some data that sounds suspiciously NeoFisherian:

Argentina’s peso is again feeling the heat.

The currency has fallen to a new record low of 23 against the dollar after slumping 5 per cent in morning trade on Tuesday. . . .

The declines come despite massive intervention by the Argentine central bank, which hiked interest rates by an unprecedented 12.75 percentage points to 40 per cent in the space of just seven days last week.

As always, however, you need to keep in mind the correlation/causation distinction.  Most likely it’s the high inflation causing the high nominal interest rates, not vice versa.  (Or if you prefer, the budget deficits are causing both.)