

Economic indicators and the risk of “lowflation”
As we enter 2019, there are some economic indicators worth thinking about. Some are obvious, like the strong jobs growth (stronger than I expected.) Some are more subtle. Here are wage inflation (blue) and core PCE inflation (red):
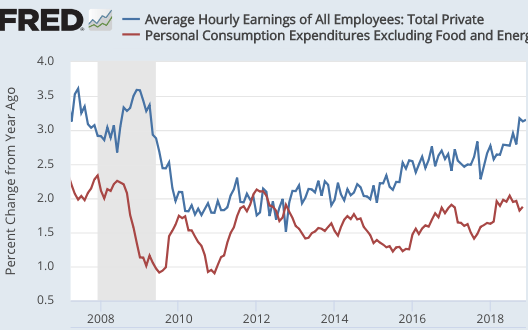 In my view, wage inflation is far more meaningful. But PCE inflation is what the Fed is targeting, so we also need to pay attention to that variable. I’d expect it to follow wage inflation, but the relationship is weak.
BTW, I noticed a problem with the way they calculate core inflation, at least for the CPI. It does not include food consumed away from home. In my view, restaurant meals are one of the most “core” of all core inflation components, or should be. The whole point of core inflation is to include stuff closely related to wage inflation, which is very inertial. And yet food away from home (6% of the CPI) is considered part of “food and energy”, and excluded from core. In contrast, I’m not sure shelter should be included in core inflation, as real estate price measures are not reliable. But this component (1/3 of the CPI) is a part of core inflation. This link gives the weights of the CPI basket. The CPI is just a mishmash of unrelated and hard to measure stuff.
This is one reason why I’m less concerned with “lowflation” than many other people. Wage inflation is steadily rising, and is approaching pre-recession rates. We seem headed in the right direction. NGDP growth has also been strong.
Private forecasters predict roughly 2% inflation going forward, while the financial markets seem to predict less than 2%. How much less? That’s hard to say.
The 5-year TIPS spread is about 1.65%. But CPI inflation has exceeded PCE inflation by 0.25% over the past decade, so in fact the true TIPS spread (for PCE) is around 1.4%, well below the Fed target. That may be partly due to two factors. One is the recent fall in oil prices. For various reasons including lags in adjustment, TIPS spreads tend to follow oil prices (the graph divides oil prices by 25, to make comparisons easier to see):
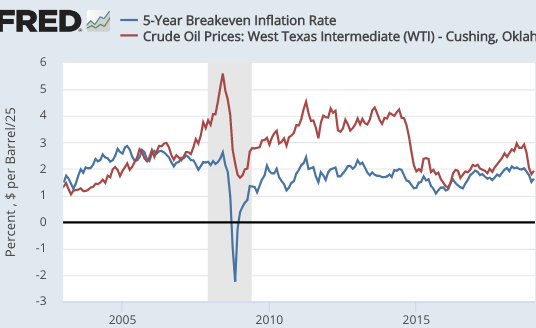 The the sharp fall in oil prices in 2015 pushed the TIPS spread down from 2% to 1.3%. Or at least it seemed to. I have trouble understanding how the effect could be that large. The recent drop should not have reduced 5-year TIPS spreads more than about 0.2%. So that leaves perhaps a 1.6% market PCE inflation forecast over 5 years—still lower than target.
Can a liquidity premium for T-bonds explain this gap (as in late 2008)? Maybe, but I lean toward the view that the market really does forecast slightly below 2% inflation, say 1.7% or 1.8%. This might reflect a 50% chance of continued boom and 2% inflation, and a 50% chance of recession and only 1.5% inflation, for instance.
Another variable of interest is fed funds futures. They normally show a rising trend over time. Right now the current fed funds rate is around 2.4%, expected to fall to 2.3% in July 2020. So that tells me that the market expects a bit of “lowflation” in 2019, which might eventually lead to a rate cut. But no recession. Of course the market is presumably pricing in a certain probability of continued boom and higher rates, and a slightly higher probability of a sizable rate cut if there is lowflation and/or recession.
In my view, 2019 will tell us a great deal about whether we have moved to a higher trend rate of growth, and/or whether policy is still too tight to hit the Fed’s 2% PCE inflation target. It’s not impossible that both might occur—sub-2% core PCE inflation and RGDP growth above the Fed’s forecast. This would actually be good news in a way, as the “lowflation” would mean the Fed would not have to act to slow the recovery, which then might extend for many more years. I don’t predict stocks, but the goldilocks outcome might be good for equities.
PS. I’m reluctant to mention stocks as an forecasting tool, because they are so noisy. They are affected by NGDP growth, but also by trade wars, foreign growth, and other factors. The partial recovery from late last year makes a recession slightly less likely, although I never thought the risk had reached a 50% probability. The fairly flat yield spread points to slower growth but no recession—similar to fed funds futures.
PPS. I’m tempted to call a Chinese recession. If I were right it would look very good, given how I pooh-poohed all the other pundits who wrongly predicted a Chinese recession in previous years. But I won’t. No guts, no glory. And I have no guts. I predict they’ll muddle through.
Tags:
17. January 2019 at 11:23
Very good post.
Real wage increases flirting with 2% are of course good news for everyone but employers (disclaimer: I am an employer), while they don’t seem out of control (between 1996 and 1999, real wages jumped almost 11% in 3 years).
Wage growth is surely a more reliable sign of labor market tightening than those based on LFPR numbers, no? Hell, higher wages oughtta induce anyone left on the sidelines to take a look.
Still, I’m thinking we’re near the end of 2 million+ annual job growth. Helluva run — 21 million jobs in 9 years, 100% private sector (that’s as many jobs as France’s entire private sector lol) — and a long slog back for 10 million Americans.
As you suggest, the smart money is guessing the Fed continues to fall somewhat short of the 2% PCE target in the future.
I find this aggravating, not from a macroeconomic standpoint (1.5% inflation provides enough lube), but from the William Jennings Bryan standpoint. Your first graph argues eloquently for a 2% PCE ceiling this past decade, with undershooting redounding to the benefit of creditors (banks) at the expense of debtors. Oh well.
17. January 2019 at 11:52
I’m having trouble thinking through how a Chinese recession would play out. Chinese NGPD growth (10-7%) and inflation (2-3%) have been stable over the past decade as far as I can tell. Would a recession in China require the central bank to dramatically tighten by halting NGPD growth or would NGDP growth slightly decrease and inflation increase in a stagflation scenario?
17. January 2019 at 12:31
Scott is bearish on China?!
–> Prepare for the worst.
17. January 2019 at 14:14
Can you explain more the link between oil prices (a level) and 5 year inflation (a rate of change)? I’m having trouble figuring that out. I can see how an oil price rise or fall would impact current inflation. But if you told me today’s price is “high” or “low” (per the graph in this post), my EMH mindset does not see the connection that would make me think that inflation over the next 5 years will be higher just because today’s price is considered “high”. Or that a “low” oil price would result in lower CPI going forward (if anything, I’d think oil prices might be more likely to rise after that).
17. January 2019 at 16:33
Verdoon’s Law (or close). Rising output leads to higher productivity.
Unit labor costs are rising at about 1% a year.
Presently, labor force participation rates are rising and the unemployment rate is rising.
A peevish fixation on inflation and wages does not make a monetary policy.
Let us hope for a couple generations a very tight labor markets.
China? 6% growth this year. The People’s Bank of China answers to the Communist Party of China, and they are below their inflation target anyway. They have lots of room.
17. January 2019 at 16:52
Tom, A Chinese recession would probably involve tight money.
Christian, Just to be clear, I expect slower growth, but no outright recession in China. So only moderately bearish.
Bill, TIPS respond with a lag to actual inflation. So lower oil prices create an expectation of lower future TIPS adjustments. It’s an artifact of the indexing system. Real yields on TIPS then rise to offset the expected price cut.
18. January 2019 at 12:32
TIPS follow oil prices, in large part, because both follow the short end of the unobservable NGDP expectations curve. Oil prices have been highly correlated with stock prices for the last two months, hell everything’s been strongly (inversely) correlated most days the last two months, because NGDP expectations are the question of the day, not market-specific supply side concerns. The way to show this would be to compare daily frequency year-ahead NGDP expectations from Hypermind or NGDP Advisers in a scatter plot vs oil, and vs TIPS spreads and show the correlation is similar or higher than oil vs TIPS. Maybe I will find time for this.
18. January 2019 at 17:26
OT but fun. Scott Sumner often blogs that he finds public opinion polls to be dubious.
This is from the latest University of Michigan consumer confidence survey:
Consumer sentiment declined in early January to its lowest level since Trump was elected. The decline was primarily focused on prospects for the domestic economy, with the year-ahead outlook for the national economy judged the worst since mid 2014. The loss was due to a host of issues including the partial government shutdown, the impact of tariffs, instabilities in financial markets, the global slowdown, and the lack of clarity about monetary policies.
—30—
Really? Consumers are worried about the lack of clarity in monetary policies? Consumers are worried about tariffs?
But no consumers are worried about bloated federal deficits?
I suspect consumer surveys are salted with a lot of retired liberal economists.
18. January 2019 at 17:52
Justin, Even if that’s true, and I’m not sure it is, it would not change the fact that sudden changes in oil prices distort the TIPS spread.
18. January 2019 at 23:05
Scott,
I set out to debunk your oil price/breakeven inflation nexus. I figured I’d look at the 30-year instead of 5-year; surely oil price noise doesn’t contaminate this number.
So I plotted it, and you don’t need fancy stats to see these things are fairly tightly joined.
I’ll try to digest the theory later, but you are right. (BTW- oil prices / 35 provide a better picture).
Anyway, uncle. I’ma leave off on TIPS spreads a bit. Thanks.
19. January 2019 at 14:35
Something has always seemed paradoxical to me about including shelter in the CPI: increases in the real interest rate meant to damp inflation may lead to less construction and thus higher prices. Indeed, the high rents we see today are partly the result of the housing construction crash, which was exacerbated by tight money. Without the crash, there would be millions of additional housing units.