

To boldly go where America has never gone before
Which of these statements is true:
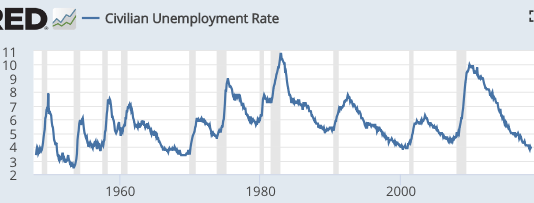
1. Tight labor markets are almost always followed by recessions within a year or two (1966 was an exception).
2. Inverted yield curves are almost always followed by recessions within a year or two (1966 was an exception.)
3. The US has never experienced an expansion lasting more than 10 years.
Actually, all three are true. And none of the three have any necessary implication for current monetary policy. (Over at Econlog, I explain why I believe labor markets are currently tight.)
Suppose we took the first statement seriously. If the labor market is getting tight, then the Fed might want to tighten monetary policy to get the labor market less tight. After all, tight labor markets are often followed by recessions. In contrast, if the yield curve inverted, then the Fed might want to loosen policy to avoid a recession. And if the expansion has lasted for 9 years, then the Fed might want to simply throw in the towel, as history tells us that there is nothing that can be done. A recession is inevitable in the near future.
In fact, history is not destiny. It’s quite possible this expansion lasts for more than 10 years. It’s quite possible that (as in 1966) a tight labor market doesn’t lead to a recession. And its quite possible that (as in 1966) an inverted yield curve is not followed by a recession. Unfortunately, we responded to the inverted yield curve of 1966 with an easy money policy, which created something even worse than a mild recession—the Great Inflation (which itself led to more severe recessions later on.)
History is no guide when the Fed is trying to achieve something that it has never achieved in all of American history—a soft landing. So why am I so naive as to think this time is different? Because Trump is President! (Just kidding.) One reason is because other countries have recently achieved soft landings. Examples include the UK in the early 2000s and of course Australia. Furthermore, the history of American monetary policy can be seen as a series of mistakes, and each time the Fed learns a lesson. The Fed no longer creates 10% deflation. They no longer create 10% inflation. Now they must learn to avoid severe recessions. I see no reason why they can’t succeed in that endeavor—Australia has already done so.
Update: Let’s define ‘soft landing’ as at least three more years of growth once the labor market has become tight.
Undoubtedly the US will still experience the occasional mild recession. But we can, should, and probably will do much better than in the past. Recall that in the 1970s, people like me who claimed the Fed could control inflation were viewed by the Very Serious People as being hopelessly naive and utopian. The VSPs are always behind the curve on monetary policy. They don’t understand monetary theory, and hence rely on “history”. But history is a very poor guide when it comes to monetary policy.
And if you insist on going with “history”, then don’t tell me what the Fed needs to do to avoid the next recession. History says a recession is inevitable, within 9 months.
Meanwhile the NGDP prediction market is up to 5.2% growth, and the number is rising. I’ll go with the prediction market over “history”.
PS. I increasingly believe the Fed has (perhaps subconsciously) absorbed the most important lesson in monetary policy:
 PPS. Trump in 2014:
We need a President who isn’t a laughing stock to the entire World.
The entire world today at the UN:
Ha ha ha ha ha ha ha . . .
Tags:
25. September 2018 at 12:05
Even you are so pumped up, that’s a clear indicator that the next recession is booked.
There won’t be a “soft landing”. If you think that the Trump era has a happy ending, then you haven’t been paying attention at all. Greek tragedies never end well.
And the UN is the laughing stock. Members of its “Human Rights Council” are Afghanistan, Iraq, Pakistan, Qatar, Congo, Saudi Arabia, Cuba, Venezuela, and China. A sick organization like that has no moral authority on anything, except maybe a recipe how to torture a billion people in a billion different ways.
25. September 2018 at 12:09
However, with someone as influential as Bernanke believing the 08 recession became great not because monetary policy was “strangled” but because there was “panic” in the markets, and now with a new board member (or soon to be) advocating monetary policy should also focus on financial stability, they are still far from having “learned”!
25. September 2018 at 12:35
Isn’t 1995 a successful example of the fed backing off on the target rate in a timely manner as the curve inverted?
25. September 2018 at 12:49
I don’t mean to sound ungrateful, but Q1 2019 is starting to feel awfully close. Will there be a Q1 2020 Hypermind contract?
If you’re feeling motivated and have the appropriate support, the solution to my mind is to convince predictit.com to host NGDP contracts, that way Mercatus doesn’t have to shell out money and people can fund their own bets.
25. September 2018 at 13:01
1994 was a soft landing.
25. September 2018 at 13:56
Christian, Oh, I don’t think it will end well. You are right about that. I just don’t happen to think the “bad thing” with be a recession in the next few years.
Kevin. The yield curve did not invert in 1995.
Justin, There will be a 2020 contract if someone does it. I’ve organized the previous two contracts; it’s time for someone else to step up. How about you?
As far as Predictit, I think these markets need to be subsidized.
Doug, Recall that 1994 did not have either an inverted yield curve or a tight labor market. So that’s debatable. See my update.
25. September 2018 at 16:28
Still, I think the Fed should wait and see.
Labor markets may be tight, I suppose it is a matter of definition and what indicators someone looks at. If you read the classifieds, and not the headlines, labor markets look very loose.
As of now, unit labor costs are a drag on the Fed’s putative 2% inflation target (ceiling). Productivity is showing some signs of life as the economy regains a modicum of health. This may offset meager wage games going forward.
There is indisputable inflation in housing costs. But why would anybody ever mention housing costs?
Kevin Erdmann has posted that inflation core minus housing is below 1%.
25. September 2018 at 18:35
In 1995 it didn’t invert because after they raised the target rate to 6%, it flattened, so they backed off to 5.25%. In April, the FFR was at 6% and the 10 year was at 7%. By Feb. 96, the 10 year was down to 5.8% but the FFR was down to 5.25%. The ten year would then move back up to nearly 7%.
Then it did invert in 98, but they quickly dropped the FFR from 5.5% to 4.75%, and again, after the adjustment, the 10 year recovered – from 4.5% to 6.5%.
Then, when it inverted in 2000 and 2006 the Fed made no attempt to adjust.
At the two points where they adjusted, long term rates notched back up and there was no inflation. At the two points where they didn’t adjust, there were recessions.
https://fred.stlouisfed.org/graph/?g=lmbD
25. September 2018 at 18:45
Kevin, OK, but you need to decide whether the yield curve is a forecaster of recessions, or a guide to monetary policy. It can’t be both. If you are using 1998, then that counts as a failure of the yield curve to predict a recession, as does 1966.
Historically, the yield spread has not been a good guide to monetary policy, as I pointed out in an Econlog post a few months back.
25. September 2018 at 19:10
The is from Indeed.com of jobs offered in Orange County
Salary Estimate
$25,000 (7535)
$30,000 (6475)
$45,000 (4194)
$55,000 (3150)
$80,000 (1463)
The $25,000 number is a ceiling. In other words, $25,000 a year or less. So, the bulk of jobs offer $30,000 a year or less.
Most listed jobs do not show a wage or salary, but here are some:
Picker Packer
Kimco StaffingFountain Valley, CA
$12 an hour
Kimco Staffing-4 days ago
Warehouse Material Handler
Beauty Vanity CompanyTustin, CA 92780
$11 an hour
Easily apply
4 days ago
So, I guess the going rate to do warehouse work in OC is $11-12 an hour.
You make more money if you wash dishes!
Dishwasher
Malibu Farm LidoNewport Beach, CA 92663
$14 an hour
Easily apply
I assume supply and demand settles wages. For these semi-skilled positions, I do not see how there can be “labor shortages.” The term is meaningless.
If one encounters a business without enough labor to operate, perhaps it is a “weakling” business that should be cleansed from the economy anyway, as it cannot pay the prevailing wages. Of course, such a business will snivel about “labor shortages.”
But suffocating an economy to keep weakling enterprises afloat strikes me as very poor public policy.
https://www.indeed.com/jobs?q=&l=Orange+County%2C+CA&radius=5&start=20
25. September 2018 at 19:31
“Kevin. The yield curve did not invert in 1995.”
Well, that’s kind of the point isn’t it? The 10/2 curve got to 15 basis points in late ’94 and the Fed stopped hiking in April ’95. Greenspan & Co. backed off before the curve inverted and we got 4 more years of expansion. If you are part of the cult of Greenspan that was enlightened policymaking by the Maestro that got us a soft landing. Maybe the Fed just got lucky in ’66.
Of course that assumes you believe there is some causation between an inverted curve and recessions. I’m not sure that is as clear cut as it seems. I will say this though. I have never seen so many articles about the yield curve as I have over the last year. I’ve been working in financial markets for nearly 30 years and I don’t think I even knew what the yield curve was until about year 10. Today, everyone knows that everyone knows the yield curve predicts a recession. So maybe this will be a repeat of ’66. Hey, they got lucky once. It could happen again.
If we really have tight labor markets, why aren’t real wages rising faster?
25. September 2018 at 21:08
I weigh history somewhat more than you, Sumner. But you have a plausible case.
26. September 2018 at 02:43
Scott,
Nice post. A few things.
1. The Fed can achieve any level of NGDP growth they desire.
2. Recessions therefore can only result from Fed incompetence.
3. The Fed has a strong penchant for incompetence.
4. The likely scenarios for the next round of Fed incompetence are: they tighten prematurely because they’re worried about: (pick one of the following) a) rising inflation, b) low unemployment, or c) goat entrails…. OR they wait too long and then over-react by tightening too much.
5. Like you, I’m slightly optimistic that they might not screw up as much this time.
6. I do think that they (like you) will underestimate the positive impact of tax cuts and historically low LFPR rates and therefore will probably give the economy insufficient rein to grow as fast as it could.
The should replace the FOMC with an iPhone app.
26. September 2018 at 02:49
One more thing. We’ve entered an era of “Secular Dis-inflation” so past yield curve behavior is meaningless.
26. September 2018 at 03:19
OT but in the ballpark:
“The average price of land in Japan edged up 0.1 percent this year, putting an end to 26 straight years of decline since the burst of the bubble economy, the government said Tuesday, as a tourism boom spurs the construction of hotels and shops.”
https://www.japantimes.co.jp/news/2018/09/18/business/average-land-price-japan-posts-first-rise-27-years-back-tourism-boom/#.W6tqniN95jc
So, tight money is scary.
26. September 2018 at 03:56
Benjamin,
Hey. The problem with the official Japan land price numbers is that they are not weighted for population or underlying land value.
Example – If a piece of land in Tokyo goes from $10 million to $11 million (up 10%). And piece of rural land goes from $1000 to $800 (down 20%,) then the numbers would say that average land prices have declined by 10%
On any kind of reasonable analytical basis, Japan land prices have been going up for almost 10 years.
26. September 2018 at 05:43
Kevin and Scott, do you think the conditions that caused an inverted yield curve are the conditions that later caused a recession? If so, do you think the Fed caused those inverted yield curve-inducing conditions to occur?
Or do you think the inverted yield curve occurred due to “natural” phenomena, and the ensuing recession was caused by the Fed’s response to the inverted yield curve “problem”?
Or is there another possibility?
26. September 2018 at 06:57
Prime-age (25-54) LFPR bottomed-out at 80.6% in September 2015 and has since recovered to 82.0%. That’s 1.8 million people who have “come back” to the labor force in the past three years. I suspect most economists, if honest, would say they are surprised by this, which is why they have been surprised by job growth continuing to run north of 2 million per year.
I don’t think it’s at all far-fetched to see LFPR continue to increase. 83% is reasonable (we were at 84.6% in January 1999), which translates to another 1.3 million folks returning from the sidelines on top of organic growth.
As long as wage growth remains modest, hand-wringing over a tight labor market is premature, and we should celebrate that millions who were written off have returned.
26. September 2018 at 07:21
“Kevin, OK, but you need to decide whether the yield curve is a forecaster of recessions, or a guide to monetary policy. It can’t be both. If you are using 1998, then that counts as a failure of the yield curve to predict a recession, as does 1966.”
Maybe this is merely a semantic issue, but why not view the yield curves as a sort of proxy for the market’s expectations of future NGDP? The inverted yield curve is just a market prediction that the Fed is going to tighten policy to the point that it dramatically slows the growth of NGDP, and in doing so cause a recession. Now, markets aren’t always right, but they are pretty good. The Fed can either pay attention to the market signals and try to do what it can to keep NGDP on trend, or they can say “this time is different” and ignore market signals, and they can even go so far as to take actions that accelerate the trend of NGDP growth (as in 1966), overreacting to market signals. It strikes me that now would be a perfect time to roll out an official NGDPL targeting policy, as it would give the Fed a little bit of room to make a mistake now (to either be tight or too loose), but also to give the market assurances that whichever way they err, they will try to get the NGDPL back to a certain place over a certain period of time.
26. September 2018 at 07:26
Hi Scott, any idea what happened in the UK in 1975? NGDP growth increased from 13,2% in 1974 to 24,2%, but unemployment increased from 2,6% to 4%.
26. September 2018 at 09:38
It’s more complex than an inverted yield curve showing tight Fed policy. An inverted yield curve indicates lower short-term rates in the future.
Malinvestment at peaks may explain higher short-term real rates in 2000 and 2006. Let’s say a stock of “good” investment exists. As “bad” investment is added, the supply curve for investment shifts out. The Fed has to raise rates to keep NGDP from overheating.
When malinvestment does not pay off, the real dislocation of labor (ie mortgage brokers after 2006) creates a pressure on NGDP. The Fed has to lower rates. In both cases, the Fed acted as it would under NGDPLT.
This theory has a lot of issues. It assumes efficiency for yield curves while having inefficient investment. OTOH, some inefficient investment could really be efficient under incentives (such as FDIC-insured banks).
26. September 2018 at 10:49
Powell just said in Q&A that the Phillips Curve is flat. Has the Fed said that before? Is that a win for you professor, given I recall that’s something f you’ve been saying for yours?
26. September 2018 at 11:31
years* not yours
26. September 2018 at 13:50
Joseph, I would certainly not consider 1966 a “win” for the Fed!
dtoh, I agree that strong supply side growth makes monetary policy easier, but I don’t expect that strong growth to continue more than another year.
As for Fed incompetence, it’s not so much about mistaken day to day decisions, as it is about having the wrong regime. Inflation targeting rather than NGDPLT.
Todd, Yield curves tend to invert when the markets expect slower NGDP growth going forward. Sometimes that’s bad monetary policy, sometimes it is not. It was not bad policy in 1981.
Brian, You said:
“we should celebrate that millions who were written off have returned.”
Isn’t that what I did in my Econlog post?
Burgos, I agree that it’s largely a function of expected NGDP growth, but right now the Fed is not targeting NGDP, they are targeting inflation. I think that’s the wrong target, but if that’s what they are going to do, then they should do it, even if it means NGDP growth is unstable. RGDP growth is 3% right now, and the Fed expects it to slow to 1.8%. With a 2% inflation target, that will slow NGDP as well.
If the Fed were targeting NGDP growth at 4%, then policy is currently too easy.
Arilando. Not sure, but you had the oil shock, you had labor union shocks, you had price controls, and you had a semi-socialist government. I would expect weird things to occur. The US also saw higher inflation and higher unemployment, partly because price controls were being removed. I did a post on 1974 in the US a while back.
That pattern often occurs with third world countries, and the UK was a borderline third world country in the 1970s.
Garrett, Glad to see Powell is moving away from the Phillips Curve approach.
26. September 2018 at 14:00
5.3% today. The implicit NGDP forecast among most forecasters for 2019 is somewhere in the range of 4-5%.
All looking rosy on the aggregate demand side. I wouldn’t pay too much attention to labour markets: if unemployment falls to an inflationary level and monetary policy isn’t accomodatory, then wages will simply rise until unemployment is at a sustainable level. We know from the Great Moderation that labour markets are pretty good at self-regulating if monetary policy is sound. And I think that they’re a very murky crystal ball for determining AD policy choices.
There are still problems in the US economy, but they have to do with supply-side policy.
Arilando,
Several things:
(1) Incomes policies ceased to be binding constraints in the UK in 1974-1975, after the breakdown of Heath’s policies. This caused a huge surge in wages as workers and employers tried to catch-up with prices, and thereby a rise in unemployment towards the natural rate.
(2) An aggregate supply shock from the oil crisis.
(3) Some of the NGDP increase in 1975 was simply due to the fact that in early 1974, there was a severe cutback in hours worked due to a major coal-miners’ strike. This ran from about January to February. If you look at the quarterly figures for UK NGDP, you can actually see the effects of this strike in Q1 1974.
(4) NGDP expectations were exploding at the time due to a loss of faith in macroeconomic policymakers and severe political instability. This is also reflected in the steep decline of the pound vs. the dollar from June 1972 to October 1976, ultimately leading to the IMF being called in. Remember, it’s primarily SURPRISE NGDP increases/decreases that affect RGDP and unemployment.
Yet there’s actually a paradox in the UK figures for this period, which I read about in the work of Edward Nelson. The monetary base (the UK monetary aggregate least distorted by regulations in this period) was a good predictor of NGDP, but not RGDP. This can be explained by the distortions introduced by incomes policies in the UK, which made the NGDP-RGDP relation very unstable.
To some extent, it’s best to see late 1972 to mid-1975 as a continuous inflationary surge, during which NGDP initially ran ahead of expecations, and then expectations overtook actual growth in 1975.
There was actually a similar experience in 1980, when NGDP growth was high for the year as a whole and yet the UK economy has a severe recession. This was due to similar causes of the 1975 experience, along with a VAT increase in mid-1979.
26. September 2018 at 14:06
This graph may help to see the point on the effect of incomes policies and their collapses:
https://fred.stlouisfed.org/graph/?g=lmVD
The Conservatives’ incomes policies kept down wages well below NGDP in the period from late 1972 to late 1973, but the Miners’ Strike of 1974 destroyed the incomes policy, and the Labour government from March 1974 was initially too weak to impose its own policy. Only in 1975, with the consent of trade unions that were frightened by the inflationary surge, did Labour manage to introduce a meaningful incomes policy of their own.
Similarly, Labour’s own policy collapsed in 1979, especially after the new Thatcherite government accepted the recommendations of an independent report on public sector wages in 1979-1980, which resulted in another big “catch-up” period of rising wages and falling employment.
26. September 2018 at 15:28
Scott,
It’s total incompetence by the Fed.
1) Wrong regime
2) Wrong target
3) Won’t adhere to target.
Total incompetence.
We’ll see on long term growth. Your predictions have not been great today. Also I don’t see why you would expect a change in the tax rates to permanently shift some consumption to investment leading to permanently higher growth.
26. September 2018 at 15:30
Typos
Your predictions have not been great [today] to date.
Also I don’t see why you would [NOT] expect a change in the tax rates to permanently shift some consumption to investment leading to permanently higher growth.
26. September 2018 at 16:24
“We need a President who isn’t a laughing stock to the entire World.” Why?
26. September 2018 at 16:34
I need Eurozone’s NGDP prediction market.
26. September 2018 at 20:38
dtoh:
f you are reading, thanks for your comment.
I would not know (except in a few cases) if official figures issued by governments are “accurate” or informative.
Sheesh, even in the US, such charts as “labor share of income.” are ripped to shreds for misleading information (by some).
I see Tokyo properties have been doing well, from CBRE, Knight Frank reports etc.
Still, if we want scaremonger (as the inflationistas do) we could suggest that too-tight money in the US would lead a few decades of flat to down property prices, with devastating consequences for lenders, property owners and the economy.
26. September 2018 at 20:57
I have an odd question, but interesting. OT.
Okay, why did the US fund its WWII efforts (our nation’s finest hour, and a great victory for human rights and dignity) by higher taxes, but also a lot of borrowing?
1. Why not just tax heavily enough to finance the effort? After all, if ever there was a time when better-off people should give it up, that was it. Hey, a lot of guys were giving up life and limb.
2. Or, why not go to money-financed fiscal programs, and no borrowing in WII?
3. If you say say, “Well, money-financed fiscal programs would have resulted in the creation of too-much money,” the equivalent amount happened anyway under borrowing, and bank-lending, no?
So, WII was fought with money that was created and borrowed (leaving taxpayers in debt), instead of money that was just created?
This is a funny one….
27. September 2018 at 08:10
Benjamin Cole,
In itself, government borrowing is only inflationary if it is financed by new money. In a WWII situation, it was mostly just crowding-out private borrowers in the credit market, which can be seen as one way of spreading the burden of paying for the war.
On taxes, there’s still the issue of incentives, even in wartime.
27. September 2018 at 09:14
Benjamin Cole,
Another funny idea: Did you look up the actual data? The top income tax rate in 1944 was 94%!!! How much more do you want to tax? I find it amazing that top earners would work under such conditions. They really must have loved their country.
27. September 2018 at 23:50
Christian List–
Yes I am aware of the top tax rate in World War II, a rate maintained through the 1950s, btw.
My question is more about the creation of money.
Obviously, the economy expanded in World War II and a lot of money was created.
How was the money created? How did the US end up so heavily in debt?
Why not use money-financed fiscal programs as were successfully deployed in Japan?
By the way, I believe in lower tax rates and a much smaller federal government today, including a much smaller military.
As for taxes paid in World War II, I refer back to my original statement. Hundreds of thousands of men lost their lives or limbs, or did even worse things like burn other people with flamethrowers or drop atom bombs, events that could darken a man’s outlook for life.
Sniveling about taxes, in context, hardly seems in order.
29. September 2018 at 16:41
dtoh, Permanently higher investment does not lead to permanently higher growth.