Archive for June 2015


I’m in Jason Smith’s doghouse

Jason Smith is trained in physics, and has recently tried his hand at economics blogging.  Perhaps inspired by Matt Yglesias and Britmouse, Jason noticed that an economics degree is not required to do good economic analysis.  But he went even further than the other two, creating a revolutionary new type of economics called “Information Transfer Economics.”  Although I’ve tried to understand his model, it’s all way over my head. He knows a lot more math than I do.

Jason is now discovering just how macro research is done, and as a result Mark Sadowski and I are in his doghouse. Literally:

Screen Shot 2015-06-19 at 9.18.24 PMAnd that picture is one of the nicer things he had to say.  The dog is more handsome than I am, and probably more skilled at time series analysis.  But this isn’t too nice:

This is just garbage analysis.

Basically we did not provide the best possible study of austerity. For instance, we did not distinguish between countries at the zero bound, and those not at the zero bound. Guilty as charged.

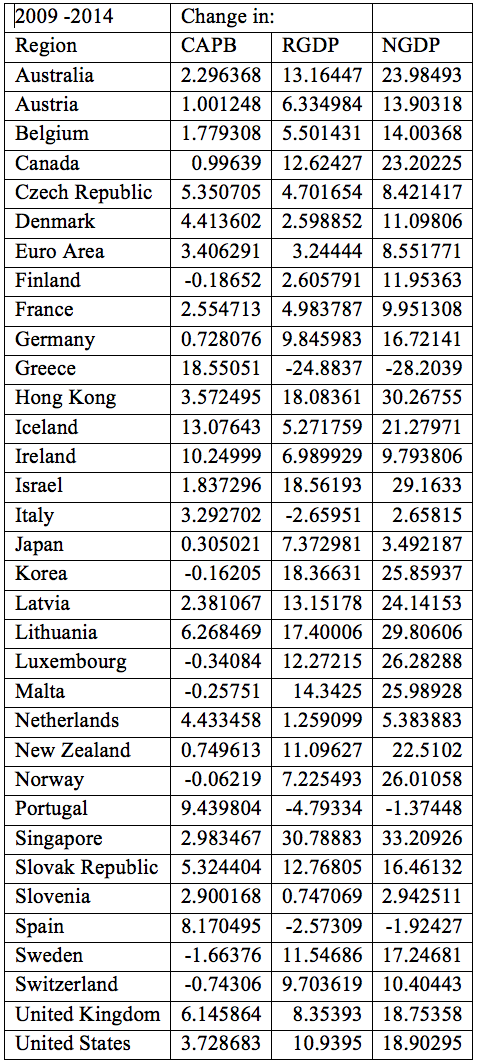
So what’s my defense?  Here’s how I look at it.  The Keynesians did several studies of the relationship between austerity and growth that were highly flawed, for too many reasons to mention.  Confusing real and nominal GDP.  Mixing countries with and without an independent central bank.  Wrongly assuming correlation implied causality.  Mixing countries at the zero bound with countries not at the zero bound. Just a big mess.

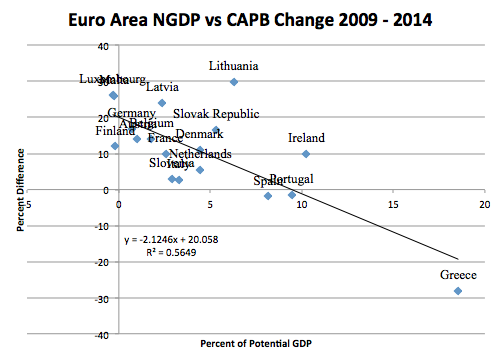
And then the Keynesians did blog posts suggesting that these studies provided some sort of scientific justification for the claim that austerity slows growth.  Mark and I thought it would be interesting to at least separate out the countries with an independent central bank, from those that lacked the ability to do monetary offset (i.e. the eurozone countries.)

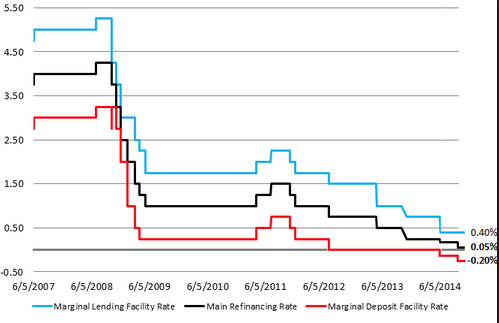
I find it interesting that our critics are outraged that we included some non-zero bound countries, when the Keynesians did as well.  For instance, the 18 eurozone countries were certainly not at the zero bound for the vast majority of this period. Their main interest rate fluctuated between 0.75% and 1.50% between early 2009 and 2013.  (It’s now roughly zero)  And yet all that time Keynesians were squawking about how “austerity” was slowing growth in Europe.  It seemed logical to assume that if the Keynesians were making this claim, then they were assuming that their model also applied to countries with low but positive interest rates.  Indeed that they assumed it even applied to countries where the central bank was in the process of raising interest rates to reduce inflation.  I’m happy throwing out the 18 eurozone countries. But of course if you do so then the empirical support for their austerity theory collapses.  Is that what my critics want?

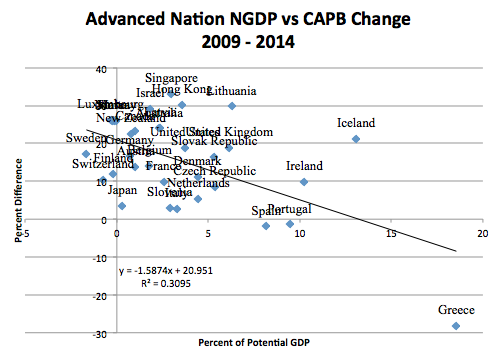
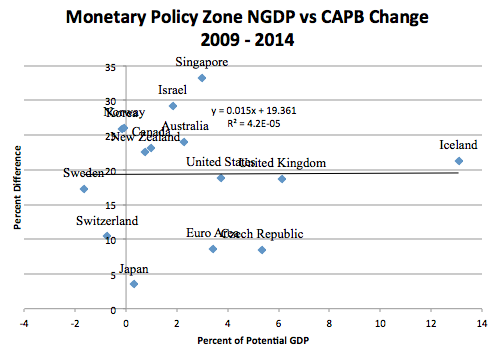
Mark improved on previous studies by looking at both NGDP and RGDP, and by separating out countries with independent monetary policies from those that lack independent monetary policies.  He showed that if you do so then the Keynesian results go away.  Maybe even further improvements could resurrect the Keynesian model.  If so, I’ll take a look at the results. But as of now I don’t know of any credible support for Keynesian interpretation of the effects of austerity during the Great Recession.

PS.  Mark has another good post over at Marcus Nunes’ blog.

PPS.  The graph below shows ECB rates, with the middle one usually cited as the policy rate.  The lower (deposit) rate did hit zero in 2012, but there is no zero bound on the deposit rate.  The increase in rates during 2011 was done to control inflation, and eventually caused a double dip recession.  Doing fiscal stimulus when a central bank is trying to reduce inflation is about as effective as slamming your foot on the accelerator when the transmission is in neutral.

Screen Shot 2015-06-19 at 9.51.27 PM

Mark Sadowski on fiscal austerity, with and without monetary offset

In recent years Mark Sadowski has done a lot of empirical work on fiscal austerity, some of which has appeared in this blog.  Now he has a new study, but first let’s review the two competing theories:

1.  Keynesian:  Fiscal austerity is contractionary at the zero bound regardless of whether you have an independent central bank.

2.  Market monetarist:  Fiscal austerity is contractionary if you lack an independent central bank.  Fiscal austerity would not be expected to have much effect if you have an independent central bank, due to monetary offset.

Mark sent me a bunch of regressions for both RGDP and NGDP.  I’ll focus on the NGDP studies, which are most relevant for tests of demand-side effects.  First Mark replicates recent Keynesian studies showing that growth tends to be lower in countries (like Greece) that did a lot of fiscal austerity between 2009 and 2014.  So far we have results that are consistent with both models:

Screen Shot 2015-06-18 at 11.51.17 AMThen he looks at the effect of austerity in just the eurozone countries. These economies lack an independent monetary policy.

Screen Shot 2015-06-18 at 11.54.06 AM

Again, consistent with both views.

Then he looks at just those economies that do have an independent monetary policy:

Screen Shot 2015-06-18 at 11.55.00 AM

Now we see a very different result, fiscal austerity seems to have no effect.  This is exactly what the market monetarists predicted, but conflicts with the prediction of the Keynesian model.

I also have a new post over at Econlog, discussing this issue.  In that post, I quote Simon Wren-Lewis saying:

In my experience anti-Keynesians tend to shy away from data series, and especially econometrics, and prefer evidence of the ‘they said this, and it didn’t happen’ kind – particularly if ‘they’ happens to be Paul Krugman.

In fact, there are other studies similar to Mark’s.  Benn Steil and Dinah Walker did one, and Kevin Erdmann did another.  Keynesians simply ignore them.

BTW, everyone should congratulate Mark, who just earned his PhD a few days ago, at the University of Delaware.  Here’s a picture:

Screen Shot 2015-06-18 at 11.56.58 AM

And here’s Mark’s data set:

Screen Shot 2015-06-18 at 11.58.40 AMI’ll try to get to the comments tonight.

Digital deflation? Not an attractive idea

Commenter Morgan Warstler keeps insisting that I’m dense because I don’t see the glorious digital revolution, which is transforming our lives and dramatically raising living standards.  If only I could see that the actual price level is falling, if we took account of all the free goodies provided by the internet.  Here’s me and then Morgan’s response:

“Morgan, OK, tell me how fast real consumption is rising, to within 3 decimal points. Show your work.”

Sure!

The invisible real consumption measure is this:

How much less money will you live with today to not have to live yesterday without access to today’s things?

Whatever you attribute to “money illusion” there is a greater gravity pulling the another way.

I don’t deny Money Illusion has a short term weighted value. But I don’t need 10 years to show digital deflation.

Since 2008, measuring real consumption, the quality of American (not easy to benefit 3rd worlders) life has increased at a pace faster than ANY 7 years period pre-Internet in American history.

So here’s my work:

1. Scott Sumner finds the best 7 years in real consumption in American history pre-1994.

2. 2008-today is rising faster than that.

And that’s when he’s being relatively sober, other times he seems like a cross between Gollum and a dominatrix:

“Morgan, There’s is nothing to win because it doesn’t matter what the numbers are; these are just statistics pulled out of thin air. Only NGDP is real. And NGDP growth is slowing.”

SORRY SCOTT

Your precious is a little b*tch compared to mine.

REAL CONSUMPTION measures in Digital > Atomic is the highest moral metric.

YOUR JOB is to argue that your precious at X% best services my precious.

So why am I wasting your time with this?  Because even Martin Feldstein, the most unMorgan-like creature in the entire universe, seems to feel the same way.  This is John Cochrane responding to Feldstein:

Martin Feldstein has an interesting Op-Ed in the Wall Street Journal, “Why the U.S. Underestimates Growth.”

The basic idea is that inflation may be overstated, because it doesn’t do a good job of handling new products. As a result, real output growth may be a bit stronger than measured.  Marty runs through a lot of sensible conclusions.

He doesn’t talk about monetary policy, but that’s interesting too. So what if inflation really is (say) 3% lower than we think it is, and therefore real output growth is 3% larger than it really is?

That would mean we are a lot closer to “normal” of course.

So why am I still skeptical?

1.  From 1995 to 2004, productivity and real GDP rose at an unusually rapid rate.  The IT cheerleaders told us that this fast productivity growth was the long delayed fruits of the IT revolution.  Now we have very slow growth, and the digiterati tell us it’s also caused by the IT revolution, which is generating lots of stuff that doesn’t get picked up in the output data, because it’s free.  While I’m impressed by an explanation that’s as flexible as a circus contortionist, I’d prefer something that isn’t consistent with any possible state of the universe.  I’m no Popperian, but I like my theories to be at least a little bit falsifiable.

2.  Much of this discussion proceeds as if economists have some sort of clear concept in mind when they talk about the price level.  We are led to believe that if only we had God-like powers to know everything, we could determine the “true” rate of inflation.  Not so, economists have never even figured out what inflation is supposed to measure, in a world where product quality is constantly changing.  Is it supposed to be the extra income you’d need today to be just as happy as the average person was in 1950?  That’s one definition, but that’s not what we are doing.  And if you look at what we are actually doing, it has no theoretical justification anywhere in economic theory.

3.  Yes, I agree, fuzzy concepts can be useful.  I have no problem with someone saying Britain’s inflation was about 20% in 1980, and 1% today.  That’s a fuzzy statement, but it is sort of useful.  But for debates about digital deflation to be useful, we need a far better idea of what inflation is supposed to measure.  Do most people really feel that a constant nominal salary now means a rising standard of living?  If so, I’d expect to see a groundswell of support for cutting the minimum wage, to below $7.25 an hour.  After all, a lower nominal income would provide just as good a standard of living, since the poor can now see lots of beautiful pictures of food on the internet.  And now they can travel using Uber!  Seriously, I think the average person would find the idea of digital deflation to be absurd.  On the other hand I’ve never been stopped from believing something just because the average person finds the idea absurd.

4.  With the atomic world, there was a sort of logic connecting more stuff with higher living standards.  More food, a washing machine, a TV and telephone.  But with the digital world “more” begins to seem rather monotonous.  I used to really enjoy reading magazines.  I recall occasionally leaving a barbershop or doctor’s office and secretly wanting to finish a National Geographic article I had started on while waiting.  I only held back because I didn’t want to look “weird” to the receptionist.  Information was really enjoyable because it was so scarce.  Now there’s a sort of infinite magazine at my fingertips.  And it’s all a bit too much.  Travelling used to be about discovery, strange new worlds you’d never seen.  Now it’s  “Yup, Costa Rica looks just like it did on the internet while I was planning the trip.”  And what about the negatives, the constant annoyance of your computer freezing up, or losing a long email that you had almost finished typing, and hadn’t saved.

5.  Revealed preference?  OK, I like that argument as much as the next guy.  But who’s to say it’s not like being a heroin addict.  Just got to check one more site before I go to bed, the 10 best places to retire, and then suddenly it’s 1 am.

Again, the price level and RGDP don’t matter, only NGDP matters.  I suppose it’s interesting to ask whether our living standards are improving, if we had any sort of semi-objective way of doing so.  But as far as I can tell we don’t have one, and most economists are oblivious to the fact that we don’t have one.  That makes debates over the “true” rate of inflation quite tedious, like people who debate how good a basketball player Bill Russell would be today, without actually having even a clue as to how one would come up with a meaningful answer.

PS.  In previous posts I’ve argued that living standards are clearly much higher than in 1973, so I also don’t agree with the opposite extreme, who say real wages aren’t rising at all.

PPS.  I’ve never bought a cell phone, but instead have been using old discarded ones.  November 29 I get a free iPhone 6 plus.  I’ll let you know if it brings me great happiness.  I know Morgan will be pleased.


Where taxes matter, and where they don’t

Don’t you hate posts about the “Two Americas”?  Get ready for another.

This is a follow-up to my recent posts on state income taxes.  Here I’ll argue that the supply-side argument is gradually weakening at the state level.  But first let’s dispose of that silly liberal argument that taxes don’t matter.  Here are some facts:

1.  Liberals favor really high MTRs on the rich.

2.  No state has a top income tax MTR of 20%.  No state even has a 15% bracket. And the only 2 with at least 10% top rates just so happen to be the only two places in America with decent weather (and hence a captive audience).

3.  Liberals control the government in a number of states.

4.  Ergo, liberals are terrified of the incentive effects of taxes, no matter how much they mock Art Laffer.  They secretly agree with Gov. Brownback.

But here I’d like to make the opposite argument; the case for supply-side effects is gradually weakening.  In a recent post I said:

In the old days high taxes would make people and companies move to other states. Commodity industries are highly competitive on price. That’s Kansas and Louisiana.  But the new economy in places like Manhattan and Boston and DC and Silicon Valley has companies with lots of market power, and people so rich they care more about amenities than a few extra bucks.  So that works in favor of the progressives, but not yet in all 50 states.

We’ve looked at the Iowa/South Dakota area, now lets look at population growth in New Hampshire and Massachusetts, and the amount by which New Hampshire outpaces the Bay State:

Period  New Hampshire   Massachusetts  Difference

1960-70      21.5%             10.5%             +11%

1970-80     24.8%              0.8%              +24.0%

1980-90     20.5%              4.9%              +15.6%

1990-2000  11.4%             5.5%               +5.9%

2000-10      6.5%               3.1%               +3.4%

2010-14       0.8%              2.9%              -2.1%

The late 1970s saw the famous tax revolts (Prop 13, Prop 2 1/2, etc.)  People were fleeing “Taxachusetts” for New Hampshire.  But that period is over, and Massachusetts (especially Boston) is now growing faster.  Perhaps this represents the concentration in the newer info-tech jobs in the big cities.  But I think it’s more than that.  New Hampshire also has lots of high tech jobs. I think it reflects the fact that highly educated Millennials are becoming more fond of urban living, and find a house in the suburbs to be boring.

But not all of them.  Some still do prefer suburban living, and when you combine that with the strict zoning laws in many “blue” cities, you end up with a more complicated picture.  There are now, yes . . . here it comes . . . TWO AMERICAS!!

InfoAmerica and CommodityAmerica.  InfoAmerica in concentrated in the big cities of the blue states (New York, Boston, DC, LA, the Bay Area, Seattle).  In those places, taxes are less important, because it’s all about the amenities.  Infotech workers are willing to pay modestly higher rates, even in states (like California) where the higher taxes don’t produce good services.

CommodityAmerica is (fittingly) more materialistic (although oddly also more religious.)  These people prefer bigger cars and big suburban homes.  They aren’t interested in edgy urban areas.  They are more strongly incentivized by lower taxes. Texas is the undisputed King of CommodityAmerica.  Texas has a reputation for sucking people in from high tax New York and California, but I believe on closer inspection they are actually sucking in more people from CommodityAmerica states with 5%, 6% and 7% top rates (and the same cheap housing as Texas.)  All of the states close to Texas are not just growing far slower than Texas; they are all growing slower than the national average.

Of course there are exceptions.  Austin is Infotech and low tax, and is (therefore) the fastest growing city in America. Buffalo is in high tax New York State, but is part of CommodityAmerica.  Is there anyone left in Buffalo? I haven’t been there recently.  BTW, there’s a reason Buffalo has an NFL team and Austin doesn’t; Buffalo was once one of America’s great cities.

PS.  I do realize there are many sweeping generalizations here, and that the picture is complicated.  Yes, in aggregate, more Millennials are moving to the suburbs than the cities.  But I still believe the trends I’ve identified are real enough that they are influencing politics and public policy in lots of areas.  The surge of support for very high minimum wages in Seattle and LA can be seen as just another “tax”: that Millennials are willing to pay.

PPS.  One thing that makes the collapse of population growth in New Hampshire especially interesting is that it is arguably the best place to live in the entire world, especially if you are in the bottom 20% of the income distribution.  It’s both rich and relatively equal.  But it’s a bit too expensive for CommodityAmericans and a bit too boring for InfoAmericans.

PPPS.  Minorities?  I’d guess blacks lean a bit toward CommodityAmerica, while Asians lean toward InfoAmerica. Hispanics seem somewhere in between.  But these are guesses, and I’d be interested in your views.

Sioux Falls rises, as Sioux City falls

This follow-up post is only for tax nerds; it gets pretty deep in the weeds, or wheat fields.  I was interested in this comment in a WSJ piece on Governor Brownback, who’s struggled to enact supply-side reforms in Kansas:

During a brief presidential run in 2007, Mr. Brownback said he saw economic growth in parts of South Dakota””where there is no income tax””outpacing activity just across the border in Iowa, which has such a tax.

Iowa doesn’t just have a state income tax; they have a relatively high one, topping out at 8.98%.  Sioux City, Iowa and Sioux Falls, South Dakota are both quite close to the border, and so I decided to investigate these two “urban” areas.  Both towns are mostly in one county, with some suburbs that spill into another county. Sioux City, Iowa also has some suburbs that cross state lines into both South Dakota and Nebraska. I’ll consider the cross-state suburbs later.  Here’s the general area:

Screen Shot 2015-06-13 at 9.09.17 PM

From Sioux City, Interstate 29 extends northwest into a wedge of South Dakota, and highway 20 goes west into Nebraska.

Now let’s compare the population of the two South Dakota counties containing the Sioux Falls area with the two Iowa counties containing the Sioux City area:

Year     Sioux City   Sioux Falls

1990       121,664        139,236

2000       128,726       187,093

2010       127,158       228,261

2014       127,145       240,204

1990-2014: +4.5%     +72.5%

That’s quite a difference.  The spillover counties don’t have enough people to change the overall picture, but S. Sioux City, Nebraska is growing faster than Sioux City, perhaps due to the lower tax rates in Nebraska, and N. Sioux City, South Dakota is growing even faster (despite being less conveniently located):

Year     S. Sioux City   N. Sioux City

1990        16,742               10,189

2000        20,253              12,584

2010        21,006              14,399

2013/14   20,947               15,029

Growth    +25.1%             +47.5%

There’s good and bad news here for supply-siders.  The good news is that substantially lower tax rates may lead to faster growth in border areas.  The bad news is that this growth may involve merely a beggar-thy-neighbor effect, not true supply-side inducements to work, save and invest more.  Indeed it’s exactly this concern that has progressives in Europe worried about a corporate tax race to the bottom, and has them calling for minimum tax rates.  Is Brownback merely trying to steal jobs from Kansas City, Missouri, which is right on the state line?

In a recent interview, the governor pointed to a record number of Kansans employed in the private sector and a jump in new business starts, all while one of the state’s largest industries, aviation manufacturing, struggles. The governor added that employment is particularly strong along the Kansas-Missouri border, where it is easiest for businesses and people to cross state lines to respond to the tax cuts.

“It’s like going through surgery. It takes a while to heal and get growing afterwards,” Mr. Brownback said in his office, a painting of Ronald Reagan hanging behind him. “The left in the country desperately wants this to fail. They want to say, ‘You can’t cut taxes and grow your way out of things.’ “

Surgery, or stealing kidneys from one person and implanting them in another?

Here’s Brownback’s problem; Iowa’s top rate is 8.98% higher than South Dakota’s, whereas even after the tax cut Missouri’s top rate is just 1.4% above Kansas.  And Kansas is still 4.6% above Texas and South Dakota.  I believe Kansas will gradually steal some jobs from Kansas City, especially due to the elimination of taxes on small businesses.  But there won’t be any supply-side miracles.

If you look at cities using google maps, the old neighborhoods often follow a grid, and the newer suburbs have curvy streets.  If they are particularly affluent, the development will line a golf course.  That’s what happened across the river from Sioux City, in the only part of the metro area having any growth since 2000:

Screen Shot 2015-06-13 at 9.31.13 PMAnd here’s what Wikipedia has to say about the upscale community:

Dakota Dunes has five main neighborhoods including the Country Club Estates, the Meadows, the Prairie, the Willows, and Upscale Apartment Living.

Dakota Dunes is owned and developed by Berkshire Hathaway Energy of Des Moines, Iowa, which unveiled plans for the community in 1988.[4] The development is home to Dakota Dunes Country Club, a golf course designed by Arnold Palmer‘s design company.

I might have known the Sage of Omaha would be involved in this somehow.

And Wikipedia has this to say about Union county:

Union County is part of the Sioux City, IANE-SD Metropolitan Statistical Area. Progressive Farmer rated Union County second in the 2006 “Best Place to Live” in the U.S., because “its schools are good, its towns neat and its people friendly.”

I’m packing my bags right now.  (No one ever described Boston people as “friendly.”)  I can’t end this post without saying at least something good about Iowa.  The Wikipedia page for Sioux City has this picture of the courthouse:

Screen Shot 2015-06-13 at 9.37.00 PM

Tyler gives you pictures of ugly buildings that are actually sort of beautiful.  I make things easier for you; I give you pictures of attractive buildings that are actually kinda beautiful.

And since we are out in that area, I’ll bet not one American in ten could name America’s longest river (it’s not the Mississippi):

Screen Shot 2015-06-13 at 10.51.20 PM


Screen Shot 2015-06-13 at 10.33.15 PM