Archive for June 2014


The job market is improving faster for the least skilled

Some pessimists worry that we are merely creating “McJobs” for the least skilled. Others worry that most of the new jobs require lots of skills, leaving the unskilled without good prospects.  Most pessimists worry about both problems, even if it isn’t internally consistent.  Just as pessimists worry that machines will take the place of workers in Japan, and that there won’t be enough young people to take care of the elderly.

I’m an optimist; so let me take a stab at this Matt O’Brien comment that Tyler Cowen linked to:

Of course, “us” is a relative term. Unemployment fell from 3.3 to 3.2 percent for people with a bachelor’s degree or more, and from 5.7 to 5.5 percent for those with some college. But it actually rose from 6.3 to 6.5 percent for people with only a high school diploma, and from 8.9 to 9.1 percent for those without one.

In other words, our polarized labor market isn’t getting any less so. The Cleveland Fed points out that routine jobs disappeared during the Great Recession, and haven’t come back during the not-so-great-recovery “” which partly explains why our economic upswing, such as it is, has been much less dramatic for the least educated.

I certainly agree with Matt that the labor market is kind of lousy, despite the recent record set in employment.  But I also think one month is too short of time to draw any conclusions.  Let’s look at how the job market has improved for each of these groups, compared to the worst of the recession.  In each case, I look at unemployment rates for people above age 25 (because that’s all I could find, and because it seems more consistent):

Less that high school:   17.9% —> 8.5%

High school grad:   11.9% —>  6.1%

Overall:   9.2% —>  4.9%

Some college:    8.8% —>  5.5%

College grad:   5.3% —> 3.0%

The reduction in the unemployment rate has been much bigger for the less skilled workers.  You’d expect that given that they started at a much higher rate. Unemployment cannot go below zero.  But it’s also true that even the relative change has been considerably bigger for the less skilled.  The least skilled workers saw their unemployment rates fall by more than in half.  The high school grads by nearly half. The two college groups saw unemployment fall by even less.

Obviously in an absolute sense the less skilled are doing far worse.  But their abysmal job situation actually seems to be improving faster than for the more skilled groups.  It’s an easy mistake to make.  When I was young I often heard people say, “the rich get richer and the poor get poorer.”  Confusing levels with changes.  Actually, in 1969 the poor and working class had been gaining on the rich for 40 years.

Then and now (a picture’s worth . . . )

I often do posts ridiculing the idea that living standards have not risen since the 1960s.  I remember the 1960s, and living standards were obviously lower then. Studies show a dramatic decline in poverty level consumption since the 1960s.


The NYT has a new article that suggests poverty in America hasn’t changed since about 1967.  I almost laughed out loud when I saw the picture they choose to accompany the article:

Screen Shot 2014-06-05 at 1.32.04 PMFinally someone has found a way to make my point.  Today NYC spends $19,770 per pupil, the highest in the country among the top-100 system.  And although New York wastes plenty of money (why not hire people at $80,000 to teach 5 students apiece in their homes?) at least they get something for this money.  Here’s a random picture of a modern NYC school, pulled off the internet:

Screen Shot 2014-06-05 at 1.32.46 PM

That’s more like the 21st century.

Today America’s poor and very rich have far higher living standards than during the 1960s. The middle class is moderately better off.  Inequality is a problem, but it should be far down on our list—well below the arrest of 800,000 people last year for marijuana possession, or mass unemployment, or global warming.

Paul Krugman and I were both young during the 1960s.  Whenever you are young it’s going to seem like a Golden Age.  You have to look past those memories, and think about the reality.  My dad had fond memories of WWII.

PS.  My “teaching in homes” idea was sarcasm, so don’t bother explaining why it wouldn’t work.

So much for the zero bound

When the ECB raised rates from 1.0% to 1.25% in April 2011, the Keynesians told us that Europe was at the zero bound and thus needed fiscal stimulus. When the ECB raised rates from 1.25% to 1.5% in July 2011, driving the eurozone into double-dip recession, they told us that Europe was at the zero bound and thus needed fiscal stimulus.  When the ECB later cut rates from 1.5% to 1.25% we were told they were at the zero bound.  Ditto for the rate cut to 1.0%, and the rate cut to 0.75%, and the rate cute to 0.5%, and the rate cut to 0.25%, and the rate cut to 0.0%.

And today the ECB has cut rates to negative 0.10%.  I guess they are still at the zero bound?

A few observations:

1.  The market reaction in both the US and Europe seemed to be mildly positive, although I’d caution you that this move was widely expected, so we don’t really know how much impact it had. My sense is that eurozone policy is still relatively tight in absolute terms, and that the ECB is likely to undershoot its 1.9% inflation target for the next few years.

2.  I do feel more confident in predicting that eurozone rates will stay lower for far longer than US rates.  There’s an old saying, “if you want peace, prepare for war.” I don’t know about that, but for 5 years I’ve been saying that if you want higher interest rates then you need to cut interest rates.  And now the mainstream media seems to finally be catching up.  Here’s the FT:

When the governing council of the European Central Bank meets in Frankfurt on Thursday, it is widely expected to announce a loosening in policy – most likely a cut in both the refinancing and deposit rates. Two weeks later, the US Federal Reserve will probably respond to strengthening economic data by moving in the opposite direction, tapering the pace of quantitative easing for the fifth consecutive meeting. This is another sign of how monetary policy is diverging in the two largest economies, a trend that is set to shape funding markets for years to come.

When I advocated easier money in 2011 I was hammered by commenters worried about the interest income of old folks.  Well the ECB tried their approach—they raised rates.  And as a result the eurozone went back into recession and now faces a Japanese-style situation, near-zero rates as far as the eye can see.  Meanwhile the US is planning to start raising rates next year.  Just one more example of where us MMs turned out to be right and the conventional wisdom (especially conservative conventional wisdom) was wrong.

2.  People used to say the Fed can’t cut rates below 0.25%, for various reasons.  I think we now know those were excuses, not reasons.

3.  Some people argued that negative rates would be contractionary.  The markets don’t seem to think so.

4.  My first blog post (after the intro) mentioned negative IOR.  I also published articles in January and March 2009 suggesting that negative IOR is an option.  At a personal level, I’ve always wondered if I was the first to publish this idea in an economics journal.  A New York Fed article from 2009 that explained negative IOR did cite one of my articles.  Anyone know of any negative IOR articles before 2009?

Having said that, negative IOR is far from my first best choice.  Like Lars Christensen, I prefer NGDPLT, with price level targeting as a second best option. I prefer QE to negative IOR.  But I do think it’s better than nothing.  There are rumors the ECB plans to do more.  Let’s hope so.

PS.  Yes, I understand that the zero bound still holds for cash.  It would be interesting to see whether the ECB would allow reserve conversion into vault cash as a way of evading the zero bound.  My guess is that they’d apply the negative rate to vault cash if the holdings soared beyond a reasonable threshold.

Update:  Like Tyler Cowen and David Beckworth, I’m skeptical of proposals to eliminate currency.  In order of preference:

1.  A NGDPLT policy at a rate high enough to avoid the zero bound (say 5%.)

2.  A big central bank balance sheet, with NGDPLT at a lower growth rate.

3.  Negative IOR.

.

.

100.  Eliminating paper money.

I also agree with Tyler’s claim that the new ECB policy is “not enough.”

Reply to Mike Sproul

Mike Sproul has a new post (at JP Koning) that compares his “backing” theory of the value of money with my “quantity theoretic” approach.  (Just to be clear, market monetarism does not assume V is fixed, like some simple textbook models of the QTM.)

I’ve argued that US base money was once backed by gold, but no longer has any meaningful backing.  It’s not really a liability of the Fed.  Mike responds:

Scott’s argument is based on gold convertibility. On June 5, 1933, the Fed stopped redeeming FRN’s for a fixed quantity of gold. On that day, FRN’s supposedly stopped being the Fed’s liability. But there are at least three other ways that FRN’s can still be redeemed: (i) for the Fed’s bonds, (ii) for loans made by the Fed, (iii) for taxes owed to the federal government. The Fed closed one channel of redemption (the gold channel), while the other redemption channels (loan, tax, and bond) were left open.

The ability to redeem dollars for government bonds, at the going market price of bonds, has very different implications from the ability to redeem cash for a real good like gold, at a fixed nominal price.  I’d prefer to say cash can be “spent” on bonds, just as cash can be spent on cars or TVs. Indeed even during the Zimbabwe hyperinflation, the Zimbabwe dollar could still be “redeemed” for gold at the going market price of gold in terms of Zimbabwe dollars.  But that fact has no implications for the value of the Zimbabwe dollar.  If you increase the quantity of Zimbabwe dollars their value will fall, as they will buy fewer ounces of gold.  In contrast, before 1933 an increase in the quantity of US base money did not impact the amount of gold that could be purchased with one dollar (it was 1/20.67 ounces).  That’s the sort of “redemption” that matters for the price level.

Once we understand that both convertible and inconvertible FRN’s are a true liability of the Fed, it is easy to see that the quantity of inconvertible FRN’s could also be increased by any amount, and as long as the Fed’s assets rose in step, there would be no effect on the value of the dollar. (There is a comparable result in Finance theory: that the value of a convertible call option is equal to the value of an inconvertible call option.)

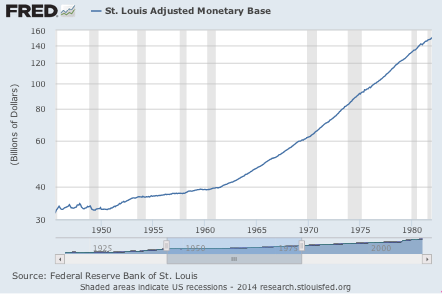
I don’t agree.  If the Fed doubles the monetary base by purchasing an equal amount of government debt at going market prices, the price level will double in the long run.  This is why I don’t accept the backing theory–I believe it is rejected by the evidence.  Here’s just one example.  In the early 1960s “Phillips Curve” ideology took root in America.  It was (erroneously) decided that we could trade-off more inflation for less unemployment.  So the Fed exogenously increased the monetary base at a much faster rate after 1962.  At first RGDP growth rose, then both RGDP and inflation, but eventually all we got was the Great Inflation, with no extra output.

Screen Shot 2014-06-04 at 11.06.05 AM

We can also observe the inflationary impact of open market purchases of bonds by looking at the response of financial market indicators.  If OMOs didn’t matter because the new money was fully backed, then financial markets would shrug off any Fed money printing. Indeed we can ask how central banks were able to achieve roughly 2% inflation once they set their minds to it.  Keep in mind that 2% inflation is not “normal.”  There is no normal inflation rate. Inflation averaged zero percent under the gold standard, and 8% from 1972 to 1981.  Then about 4% from 1982 to 1991.  Much more in some other countries.  There is no normal rate of inflation. In a related note, here’s Nick Rowe criticizing John Cochrane’s fiscal theory of the price level:

The Bank of Canada has been paying interest on reserves for 20 years. And when it wants to increase the inflation rate, because it fears inflation will fall below the 2% target if it does nothing, the Bank of Canada lowers the interest rate on reserves. And the Bank of Canada seems to have gotten the sign right, because it has hit the 2% inflation target on average, which would be an amazing fluke it if had been turning the steering wheel the wrong way for the last 20 years without going off in totally the wrong direction.

The Great Inflation was certainly not caused by deficits, which became much larger after 1981, precisely when the Great Inflation ended.  It was caused by printing money and buying bonds with the newly-issued money.

Mike continues:

But if the Fed issued billions of new dollars in exchange for assets of equal value, then I’d say there would be no inflation as long as the new dollars were fully backed by the Fed’s newly acquired assets. I’d also add a few words about how those dollars would only be issued if people wanted them badly enough to hand over bonds or other assets equal in value to the FRN’s that they received from the Fed.

This is where things get sticky, because Scott would once again agree that under these conditions, there would be no inflation. Except that Scott would say that the billions of new dollars would only be issued in response to a corresponding increase in money demand.

No, that is not my view.  The Fed might well increase the money supply even if the real demand for money did not rise.  There is always some price of bonds at which the Fed can induce people to exchange bonds for cash, even if they do not want to hold larger real cash balances.  They’ll spend the new cash almost immediately after being paid for the bonds.  That’s the famous “hot potato effect” that underlies the quantity theory.  I’d point to the 1960s and 1970s as an example of the Fed injecting new money in the economy far beyond any increase in desired real cash balances.

Scott is clearly wrong when he says that the backing theory doesn’t have much predictive power. It obviously has just as much predictive power as Scott’s theory, since every episode that can be explained by Scott’s theory can also be explained by my theory.

This is a tough one, because the identification problem is obviously a big problem in macro.  Not everyone might accept my claim that the Great Inflation was caused by an exogenous increase in the base, or my interpretation of market reactions to money announcement shocks, or my claim that successful 2% inflation targeting supports the assumption that Fed OMOs influence the price level.  But I wouldn’t say the QTM has no extra predictive power, rather it has predictive power that might be contested.  Central bankers would be in the best position to test the theory, as they can engineer exogenous changes if they wish.  I suspect that fact explains why most central bankers don’t adhere to the backing theory.  They think they see signs of their power.

Mike ends with 4 specific objections to the QTM:

(i) The rival money problem. When the Mexican central bank issues a paper peso, it will get 1 peso’s worth of assets in return. The quantity theory implies that those assets are a free lunch to the Mexican central bank, and that they could actually be thrown away without affecting the value of the peso. This free lunch would attract rival moneys.

We occasionally do observe rival monies taking hold during extreme hyperinflation. The mystery is why doesn’t it happen with other inflation episodes.  Fiat currencies have survived some pretty high rates of trend inflation, especially in Latin America.  My best guess is the answer is “network effects.”  There are huge efficiency gains from using a single currency in a given region.  It’s hard to dislodge the incumbent.

(ii) The counterfeiter problem. If the Fed increased the quantity of FRN’s by 10% through open-market operations, the quantity theory predicts about 10% inflation. If the same 10% increase in the money supply were caused by counterfeiters, the quantity theory predicts the same 10% inflation. In this topsy-turvy quantity theory world, the Fed is supposedly no better than a counterfeiter, even though the Fed puts its name on its FRN’s, recognizes those FRN’s as its liability, holds assets against those FRN’s, and stands ready to use its assets to buy back the FRN’s that it issued.

When I teach monetary economics I ask my students to think of the Fed as a counterfeiter.  I say that’s the best way to understand monetary economics.  And there is some ambiguity to the “stands ready” in the final line of the quotation. Was that true during the Great Inflation?

(iii) The currency buy-back problem. Quantity theorists often claim that central banks don’t need assets, since the value of the currency is supposedly maintained merely by the interaction of money supply and money demand. But suppose the demand for money falls by 20%. If the central bank does not buy back 20% of the money in circulation, then the quantity theory says that the money will fall in value. But then it becomes clear that the central bank does need assets, to buy back any refluxing currency. And since the demand for money could fall to zero, the central bank must hold enough assets to buy back 100% of the money it has issued. In other words, even the quantity theory implies that the central bank must back its money.

There are two ways to address this.  One possibility is that the central bank does not reduce the base when needed to hit a particular inflation target.  That describes the 1960s and 1970s. But what about when they are successfully targeting inflation at 2%?  In that case they’d need some assets to do open market sales, but they might well get by with far less than 100% backing.  The last point (about a 100% fall in money demand) feeds into his final objection:

(iv) The last period problem. I’ll leave this one to David Glasner:

“For a pure medium of exchange, a fiat money, to have value, there must be an expectation that it will be accepted in exchange by someone else. Without that expectation, a fiat money could not, by definition, have value. But at some point, before the world comes to its end, it will be clear that there will be no one who will accept the money because there will be no one left with whom to exchange it. But if it is clear that at some time in the future, no one will accept fiat money and it will then lose its value, a logical process of backward induction implies that it must lose its value now.”

There are two possibilities here.  One is that the public never believes the world will lend with certainty, rather that each year there is a 1/1000 chance of the world ending.  In that case people would still hold cash as long as the liquidity benefits exceeded 0.10% (10 basis points), which seems quite plausible given the fact that people still hold substantial quantities of cash when inflation reaches double digits.

Now let’s consider a case with a definite end of the road, say the German mark or French franc in 2001.  In that case the public would expect redemption for a alternative asset with a relatively similar real value (euros in the case.)  I’m actually not sure whether it matters if the central bank holds the assets used for redemption, rather than some other institution like the Treasury.  But yes, they would expect some sort of backing in that case.  But even so, OMPs will still be inflationary, which contradicts the claims made by backing proponents.

One final point.  We all agree that gold need not be “backed” to have value.  The QTM implicitly thinks of cash as a sort of paper gold.  It’s a real asset that has value because it provides liquidity services.  As an analogy, gasoline makes cars go.  Motor oil doesn’t propel a car forward.  But motor oil has value because it lubricates engine parts.  It’s harder to model the value of motor oil than gasoline, because the advantages are less obvious.  Similarly, it’s harder to model the value of cash than gold or houses or stocks.  But cash lubricates transactions, and hence a medium of exchange has value.  But once you have that monetary system in place, having twice as much cash adds no extra value.  Instead all prices double, and the value of cash falls in half.  It’s the monetary system that has real value.

Short comments

1.  Unemployment is falling very fast.  Since December 2012 the unemployment rate has fallen from 7.9% to 6.3%.  That’s really fast, 1.6% in 16 months.  By comparison, between February 1984 and April 1987 the unemployment rate fell from 7.8% to 6.3%.  That’s really slow, 1.5% in 38 months.  In the Clinton boom it fell from 7.8% to 6.4% in 22 months.  Tyler Cowen links to a post that predicts further fast declines in unemployment.  The post says the conventional wisdom is that unemployment will level off in the low 6s.  But why is this the conventional wisdom?  Why won’t it keep falling?

[And don’t say the unemployment rate doesn’t measure the actual condition of the labor market. That has no bearing on whether this (highly flawed) indicator will keep falling.]

Monthly household data is erratic—in my view the next three payroll numbers will tell us a lot about the US labor market.  By the fall I’ll probably have a new view of the economy, perhaps with some mea culpas.  At least if we get sub-200,000 or over 275,000 payroll numbers for the next three months.

2.  It’s all about the life cycle.  For years I’ve been arguing that income inequality and wealth inequality data is almost meaningless, for all sorts of reasons.  One is life-cycle effects.  Arnold Kling has an excellent article that discusses a recent study that shows that while only 67% of Americans own homes at the moment, 89% have purchased homes by age 55.  Very few Americans go through life without being homeowners.

Recall the study that showed 73% 0f Americans are in the top 20% at some point during their lives.  And Dems wonder what’s wrong with Kansas!  What wrong with economists who don’t understand life-cycle effects?

3.  Ashok Rao has a great post skewering the attitudes of the eurozone elite.  This elite used to insist the ECB not ease policy to boost recovery because they needed to focus like a laser on 1.9% inflation.  Now that inflation is only 0.6% and the ECB has announced a plan to do exactly what the elite claimed to want, you get questions like this from the centrist paper Die Zeit:

Prices and wages in den crisis countries had risen far too rapidly over many years. The low rate of inflation helps companies there to regain competitiveness vis-à-vis rivals in the north. Why do you want to counter that?

The only mystery here is why the ECB official didn’t merely respond with “never reason from a price change.”  I can’t believe I’ve reached the point of defending the ECB.  Has it gotten that bad?

4.  Lorenzo has a great post on banking instability:

Something that is very clear, is that “de-regulation” is a term empty of explanatory power. All successful six have liberalised financial markets–Australia and New Zealand, for example, were leaders in financial “de-regulation”. If someone starts trying to blame the Global Financial Crisis(GFC) on “de-regulation”, you can stop reading, they have nothing useful to say.

He also has interesting things to say on the “small is beautiful” argument for small countries.

5.  In an earlier post I discussed Thomas Piketty’s claim that “all the historical data” showed that workers real wages had done poorly during the early stages of the industrial revolution.  Mark Sadowski left a comment that clearly shows this is a highly contentious issue.