Archive for March 2013


Spending 60 Minutes in China

[I wrote this a few days ago, but figure I better post it now, as Michael Darda just sent me a similar story.]

I don’t watch much TV, but ran across a couple episodes of “60 Minutes” on the internet.  The interview of Zhang Xin by Leslie Stahl was quite interesting.  She and her husband have developed some architecturally interesting projects in Beijing.  (I recently visited a couple of them.)

I was less impressed by their story on the Chinese ghost towns.  The Binhai financial district (Yujiagu) was described as “all but abandoned.”  Does that mean not abandoned?  Waiting for all the infrastructure scheduled to link it to downtown Tianjin in mid-2014?  China has more than four times the US population, and Tianjin is expected to be the financial center of the north (just as Shanghai is the financial center of the east, Shenzhen in the south, and perhaps eventually Chongqing in the west.)  Why shouldn’t China have 4 Wall Streets?

Shanghai’s Pudong district was viewed as a bubble in the early 2000s; now those predictions look laughable.  Shanghai has built far more office space since then and still has a low vacancy rate.  How about an apology from those predicting a Shanghai bubble back in 2001, or at least a little more humility in future predictions. Instead all we got was smug “analysis” about how naive the Chinese home-buyers are.

Their China “expert” (a westerner) said the average Chinese person makes $2/day–which is wildly out of date.  He said the housing being built was much too fancy for the average person to afford.  OK, but then what happens if prices crash to the point where the housing is affordable?  Chinese incomes are doubling every 7 years, and hundreds of millions of people will eventually move from the countryside to the cities.  Given that housing is quite durable and China will be much richer in the future, should China be building lots of housing suitable for poor people making $2/day, or housing suitable for the China of 2035?  And don’t the Chinese make large down-payments?  What is the risk to the Chinese banking system?  My hunch is that banks face bigger losses from SOEs than home buyers.

They pointed to a “ghost town” development in Zhengzhou, which is capital of a province of 90 million people.  I’d expect its current population (4 million in the urban area) to grow to 10 to 20 million in a few decades.  How much longer will that development seem unneeded?

How about fully developed and non-communist (ethnically) Chinese cities like Hong Kong, Taipei, Singapore, sections of Vancouver.  What do house prices look like in those locations?

I don’t have all the answers, and even I wonder why they are building the Binhai development so far from downtown Tianjin.  But I also wonder how much of this analysis is filtered through our own experience with our own real estate “bubble.”  But then we didn’t have 500 million people ready to move from the countryside to our cities; indeed we only have 3 million farmers left.  Nor do we have NGDP growing at double-digit rates.

(Actually we might have 500 million peasants wanting to move here–but they are not allowed into the country.)

PS.  I should probably say something on Cyprus, but am not well-informed.  Tyler Cowen has several good pieces.  I will say it seems odd to suddenly stiff small depositors who thought they were covered by deposit insurance.  I favor reforming deposit insurance in a way that limits its coverage, but not retrospectively.  Are there risks of contagion?  I don’t know.  It’s weird suddenly being on the “left” on an issue for which I’ve spent my whole life being an outlier on the “right.”

PPS.  The comments don’t seem to work for this post—so you can leave any comments at the end of the previous post, or then next one once it’s put up.

Money matters

I’ve been thinking about how to teach monetary economics from the beginning.  Perhaps before people start learning, they need to unlearn things they believe, that just ain’t so.  We market monetarists believe that monetary shocks (or “disequilibrium” if you prefer) is the primary cause of business cycles, indeed almost the only cause of big swings in unemployment.

Most people don’t believe this; indeed it’s not even clear that most economists believe this.  Instead the average person thinks recessions are caused by big real shocks, or financial shocks, of one sort or another.  Asset bubbles bursting, 9/11, stock market crashes, devastating natural disasters, etc.

It’s surprisingly easy to dispose of these real theories.  We know that 9/11 didn’t cause the 2001 recession, because the recovery started just 2 months later.  The biggest stock market crash in my life was 1987, which was almost identical to 1929, including the subsequent stock price rebound.  The biggest natural disaster to hit a rich country in my lifetime was the 2011 Japanese earthquake/tsunami/nuclear meltdown, which killed tens of thousands of people, devastated a sizable area of Japan, and caused their entire nuclear industry (25% of total electrical output) to shutdown for more than a year (causing brownouts.)

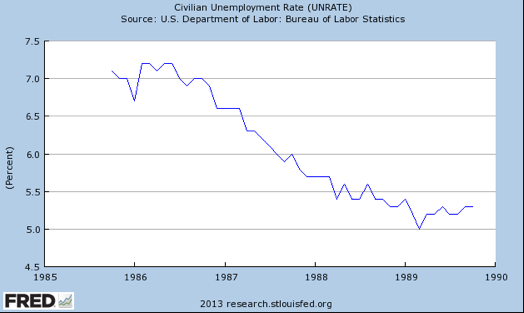
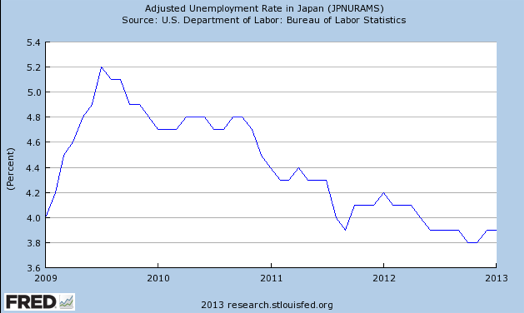
The next two graphs show the US unemployment rate from 2 years before the October 1987 crash to 2 years after, and the Japan’s unemployment since January 2009 (the tsunami was March 2011):

Screen Shot 2013-03-15 at 9.09.23 PM


Screen Shot 2013-03-15 at 9.07.38 PM

What do you see?  Nothing!!!  I’m tempted to say “real shocks don’t matter.”  But that would be incredibly insensitive for 9/11, or the tsunami that killed nearly 30,000 Japanese people.  One could argue that nothing mattered more to these two countries, in 2001 and 2011.  The stock crash wasn’t as traumatic, but certainly impacted people’s lives and outlook.

But these real shocks don’t matter (very much) for business cycles.  The tsunami did cause a temporary dip in industrial output, but nothing severe enough to constitute a recession.  However when you turn your attention to the labor market you can really see how little real shocks matter.  Real shocks do not cause big jumps in unemployment.  Period, end of story.  Even I’m surprised by this fact, but it is evidently true.  Recessions are caused by unstable NGDP, which is in turn caused by unstable monetary policy (by definition, as stable NGDP growth is my definition of a stable monetary policy–and Ben Bernanke’s too.)  But it’s not a tautology that the recessions themselves are caused by monetary policy, indeed it’s surprisingly difficult to explain why NGDP instability causes unemployment to fluctuate so much.  Especially when the NGDP shocks are caused by rather obvious changes in monetary policy, rather than “errors of omission.”

Another example is January 2006 to April 2008, when housing construction in the US collapsed, falling by 50%.  What happened to unemployment?  It rose from 4.7% to 4.9%.  The worst clearly non-monetary shock in my lifetime was the nationwide steel strike of 1959, which caused unemployment to rise by 0.8%.  But the smallest recession in my lifetime was 1980, where unemployment rose by 2.2%.  The steel strike ended quickly and unemployment fell back down to where it was before the strike.  (The two 1970s oil shocks are debatable.)

We’ve seen that most people, and even some economists, grossly overestimate the importance of real shocks in the business cycle.  On the other hand most people, and some economists, grossly underestimate the importance of monetary shocks.  Now that we’ve disabused everyone of the notion that non-monetary shocks cause recessions, it’s time to move on the to real cause (pun intended) of business cycles—monetary policy.  In a future post.

The wage paradox

Falling wages are a problem, a sign of a labor market that is out of equilibrium.  Falling wages are a solution, they help restore equilibrium in the labor market.

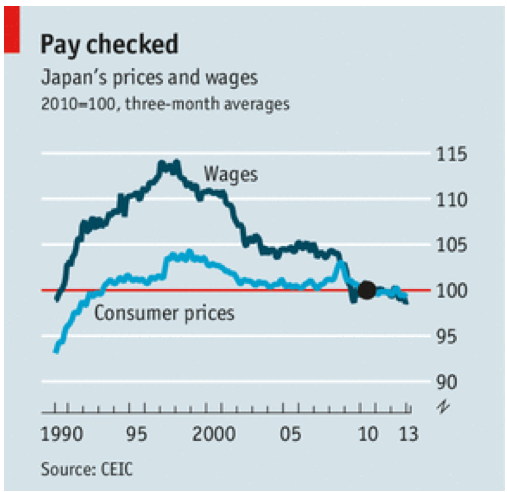
Both statements are defensible, and I think the best way to visualize business cycles is to try to hold both ideas in your mind at the same time.  This is from a recent article in The Economist:

In fact, they say, Mr Abe’s campaign may be primarily political. Having nominated a team of tough-talking money-printers as governor and deputy governors of the Bank of Japan, he is determined that the central bank should hit its new 2% inflation target. The problem is, if prices rise but wages don’t, workers will feel the pinch. That would not bode well for an upper-house election in July in which Mr Abe hopes his ruling Liberal Democratic Party will secure a majority in both chambers of parliament.

Hence the pressure applied by Mr Abe and his finance minister, Taro Aso, on big businesses to increase worker compensation. Amid signs of rising consumer sentiment and household spending in January, some have responded positively. Lawson, another convenience-store operator, said higher bonuses this year would boost the annual average pay of a worker with three school-age children by ¥150,000 ($1,600). Other firms, especially exporters benefiting from the falling yen, are likely to agree to union demands for higher bonus payments in annual pay talks this spring.

But Keidanren, the main big-business lobby, has remained cool, saying it wants to see more sustainable profit growth before its members agree to basic-pay increases, which are harder to reverse than bonus payments. Masamichi Adachi of J.P. Morgan says overtime and bonus payments are likely to rise before core salaries do. He says that, rather than higher inflation expectations, the country needs higher growth expectations before companies commit to permanent wage increases. As it is, a planned rise in the consumption tax next year is likely to offset some of the effect of a big fiscal stimulus this year, which means growth may flatten in late 2014.

Screen Shot 2013-03-13 at 9.27.05 PM

That’s quite an interesting graph.  I see three downshifts in nominal wage rates; the after-effects of the 1997 East Asia crisis, the 2001 tech recession, and the global 2008-09 recession.  Because nominal wages are sticky, and only some adjust each month, a falling nominal wage rate means (surprisingly) that some other wages are too high.  Thus falling nominal wages are often associated with rising unemployment.  And I believe that’s true in Japan.

But once wages have fully adjusted, unemployment can go back to the natural rate.  On the other hand absolute wage cuts are difficult to make, so the Japanese unemployment rate is probably still a bit above the natural rate.  (Note that Japan traditionally has very low unemployment, and some argue that the actual unemployment rate is higher than measured unemployment.)

If Abe’s policy is successful then wages may rise a bit, but it would be a mistake to put the cart before the horse.  You’d like wages to rise because of a stronger economy, higher NGDP growth, not because of political pressure. Indeed if wages are forced up artificially that might raise unemployment in Japan.

Also note that Japanese real wages have fallen by about 10% since the 1990s.  Japan isn’t doing well, but then neither are the other developed countries (with a few exceptions like Australia and Canada.)  Ultimately the key is growth. If monetary stimulus raises RGDP growth, real wages might actually do better than under a tighter monetary policy with lower inflation.  Notice that real wages leveled off during the 2002-06 QE program, which temporarily halted the deflation.  Once again, it’s not a zero sum game.  A bigger pie could mean higher real incomes, at least in the long run—even if inflation rises.

PS.  I know that some models predict monetary contraction will raise real wages, but what if it forces young people into the informal economy, where productivity is much lower?

Your mission, should you decide to accept it …

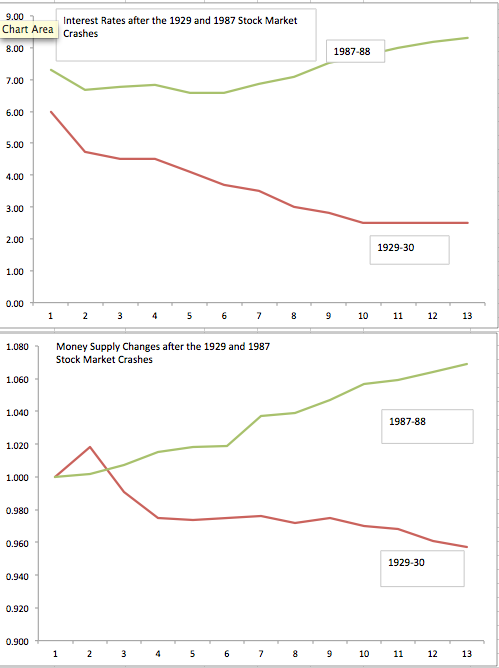
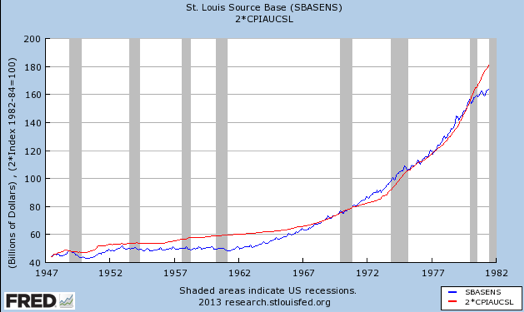
. . . is to compare and contrast the October 1929 and October 1987 stock market crashes.  The two crashes were almost identical; and in both cases the market recovered a bit over the next 6 months.  The 1929 crash was followed by the Great Depression and the 1987 stock market crash was followed by years of rising RGDP and falling unemployment.  You’ve decided to focus on the fact that the Fed was expansionary after the 1987 crash whereas Fed policy was contractionary after the 1929 crash.  You are allowed to use only one PowerPoint slide.  Which one do you pick to show your audience that the Fed did the “right thing” after the 1987 crash, and the “wrong thing” after the 1929 crash:

Screen Shot 2013-03-14 at 1.53.57 PM

In both graphs time=1 is October 1929 and October 1987, whereas time=13 is October 1930 and October 1988.  The money supply is the monetary base (indexed to 1.0 in month 1).  Which slide would you use to convince your audience that money was too tight after the 1929 crash, but not after the 1987 crash?

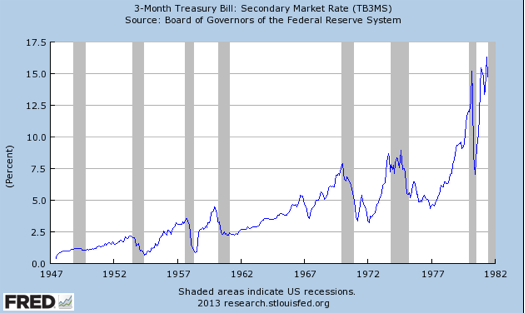
Let’s try another.  You’d like to do a PowerPoint presentation explaining the Great Inflation.  You are allowed to use only one slide, and you’d like to show how Fed policy became much more expansionary during the 1960s, leading to high and rising inflation from the mid-1960s to 1981.  Which slide do you choose?

Screen Shot 2013-03-14 at 2.07.12 PM

Screen Shot 2013-03-14 at 2.09.09 PM

A triumph for monetarism?  Far from it.  The monetary base is a lousy indicator of the stance of monetary policy.  For instance, the base rose rapidly between October 1930 and March 1933, even as prices and NGDP plunged sharply lower.  And we all know it’s been a horrible indicator since October 2008.

So what’s my point?  As bad as the base has been, it’s still a much better indicator than the short term nominal interest rate.  Interest rates aren’t just “lousy,” they are flat out horrible indicators.  Appallingly bad.  Atrocious.  Useless.  No, less than useless, they offer negative value added.  More likely to be wrong than right.  If someone put a gun to your head and you had to use interest rates, you’d want to use it as a reverse indicator.  You’d be better off assuming low rates meant tight money and high rates meant easy money.  That’s how bad it is.

Milton Friedman knew this long ago.

PS.  I’ve started work on two projects.  One is an online money class, and the other is a book based on my blog.  I will start assembling graphs that illustrate market monetarist arguments, and this post is the beginning of that process.  I’ll do other posts on occasion as I assemble more graphs.  Feel free to provide suggestions, or criticize my posts if you think they are misleading or confusing.

I will occasionally use inflation rather than NGDP, because I am also aiming for something accessible as an intro to money for undergrads.

PPS.  Today I was interviewed by both the BBC (radio) and the WaPo.  For Chinese readers there is an article on me in iMoney, a HK financial publication.  It’s in Chinese.

Here we go again

From CNBC:

No Money? No Worries. Home Lenders Ease Rules

As housing heads into the critical spring market, credit is finally beginning to thaw. Lenders are increasingly approving low down payment loans, and government sponsored mortgage giant Fannie Mae is buying more of them.

It is a noticeable shift from the last four years, when 20 percent down on a home purchase loan was the only game in the neighborhood.

PS.  I appreciate the nice comments from people on my Keynesian-bashing post, but I regret my remarks claiming that most economists don’t understand the monetary offset problem.  I can’t really know that, and as Matt Rognlie pointed out my analysis wasn’t technically correct either.  Sometimes I let my frustration get the upper hand.

But I still think my counterfactual is plausible.