

Why no flu in the antipodes?
That’s the first time I ever typed the word “antipodes”.
This graph in The Economist caught my eye:
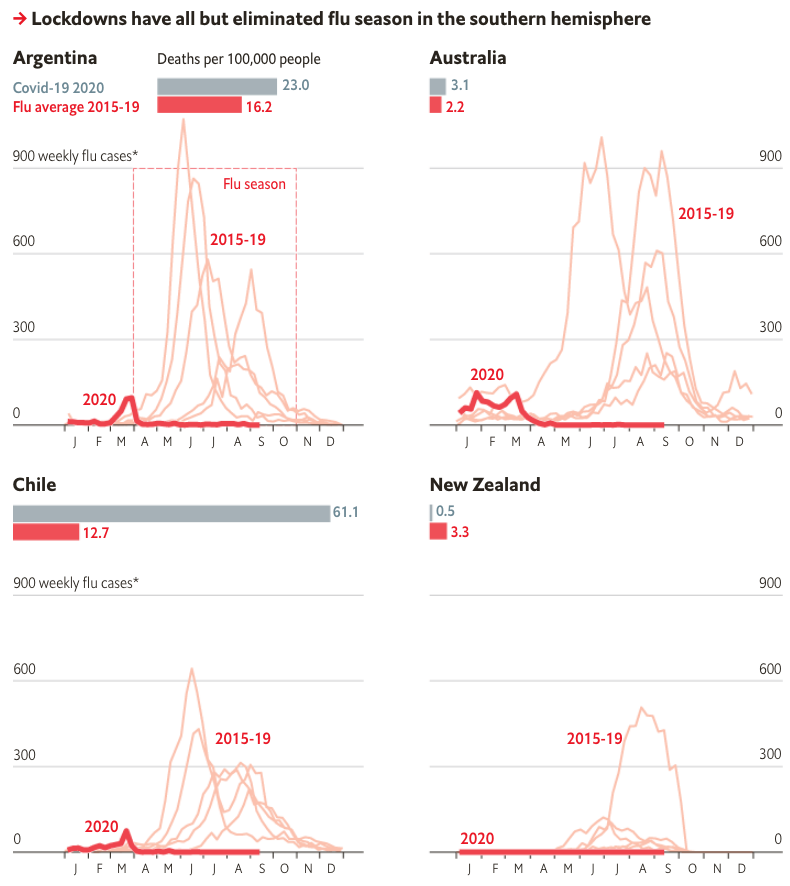
At one level the answer might be obvious. Steps taken to control Covid-19 had the side effect of almost eliminating the southern flu season. Here’s Australia, for instance:
Data from Australia tell a remarkable tale. From May to mid-August of 2015-19, an average of 86,000 Australians tested positive for the flu each year, and around 130 died of it. This winter the government has registered only 627 influenza infections and just a single death.
But these countries were significantly impacted by Covid. Australia wasn’t hit too hard, but did have 875 deaths, and Chile’s been hit even harder than the US.
Maybe the international travel restrictions prevented the flu from ever reaching these countries. But then how do you explain the Australian data showing 627 flu infections? And why didn’t those same international travel restrictions prevent Covid-19 from arriving?
The only explanation that I can think of is that the flu is far less contagious than Covid-19. Social distancing worked really well against the flu. (Dear God, I hope that doesn’t give the public health authorities any ideas!) Are there any other explanations that I missed?
One thing we now know for sure; Covid is not “just the flu”.
PS. Notice that Australia’s normal rate of flu deaths (130/year) is more than an order of magnitude lower than in the US, even in per capita terms. But then some people question the US flu mortality data.
PPS. This was a lot of fun to read.
Tags:
27. September 2020 at 23:01
I don’t have a unifying theory for the southern hemisphere.
However, in Australia 18 million influenza vaccines were offered this year (out of a population of 25 million. I don’t have New Zealand’s numbers, but there was lots of early uptake.
Given herd immunity for influenza is typically 35-45%, the vaccination campaign may well have surpassed that considerably. Add in extra hygiene and social distancing, less infected travelers etc would logically reduce infections.
27. September 2020 at 23:14
I’m in Australia at the moment (normally live in NYC but hiding out here since May). I’ve been very surprised how seriously Australian citizens and businesses are taking social distancing and hygiene, even in places like regional Queensland that haven’t had a single case of covid for many months now. Where there is a cluster, everyone starts wearing masks. So, not surprised this had an impact on flu. Feels like they push the flu vaccine much harder here than in the US too (eg it is mandatory for my 3 year old daughter to have it or she can’t attend daycare, must have it to visit a care home, etc etc – not sure this is the case in much of the US).
28. September 2020 at 02:47
Perhaps the flu data (specially mortality) are only estimated at the end of the year?
28. September 2020 at 04:02
“At one level the answer might be obvious. Steps taken to control Covid-19 had the side effect of almost eliminating the southern flu season.”
Covid-19 wasn’t controlled by any steps (apart from Taiwan and New Zealand that managed to keep it almost entirely out of the country) as the “no lockdowns, no masks” Swedes have demonstrated. The flu hasn’t been controlled, either. Covid-19 has been a dominant coronavirus this year and competes with other coronaviruses, some of which cause the flu.
Covid-19 is going to be considered a type of flu and already is according to some epidemiologists. One said in summer “Covid-19 may not be the flu, but it sure acts like it in several ways. Johns Hopkins’ epidemiologist Amesh Adalja said in March that this coronavirus will join the other four that cause the flu in people as it competes with the other four as part of the evolution process.
When H1N1 was a small pandemic in 2009 – Neil Ferguson and the WHO predicted 60,000 British deaths and only 500 died – two Australian health agencies reported about 100 and 200 deaths, whereas the CDC used a computer model that gave 8,000 to 18,000 U.S. H1N1 deaths, which is a huge per capita difference with Australia (and Japan and South Korea with 100 to 200 deaths each.)
Yet a paper argued that when the 150 or so H1N1 Australian deaths are fed into the U.S. model, there were really 1,600 deaths and is at the high end of the U.S. range per capita: 1,600 deaths X 13 = 20,800 modeled deaths.
Wiki: “Sources say that as many as 1600 Australians may have actually died as a result of this virus.[11][12]”
28. September 2020 at 08:26
I think the answer here is just that the data is bad. Flu deaths being classified as COVID deaths; or, since COVID testing is widespread, and flu testing is not, people with both diseases are classified as dying of COVID.
This is related to the fact that the annual flu death count is sort of made up: https://slate.com/technology/2009/05/the-math-behind-estimating-seasonal-flu-deaths.html
28. September 2020 at 10:24
With respect to the Trump tax returns it is now obvious Trump leaked his 2005 tax return to the liberal media and the liberal media played right into Trump’s hands by thinking they had a scoop. The liberal media should have held onto it longer and consulted with financial experts before releasing it publicly because my takeaway from his 2005 tax return was that prior to The Apprentice Trump must have been having some serious cash flow issues because 2005 cash flow only looked good because of The Apprentice income.
28. September 2020 at 11:11
Todd, Flu death rates are almost completely unreliable. Nobody knows if my dad died of the flu, so how could the aggregate data be accurate?
You said:
“The flu hasn’t been controlled,”
So you don’t believe the data? Then why do you provide lots of data in your comment? Why should we believe that data? Why believe any data? Or should we only believe data that aligns with your preconceived ideas?
And the Swedes haven’t demonstrated anything useful.
28. September 2020 at 12:09
I have discovered a new kind of unemployment.
Hello everybody, I have an article that explains why since 2000: business investment has been weak; the fall in the U.S net labor share; the decline in the prime age U.S labor participation rate vs large gains elsewhere; the rise in deaths of despair. The article is called Skill Stalagmites, Technology Stalactites and can be found here https://seekingalpha.com/article/4361570-skill-stalagmites-technology-stalactites. I have split the piece into two parts: a 1500 word article for the general reader and a longer piece for the more sophisticated reader. There is a link to the latter at the end of the first piece.
The punchline to the article is that the 4-5% gap in the lfpr between the U.S and peer economies is a form of disguised unemployment. And this is a novel kind of unemployment, which is not caused by a fall in aggregate demand.
The actual cause is that firms are imposing higher effort levels on workers. I can summarize the argument you will find in the main article; it goes like this:
1. Firms impose higher effort demands on workers; workers have to complete more tasks (for a higher wage) or be fired.
2. The higher wage does not compensate workers for their lost work leisure; thus workers look for less demanding job positions (or refuse to move up to more senior roles).
3. If one imagines a skill ladder, then all workers attempt to drop down a rung. This is easy for higher skilled workers, but what happens to workers at the bottom?
4. The lowest skilled workers compete for job openings with somewhat more skilled workers. Firms prefer to hire the more skilled worker, resulting in the lowest skilled workers being pushed out of employment altogether.
5. This assumes that employers can always identify the highest skilled worker from their pool of applicants. This won’t always be the case; if the higher skilled worker has a bad interview or the weaker candidate has positive chemistry with the interviewer, then the objectively weaker candidate can win a job offer.
6. Thus provided the lowest skill workers are willing to keep searching for jobs they will eventually obtain a job offer and regain employment.
7. This means though that workers on the second lowest skill rung will be unable to drop down to the lowest rung unless they also increase their job search activity. And in turn this forces the workers above them to increase their job search.
8. Any person wanting a job now has to apply to many more job positions before they can get their first job offer. But after a string of failures, job seekers become discouraged and temporarily withdraw from the search process. It is this temporary withdrawal that is responsible for the drop in lfpr. For those who are the main breadwinners, the period of withdrawal will be short – perhaps only a few months. But for workers who are more marginally attached to the labor force, it could be years or forever.
9. Evidence for higher effort in the U.S can be found in the higher U.S productivity growth since 2000 vs peer economies.
10. Evidence of higher job search can be found in the elevated duration of unemployment, which in 2019 was still equal to recessionary levels. The American Time Use Survey also shows higher than normal time spent on job search.
The questions of why this is happening post 2000 and not before, and why only in the U.S and not elsewhere, are taken up in the full article.
Hope you enjoy reading and please do spread word of the article around.
Best,
Nathan.
P.S The article is published on Seeking Alpha, but don’t let that put you off. Though I don’t have a formal background in economics, I do keep up with the relevant literature.
28. September 2020 at 15:59
“You said:
“The flu hasn’t been controlled,”
So you don’t believe the data? Then why do you provide lots of data in your comment? Why should we believe that data? Why believe any data? Or should we only believe data that aligns with your preconceived ideas?
And the Swedes haven’t demonstrated anything useful.”
———
I’m sorry about your father.
Flu deaths are as questionable as Covid-19 deaths.
I was pointing out that in 2009, countries were counting flu deaths differently than Japan, Korea and Australia and maybe most of the world as a computer model had been used from 2003. Also, according to a paper, if you put Australia’s death count into that model, it becomes consistent as would South Korea and Japan.
The Swedes have demonstrated that no lockdowns give about the same result as voluntary social distancing when similar populations are compared. Sweden has also had a very low case increase for weeks without masks. Japan and France both had high mask use from early May through the present with very low 0.3% increases in cases a day but that rose to 4% a day for a week in Japan in August before declining to 0.7% a day and has been at 3% a day in late September in France. Did the masks lose their mojo?
29. September 2020 at 02:45
“Covid-19 has been a dominant coronavirus this year and competes with other coronaviruses, some of which cause the flu”
No coronavirus cause the flu (although some – four, I think – cause the cold).
29. September 2020 at 03:29
An epidemiologist said on a podcast that the four coronaviruses cause 15% of flu cases. Maybe he was wrong.