

The very real problem of wage inequality
A commenter pointed me to Krugman’s recent post on inequality, expecting me to respond that income inequality is meaningless. Well income inequality is meaningless, but Krugman’s post was on wage inequality, which is a real and growing problem. It’s not one of the top ten problems facing the country, but probably makes the top 20. (I’ll do a post on what I think are the big issues, in a few days.)
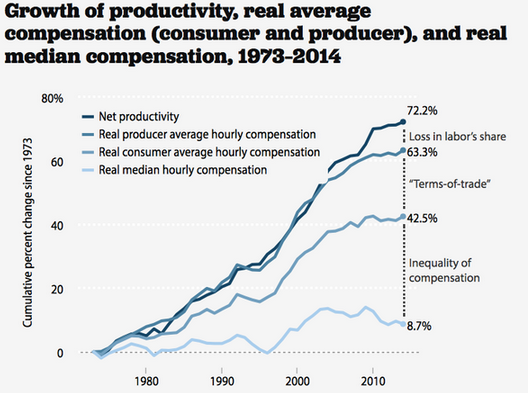
Krugman presents this graph:
 I have read some of the excellent work by Matt Rognlie and Kevin Erdmann, which looks at these issues in more detail. They found that some of the fall in wage share was going to implicit rents on owner-occupied homes.
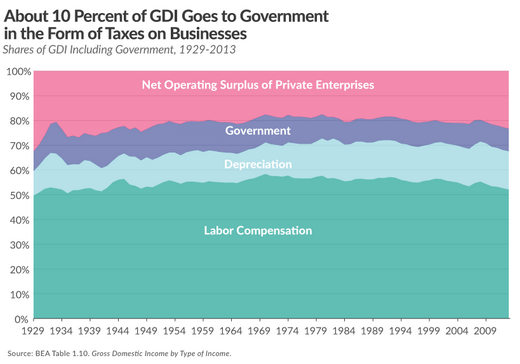
I decided to take a fresh look at the data for my own benefit, and compared current (GDI) income (2015:2) with income from 50 years ago (1965:2). The earlier period was the Golden Age of American labor.
And here’s what I found:
Type of (Gross) income Share in 1965 Share in 2015
Wages and benefits 54.6% 53.0%
Indirect taxes – subsidies 7.8% 6.6%
Net Operating Surplus 25.7% 24.9%
Depreciation 11.9% 15.6%
It seems silly to focus on gross domestic income, which includes depreciation and indirect taxes. If we subtract them out we get the more conventional measure of national income, the way most people envision the concept. And using that measure the labor’s share has been amazingly stable, rising from 68.0% in 1965 to 68.1% in 2015. Capital’s share fell from 32.0% to 31.9%. No change in 50 years! Is that too good to be true? Yes, for instance in 1990 labor’s share was 72.4%, so it’s just a coincidence. But it does suggest that labor’s share in the very long run is pretty stable.
So why the perception that workers are not doing well? Krugman points out (correctly in my view) that it’s an inequality story. Blue collar workers at GM and Ford are not doing as well as in 1965 (especially younger workers). Workers like Goldman Sachs executives, Tom Cruise and LeBron James are doing much better than in 1965. So the problem is not that “workers” are getting screwed by companies, but that worker income is itself becoming more unequal. That seems like a problem to me, but then I’m a utilitarian who doesn’t think Tom Cruise deserves a high wage income just because he was lucky enough to be born with a lot of charisma and ambition.
Let’s revisit the Jeb Bush tax plan. The structure of the plan is great; it does lots of wonderful things. It’s not my dream consumption tax, but it’s vastly better than the current system. But the left hates it. I believe the plan is so good that Bush should meet the objections of the left (not now of course, but in the very unlikely event he gets elected.) The obvious compromise is to keep the structure of the tax system as he proposes, but adjust the tax rates upward enough to make it both revenue neutral and progressivity neutral.
I normally ignore progressivity discussion in the media. Not because I don’t care about tax progressivity, but rather because no one knows how to measure tax incidence. Thus even though corporate taxes are not actually paid by corporations, it probably makes sense (politically) to set the new corporate tax rate at a revenue neutral level. Or perhaps revenue neutral given whatever growth boost the CBO estimates. And the top rate on personal income needs to be higher than 28%
Unfortunately, with taxes there will never be an end of history. The fights between the GOP and Dems will continue. But both sides should be willing to fight with a clean tax regime, not a monstrosity. You can still nudge the rates up or down, as the elections change who’s in power, but you’ll do so with a much simpler regime.
I’m enough of a supply-sider to understand why the right prefers low MTRs on the rich. But given the very real increase in wage inequality, and given that never in history has it been easier to make a billion dollars by age 30, I really think you need a tin ear to propose a massive tax reform that simultaneously lowers taxes on the group that has done so well in recent decades.
PS. Earlier I said I favor a zero top income tax rate. I still favor that. But that’s only if we have a fairly progressive consumption tax. This post assumes that’s too big a reach, and that this proposal is the best we can do.
PPS. Although I said Tom Cruise does not deserve a high income, I nonetheless want him to be very rich (for utilitarian reasons.) That’s because an economy that allows Cruise to be very rich will generate more good films for me to watch. So yes, he should be very rich, just slightly less very rich than he actually is. Let’s face it, if you get to have young women fawning all over you because you have the guts to do dangerous stunt work in James Bond type films, when you are in your fifties, you are pretty much the luckiest man who ever lived, even if you make the LA minimum wage.
Update: Kevin Dick sent me to this very nice graph:
Tags:
10. September 2015 at 13:22
“Blue collar workers at GM and Ford are not doing as well as in 1965 (especially younger workers).”
-Manufacturing workers are fewer, but their pay is still better (in absolute terms), just like for the average worker. The real victims here are information workers, construction workers, and trade, transportation, and utilities workers:
https://againstjebelallawz.wordpress.com/2015/09/06/how-high-would-a-federal-minimum-wage-have-to-be-to-cause-mass-unemployment/
“That seems like a problem to me, but then I’m a utilitarian who doesn’t think Tom Cruise deserves a high wage income just because he was lucky enough to be born with a lot of charisma and ambition.”
-Then nobody “deserves” anything, as life outcomes are mostly predetermined by genes and family position.
10. September 2015 at 13:34
In searching for the source data, I found these resources. In the first, Chart 5 seems to provide a graph over time of Scott’s point:
http://taxfoundation.org/article/walkthrough-gross-domestic-income
The second appears to be the FRED source table:
https://research.stlouisfed.org/fred2/release/tables?rid=53&eid=42185
10. September 2015 at 13:41
E. Harding, You said:
“Then nobody “deserves” anything, as life outcomes are mostly predetermined by genes and family position”
Yup.
Thanks Kevin, I added an update.
10. September 2015 at 14:00
Ironman at Political Calculations takes issue with the mathematics used to construct this graph.
See: http://politicalcalculations.blogspot.com/2015/09/mathiness-productivity-and-wages.html#.VfH8wtJViko
10. September 2015 at 15:09
I saw that too, chuck. Is the political calculations critique accurate, scott?
10. September 2015 at 15:16
Chuck and Kevin, The graph they are discussing is obviously meaningless, apples and oranges. But I can’t comment on the specific criticism they make as I don’t follow it.
10. September 2015 at 15:42
Ironman from Political Calculations comes around these parts every now and then. Maybe he can clarify.
10. September 2015 at 16:37
Excellent Sumner post, one of the best IMO in a while. Indeed the slowdown in productivity since 1973 can be parsed in misleading ways; see the Kevin Dick link for details. Also GDP/capita has been (except in 2008) been going up regardless of the slowdown in real wages, so the robots doing the work of people is helping us, perhaps unevenly (rich get richer), but still helping us. Sumner’s “trickle down” economics re Cruise also makes sense, as the rich save more of their income than the poor, and savings = investments down the road. Finally, in terms of GDP it was never clear to me why wages are that important, or more so than profits to firms, I surmise it must be due to Keynesian assumptions. Put another way: if a firm has to fire workers during a downturn, but it was bloated anyway (more workers were added during good times than were necessary), why is that bad long term? It’s cutting out the corporate deadwood, as any Austrian will tell you (no pain, no gain).
10. September 2015 at 18:37
Doesn’t inflation influence the distribution of wages ? Doesn’t inflation keep median real wages in check, while allowing the appearance of a large positive tail in the wage distribution ? Has anybody studied that?
11. September 2015 at 01:16
Let me slip in here, since this is one of the few empirical questions where I can claim some degree of proficiency. : )
The bottom line is that Scott is absolutely right: the essential force here is inequality within labor.
This might already seem clear from Krugman’s graph (taken from a recent EPI paper by Bivens and Mishel): there, “inequality of compensation” is responsible for a larger fraction of the purported gap than either “terms-of-trade” or “loss in labor’s share”. But even this is still misleading: the graph makes the latter two forces look much larger than they actually are, thereby overstating the overall gap and underplaying the dominant role of changes in the distribution of labor income.
First, as Scott observes directly, the net labor share of factor income is remarkably stable in the very long run, and indeed was similar in the mid-60s to its current level. The EPI graph misses this because it starts in 1973 (when its median wage series becomes available), right after a spectacular rise in the labor share that took place in the late 60s.
Now, in the last 15 years, we’ve seen a sizable decline in the net labor share, bringing us back down to slightly below the average of the 50s and 60s. Part of this may be cyclical, since the share typically falls in aftermath of a recession. If it doesn’t recover, I’ll be somewhat concerned, but even then the long-term hit to median earnings from this source is almost infinitesimal compared to the role of within-labor inequality.
(You can see the evolution of the net labor share in the corporate sector, avoiding complications from proprietor’s income and housing, here: https://research.stlouisfed.org/fred2/graph/?g=1Ooc
As I’ve discussed elsewhere, housing makes the long-run picture look somewhat worse, though not to the same extent in the US as in many other developed countries. Unfortunately, I can’t provide a nifty fred link adding housing to the previous graph, because the relevant national accounts data is in NIPA table 7.4.5 and fred sadly doesn’t include that yet.)
11. September 2015 at 01:17
The other major component of the EPI graph is the “terms of trade” wedge, which is meant to be the gap between the price index for workers’ net output and the price index for their consumption. It’s important to emphasize that this is almost all spurious. This is clear enough from a quick sanity check – if you directly compare the behavior of the price indices for net domestic product (NDP) and personal consumption expenditures (PCE) since 1973, you’ll see that they have moved roughly in tandem: https://research.stlouisfed.org/fred2/graph/?g=1OoA
[Some seriously lengthy and obscure price index discussion ensues…]
The EPI graph appears to show otherwise only because it opts to use the CPI-U-RS, rather than the PCE price index, to deflate workers’ compensation – and the CPI-U-RS has risen by 15% more than the PCE index since 1973. On its face, this seems pretty odd: for one thing, the NDP price index (like PCE) is chained while the CPI-U-RS isn’t. If you deflate net production by the former and compensation by the latter, the result is a “productivity-pay” gap that’s partly due to formula bias!
Now, the authors admit that this is a problem, but they claim that other advantages justify their choice of the CPI-U-RS. This is where their arguments completely stop making sense. They point out the scope differences between the PCE and CPI indices, since the former includes non-out-of-pocket health care costs paid by employers and government. But since health care inflation has vastly exceeded other forms of inflation, the PCE index’s greater weight on health care has pushed up its inflation rate; if they think this is a problem, replacing PCE with an otherwise inferior index that shows even higher inflation is a strange way to go about fixing it. (Not to mention that this aspect actually would make the PCE index more convenient for their purposes: since the CPI doesn’t cover employer health care contributions and therefore can’t be used to deflate them, they’re currently forced to improvise a hybrid with additional weight on health.)
Another argument in the EPI paper is that PCE includes net expenditures by nonprofit organizations, and that a fall in prices for this component biases the PCE price index downward as a measure of prices for household expenditure. Even if we grant this argument, I calculate that the nonprofit effect on the PCE price index since 1973 is around -2%; this is hardly enough to justify choosing the CPI-U-RS and its +15% higher inflation as an alternative. (Indeed, it’s offset by bias in the opposite direction from the inclusion of government health care expenditures in PCE, as mentioned above.)
Perhaps EPI’s strangest argument is that chaining is responsible for only about one-third of the gap between PCE and CPI-U-RS inflation. Sure, but the rest of the gap is due to different consumption weights, and that’s an equally compelling reason to use the PCE index for an exercise like this. CPI weights are taken from the (unreliable) Consumer Expenditure Survey. PCE weights, on the other hand, are taken from the expenditure estimates recorded in the national accounts; the same figures are used to calculate the NDP deflator, which EPI is using to obtain productivity. Using the PCE and NDP indices together, with weights derived from the same source, is at least an apples-to-apples comparison; mixing CPI-U-RS and NDP, you end up with a “terms-of-trade” gap that’s nothing more than a mishmash of composition bias and formula bias.
Part of the problem, too, is conceptual. The EPI paper interprets its gap between production and consumption prices as coming partly from a long-term fall in relative investment prices. (Note: this fall is real, although it’s offset by a rise in prices for the government component of NDP, which is why relative PCE/NDP price ratio has been so stable regardless.) The authors view this as significant, asking: “And if business costs are being held down by deflation in computers, why haven’t the benefits of these lower costs filtered through to workers and households in the form of slower growth in the price of consumer goods that these businesses produce?” The answer, of course, is that the lower costs have filtered down; but that doesn’t stop the production and consumption deflators from diverging.
You can do a simple thought experiment to see why. Suppose that investment is constant at 20% of GDP, consumption is the remaining 80% of GDP, and the share of capital in the production of both investment and consumption goods is constant at 30%. Suppose also that production is perfectly competitive with zero profits, and that productivity in investment good production rises relative to productivity in consumption good production at a constant rate of 1% each year (resulting in a relative price decline of 1%).
This disproportionate growth in investment good productivity leads to 1% extra annual growth in capital, contributing 0.3% to annual growth in consumption. It completely “filters down”: by assumption, there are no profits or frictions. Yet still, consumption inflation here is 0.2% per year greater than production inflation. Since consumption is the ultimate goal, it’s important to note that the 0.3% rate of consumption growth is more welfare-relevant than the 0.5% rate of production growth. But this disparity doesn’t mean anything is being stolen from workers, or that any kind of nefarious “gap” is emerging.
The bottom line is that the “terms-of-trade” gap shown in the EPI graph is spurious, both empirically (it goes away if we measure consumer prices properly) and conceptually (it’s based on the confused notion that if falling investment prices drive a persistent gap between production and consumption prices, consumers somehow aren’t fully benefiting from innovation).
11. September 2015 at 01:18
So… as the lengthy digressions above demonstrate, neither the “loss in labor’s share” nor the “terms-of-trade” wedges in the widely circulated EPI graph are all that meaningful. The one remaining component that is unambiguously meaningful and important is the “inequality of compensation” gap, i.e. within-labor inequality.
Now, it’s not clear that this really belongs in a chart of the “productivity-pay” gap: the implicit assumption here is that there has been no change in mean vs. median labor productivity underlying the change in mean vs. median compensation. Needless to say, that’s a rather sketchy hypothesis – most economists would regard it as unlikely, and I don’t see much evidence for it.
It’s probably best to interpret the chart, therefore, as a clever way to rebrand plain old labor inequality: the idea that pay has failed to keep up with productivity sounds like more of a scandal than does “inequality” in the abstract. The scandal looks even bigger when you add the (dubious) terms-of-trade wedge on top.
Like Scott, I’m not moved much by this kind of rebranding, but I am a utilitarian who cares about distribution and individual welfare, so I am greatly concerned about the rise in within-labor inequality. That’s why I want to keep focused on that issue – and, with any luck, stop the endless tide of confusing productivity-pay charts.
11. September 2015 at 03:20
Larry Summers has an article today on inequality, income mobility and unions. The chart in the article is interesting, showing the old confederacy is a hotbed of low income mobility. http://www.washingtonpost.com/news/wonkblog/wp/2015/09/11/larry-summers-stronger-unions-must-be-part-of-the-national-agenda/
>>I’m a utilitarian who doesn’t think Tom Cruise deserves a high wage income just because he was lucky enough to be born with a lot of charisma and ambition.>>
Have you read Rawls’ A Theory of Justice? https://en.wikipedia.org/wiki/A_Theory_of_Justice He discusses how one would design society if one didn’t know if one would be born with charisma, amibition or any other particular physical or psychological trait.
11. September 2015 at 05:06
Several points on wage inequality:
1) One wonders if working class wages might go up with the sudden skilled labor shortage and drop in labor force supply. Are companies go to have increase training and wages to protect their workforce? Our office has increased US workers to do backroom reporting and to train for the future.
2) I think the biggest problem of increased wage inequality is the age of marriage and parenthood is increasing. Lower population growth has significant impact on both AD and AS. And isn’t the ultimate economic production, more children and population?
3) Immigration solves some of the problems above but it does create significant political issues. Even Singapore is having significant battles and Donald Trump is still leading the Republican Primary. (Yes I know he is unlikely to win the nomination but he has led for two months. Trump is not burning himself out and it is time to accept the possibility of him winning the nonmination.)
11. September 2015 at 05:07
Note that the three examples of labor inequality (Goldman Sachs executives, Tom Cruise and LeBron James) are in fact the consequence of government policy, so it would be possible to reduce wage inequality by changing those policies, rather than let them earn the money then take it back through taxes.
I’m sure you don’t have any problem with someone investing their own money and making huge capital returns, so I’m assuming your objection to the compensation of GS executives is that they aren’t making money for excellent capital allocation skills, but rather, because GS is profitable because of the reduced cost of funding that a TBTF bank like GS can obtain.
And Tom Cruise and LeBron James, like all content producers, only wake money because of the high level of IP protection we provide in this country. If people were able to do what they want with their own property in their own homes, such as record and redistribute a movie displayed on their screen, or make/order a few shirts with the logo of an athletic apparel brand or sports team.
Significantly reducing protections on copyrights and trademarks is radical, but not any more than the >80% tax rate that many Democrats/progressives would prefer, and would deal with the problem of “ill-gotten gains” much better. And as more of the goods in the economy become virtual, if we keep the current level of protections (100+ year copyrights, total trademark protection), you won’t be able to tax the IP creators enough to make the system “fair.”
If you don’t think Tom Cruise deserves high wages because he was both with/developed what it takes to be a Hollywood star, then it seems that the best way to deal with that is to change the policies that enable content producers to command such high prices from the public.
11. September 2015 at 06:07
“But it does suggest that labor’s share in the very long run is pretty stable.”
It has been awhile since I looked at the data, but I believe that labor’s falling share is occurring accross the globe. Interestingly enough, it has occurred in emerging, developed, rigid, and liberalized markets alike.
I did not subtract out depreciation and indirect taxes, which could be an issue
11. September 2015 at 06:08
Jose, I doubt inflation has much effect.
Matt, Excellent comments. Thanks. I have a new post.
foosion, I think Rawls has the right procedure for thinking about inequality (veil of ignorance) but draws the wrong conclusion (maximin principle.)
Njnnja, You said:
“Note that the three examples of labor inequality (Goldman Sachs executives, Tom Cruise and LeBron James) are in fact the consequence of government policy, so it would be possible to reduce wage inequality by changing those policies, rather than let them earn the money then take it back through taxes.
I’m sure you don’t have any problem with someone investing their own money and making huge capital returns, so I’m assuming your objection to the compensation of GS executives is that they aren’t making money for excellent capital allocation skills, but rather, because GS is profitable because of the reduced cost of funding that a TBTF bank like GS can obtain.”
My views on redistribution have nothing to do with whether “I have a problem” with people making lots of money. I agree that government regulations partly (not entirely) explain their high salaries. And I agree that some of the regulations should be changed. But even if a high salary is earned without any government help (very unusual), I’d like to redistribute some of it to low wage workers.
And keep in mind that Cruise and James would be rich even without any IP protection, as live performances (and movie theatre showings) are still a big generator of revenue. Have you checked out the price of tickets at NBA games? And they play about 100 games a year. And live games on TV earn ad revenue.
11. September 2015 at 06:09
Ryan, You really need to subtract them out, otherwise the data is meaningless. Depreciation is not “income” available to anyone. Ditto for taxes.
Labor’s share is constant over 50 years, that’s very clear.
11. September 2015 at 06:20
Why does the graph compare 3 averages to a median (real wages)?
Has the median worker experienced big productivity gains?
Most tech companies do not employ median workers…the jobs are quite difficult. And no one listens to median music, or reads median blogs, or admits median students to med school.
PS (It appears Rognlie posed a similar question, which I will re-read carefully later)
11. September 2015 at 06:24
Kevin: The critique we featured is accurate, although I’ll defer the discussion of the details why to Matt Rognlie, who has covered them very ably.
If though it helps better understand the math involved, try this simple thought experiment. Imagine an economy where there is both steady GDP growth and steady population growth over time as well as steady growth in hours worked over time, where 100% of the population earn wages and salaries capture 100% of the GDP in all of the hours they are employed.
We can calculate the following measures:
GDP per Capita = GDP/Population
Labor Productivity = GDP/Hours Worked
Average Hourly Compensation = GDP/Hours Worked/Population
In this example, when we normalize the data and graph it, we should find that the trajectory for each directly overlays the others.
Now, what if only a fraction of the population works, where the fraction is given by the Labor Force Participation Ratio (LFPR)? There’s no change in my first two formulas, but the math for average hourly compensation changes as follows:
Average Hourly Compensation = GDP/Hours Worked/(Population*LFPR)
If the Labor Force Participation Rate is constant over time, even if it is a fraction of the 100% we used in the first part of the thought experiment, then when we repeat the exercise of normalizing the trajectories and graphing them, we will once again have the situation where each graphed trajectory directly overlay the others.
But what if the labor force participation rate is a variable that changes at rates that are considerably different than the steady growth rates of GDP, population and hours worked?
In the case where the LFPR grows much more quickly than these other rates do over time, the effect is to increase the magnitude of the denominator for the average hourly compensation calculation. That makes the resulting quotient smaller. The opposite would be true of the LFPR shrank more rapidly than the other rates do over time.
When we graph the trajectories now, we will observe a divergence in the trajectories of these measures after they have been normalized, where a gap will open up between labor productivity coinciding with the timing of the more rapid changes in the labor force participatino rate. In the case of LFPR growing relatively more rapidly than the other measures, we would see the trajectory of average hourly compensation track below the other trajectories, and vice versa for the case where LFPR declines more rapidly than the other factors in the math.
The fundamental mistake that Bivens and Mishel made was in normalizing the data for hourly compensation, which contains the highly variable component of labor force participation rate, without recognizing that factor’s existence and its impact upon their analysis.
Consequently, they arrived at an incorrect conclusion, where they’ve misdiagnosed the cause of the condition they have observed. And because the cause has been misdiagnosed, any prescriptive cure proposed to resolve the problem by addressing the perceived cause on the sole basis of their analysis will almost certainly be ineffective (at best) or completely counterproductive (at worst).
That’s not to say that there is no validity to the concern that SSumner and others have raised regarding the issues of inequality within the labor force, but it is to say that those who blindly buy into the Bivens and Mishel’s analysis need to take a breather to allow others to step in and do the analysis over properly from scratch before offering any new policy prescriptions.
The bottom line is that one wouldn’t subject a patient to heavy does of chemotherapy and radiation treatments if only a single aspirin were required to realize an effective cure for their condition.
11. September 2015 at 06:26
That should be “heavy doses” in that last paragraph above. Need more coffee.
11. September 2015 at 06:49
And keep in mind that Cruise and James would be rich even without any IP protection, as live performances (and movie theatre showings) are still a big generator of revenue. Have you checked out the price of tickets at NBA games? And they play about 100 games a year. And live games on TV earn ad revenue.
I don’t think there are any live performers who are anywhere near as rich as Tom Cruise. And a lot less of those ticket prices would go to owners and athletes if governments spent less taxpayer money on arenas and they had to finance it themselves. As for advertising, Coca Cola only spends a gazillion dollars on presence of mind advertising because RC cola can’t be sold in a red can with a white squiggle going down the side.
Lastly, redistribution to lower wage earners happens naturally when cost of living goes down since a t shirt with a Nike swoosh will only cost $5 instead of $30. Only truly rare and hard to make items will command a price premium.
*All* IP is government regulation. While I can protect my physical property myself (if I am in my car, no one else can use it without assaulting me), the only way to ensure that someone, somewhere, isn’t copying a bunch of data in a way that doesn’t affect me is to make it illegal to do so.
11. September 2015 at 07:08
Njnnja — I have had clients with closely guarded IP that dates from the 1950s or earlier. Hundreds of billions of (2015) dollars in cumulative revenue from a few ideas.
Also, you might be surprised what live performers can make. The Rolling Stones have grossed close to a billion dollars just in the last ten years.
11. September 2015 at 07:34
@TallDave
Trade secrets are different. A company doesn’t plaster its trade secrets on every billboard in town and then demand arrests in Chinatown for anybody who sells a handbag with the trade secrets printed on it.
As for live performers, of course some people of extreme talent in many areas are going to become wealthy, but I think the reason performers like the Rolling Stones have grossed *so* much touring is because of a positive feedback loop between having the exclusive right to record particular songs, selling albums and having airplay, which led to becoming famous, over a long number of years. If there wasn’t exclusivity, then I think that the total money from, say, the song “Satisfaction” would be divided over dozens or even hundreds of different groups over the years.
Potentially meaningless anecdote: my neighbor is a fairly successful stage actress (leading roles on Broadway, Tony award nominee). She is wealthy by any reasonable meaning of the word, but she claims her bank account would have another zero or 2 if she had gone to Hollywood instead.
And that’s really what we are talking about, a distribution. Some programmers are better than others, and are paid 5 or 10x more. But content producers can be paid 1,000x more because of government restrictions on copyright and “counterfeiting”
11. September 2015 at 07:38
The very real problem of zero scientific utility
Comment on ‘The very real problem of wage inequality’
Some day in the history of economic thought economists left science and became part of the entertainment industry. Thinking, of which there was never much in the first place, has now been entirely replaced by storytelling and gossip. Fittingly, you conclude your post with “That’s because an economy that allows Cruise to be very rich will generate more good films for me to watch.”
This economy will hopefully also allow you to get entirely out of economics and devote all your time to action movie watching.
It is rather obvious that your data-decorated distribution theory is a cartoon.
(i) There is no such thing as ‘a share of profit in income’ but there is ‘a share of distributed profit in income’. Most economists do not realize that profit and distributed profit are fundamentally different economic entities. Profit is not a factor income and it cannot be functionally attributed to capital. Because of this, the distribution of the period output has nothing to do with any marginal product of labor or capital. Because the profit theory is false since Adam Smith distribution theory is fundamentally flawed since more than 200 years (2014b).
(ii) The representative economist cannot tell the difference between profit and income until this very day. This is comparable to a physicist who cannot tell the difference between force/energy or acceleration/velocity.
(iii) Keynes, too, messed up the profit theory and he knew it. “His Collected Writings show that he wrestled to solve the Profit Puzzle up till the semi-final versions of his GT but in the end he gave up and discarded the draft chapter dealing with it.” (Tómasson and Bezemer, 2010, pp. 12-13, 16)
(iv) This failure kicked off a chain reaction of errors/mistakes because when profit is not correctly defined, income is not correctly defined, and then saving is not correctly defined. Therefore, as a collateral damage, all I=S models are junk.
(v) All this happened in the 1930s. Until this very day economists have not realized that all IS-LM models are logically defective — among them Paul Krugman and you (2014a). Otherwise it is not explicable that you label your post ‘Praising Krugman’.
You characterize yourself as utilitarian, so let me sum up thus: the total and marginal scientific utility of your distribution theory is exactly zero.
Egmont Kakarot-Handtke
References
Kakarot-Handtke, E. (2014a). Mr. Keynes, Prof. Krugman, IS-LM, and the End of Economics as We Know It. SSRN Working Paper Series, 2392856: 1-19. URL
http://papers.ssrn.com/sol3/papers.cfm?abstract_id=2392856
Kakarot-Handtke, E. (2014b). The Profit Theory is False Since Adam Smith. What About the True Distribution Theory? SSRN Working Paper Series, 2511741: 1-23. URL
http://papers.ssrn.com/sol3/papers.cfm?abstract_id=2511741.
Tómasson, G., and Bezemer, D. J. (2010). What is the Source of Profit and Interest? A Classical Conundrum Reconsidered. MPRA Paper, 20557: 1-34.
URL http://mpra.ub.uni-muenchen.de/20557/.
11. September 2015 at 08:32
Thanks, ironman.
11. September 2015 at 16:04
@Egmont Kakarot-Handtke – what sort of a name is that? Austro-Hungarian? Seems you’re playing with words my friend… defining ‘distributed profit’ and ‘profit’ in unique ways then writing a paper on it, all the while bemoaning that mainstream giants like Sumner–who has responded to me on this blog in person–don’t ‘get it’. Get it together: I used to, like you, criticize the Great Man until I realized the error of my ways and now am a Sumner-phile. It’s not too late to repent and seek forgiveness from him.
As for your analogy:
“The representative economist cannot tell the difference between profit and income until this very day. This is comparable to a physicist who cannot tell the difference between force/energy or acceleration/velocity.”
Unless you are making a statement about Marx’s lack of understanding of capital (as a determinant of value) there’s not much in your thesis. As for physicists who ‘cannot tell the difference between force/energy’ FYI, there’s really no difference from an operational view (speaking as a former physics major): in fact force and energy, while separate concepts, both are related (Google ‘Hamiltonian vector field’ for example), same with acceleration/velocity (the former is a derivative of the latter).
In short, you’re grasping at strawmen. And IS-LM is but a teaching method, introduced by Hicks to make some pedagogical sense of Keynes teachings, not a fundamental theorem. This is well known by Sumner and others since the 1960s if not before.
12. September 2015 at 05:22
Steve, Yes, that’s the question.
Ironman, You lost me here:
“Average Hourly Compensation = GDP/Hours Worked/Population”
Why? Why not just GDP/hours worked?
Njnnja, You said:
“I don’t think there are any live performers who are anywhere near as rich as Tom Cruise. And a lot less of those ticket prices would go to owners and athletes if governments spent less taxpayer money on arenas and they had to finance it themselves.”
I don’t believe either of these statements. There are lots of super rich live performers. Do a stadium tour at $50 tickets, you could be pulling in $250,000 a night, plus t shirts. Then they make money from TV ads, and lots of other ways too. And public subsides help sports, but they are not a big factor in why NBA players make so much.
You said:
“Potentially meaningless anecdote: my neighbor is a fairly successful stage actress (leading roles on Broadway, Tony award nominee). She is wealthy by any reasonable meaning of the word, but she claims her bank account would have another zero or 2 if she had gone to Hollywood instead.”
Even with no IP rights, Hollywood would make a fortune on live screenings. They could go back to film to reduce piracy.
I would never deny that IP rights are a big factor in inequality, or that they are too strong. I totally agree. I just think your claim that these people wouldn’t be rich without them is wrong, they’d be very rich.
Egmont, Have a nice day. And come back when you are willing to engage in a discussion.
12. September 2015 at 08:40
ssumner asked:
There is a missing notation on my part – “Average Hourly Compensation” should be “Average Hourly Compensation per Employed Individual”, which in the special case where 100% of the population is employed, becomes “Average Hourly Compensation per Capita” and which would further simplify to be: Average Hourly Compensation = GDP/Hours Worked. That latter formula only applies in the special case where 100% of the population is employed.
Balancing the math to account for population in the way I’ve described above allows for variable factors such as the labor force participation rate to be properly considered in the analysis.
This distinction matters because Bivens and Mishel’s source data for compensation (wage and salary income of nonmanagerial workers) is drawn from a subset of the entire population, where it becomes necessary to account for the variable productive fraction of the population that is actually employed and drawing wages and salaries. Otherwise, you have the situation where you’re comparing apples and oranges between productivity and labor compensation because you’re looking at different populations.
12. September 2015 at 20:24
Njnnja,
Off the top of my head, Bill Gates, Sergey Brin, Larry Ellison and Mark Zuckerberg were all programmers. Some programmers make A LOT more than others.
I agree Hollywood copyrights should expire like other IP.
12. September 2015 at 20:51
Mattt, great post, well deserving of Scott’s re-post.
I am greatly concerned about the rise in within-labor inequality
Always surprised how often people imply a particular income distribution is known to be superior.
13. September 2015 at 01:16
ICYMI (Ray Lopez)
Marx, too, messed up profit theory. This point has already been settled, see ‘Proï¬t for Marxists’
http://papers.ssrn.com/sol3/papers.cfm?abstract_id=2414301
13. September 2015 at 03:20
ICYMI (ssumner)
The point of my post is not to ‘engage in a discussion’ but to inform you that you violate scientific standards.
“In economics we should strive to proceed, wherever we can, exactly according to the standards of the other, more advanced, sciences, where it is not possible, once an issue has been decided, to continue to write about it as if nothing had happened.” (Morgenstern, 1941)
Please take notice: the issue has been decided, your distribution theory is provable false. The correct distribution formula is testable and refutable and this is how matters are settled in science.
“Accordingly, scientists, in their critical discussions, do not attack the arguments which might be used to establish, or even to support, the theory under examination. They attack the theory itself, qua solution of the problem it tries to solve.” (Popper, 1994)
13. September 2015 at 05:04
Ironman, OK, but Matt’s approach seems a lot simpler and more intuitive.
Talldave, You said:
“Always surprised how often people imply a particular income distribution is known to be superior.”
Public policy is based on “beliefs.” I’m not sure how you define “known” but if you mean “are certain” then we could never be justified in making any claim about appropriate public policies. Do we know that a $15 minimum wage will create lots of unemployment?
Egmont, I’ll give 100 to 1 odds that you couldn’t even describe my “distribution theory”. How can you know it’s wrong, if you don’t know what it is?
13. September 2015 at 11:07
ICYMI (ssumner)
You ask with reference to your distribution theory: “How can you know it’s wrong, if you don’t know what it is?”
(i) All theories/models that take one or more of the following concepts into the premises are scientifically worthless: utility, expected utility, rationality/bounded rationality/animal spirits, equilibrium, constrained optimization, well-behaved production functions/fixation on decreasing returns, supply/demand functions, simultaneous adaptation, rational expectation, total income=value of output/I=S, real-number quantities/prices, and ergodicity. All these items are economic nonentities.
(ii) You call yourself an utilitarian.
(iii) No way leads from false premises, i.e. nonentities, to the understanding of how the actual economy works. From (i) and (ii) follows that your approach as a whole is methodologically unacceptable and this implies the distribution theory as a logical part thereof. That is sufficient. There is no need to discus details as there is — in analogy — no need to discus epicycles when geocentrism as a whole has been refuted. It is as simple as that but I’ll give 100 to 1 odds that you couldn’t understand nor accept it.
14. September 2015 at 05:58
Egmont, That’s about what I expected.
14. September 2015 at 13:06
Scott — Your point is well taken, but it seems like it would be very, very hard to tell what labor income distributions produce the best outcomes in terms of growth and employment and living standards. I suppose my hackles rise a bit whenever “concern” is expressed about market pricing.
14. September 2015 at 13:08
Egmont Kakarot-Handtke — If utility cannot be part of an economic theory, then you can’t study economics at all.
Although, I will give you props for being funnier than Ray.
14. September 2015 at 13:10
Also, I have a plan to study utility directly via dissection. We are looking for volunteers.
15. September 2015 at 03:11
The very real problem of the representative economist
Comment on Talldave on “The very real problem of wage inequality”
After more than 200 years it is pretty obvious that economics is a failed science. What has been produced so far is much opinion and little knowledge. Economists, of course, have an explanation for this. No, it is not that they are scientifically incompetent, but, somehow, it is the fault of their specific subject matter. Here is the one-fits-all excuse.
“Economics is a strange sort of discipline. The booby traps I mentioned often make it sound as it is all just a matter of opinion. That is not so. Economics is not a Science with a capital S. It lacks the experimental method as a way of testing hypotheses. . . . There are always differences of opinion at the cutting edge of a science, . . . . But they last longer in economics . . . and there are reasons for that. As already mentioned, rival theories cannot be put to an experimental test. All there is to observe is history, and history does not conduct experiments: too many things are always happening at once. The inferences that can be made from history are always uncertain, always disputable, . . . You can’t even count on a long and undisturbed run of history, because the ‘laws’ of behavior change and evolve. Excuses, excuses. But the point is not to provide excuses.” (Solow, 1998, pp. x-xi)
The fact of the matter is that the representative economist has not grasped until this very day what science is all about. He is devotedly commited to what Feynman identified as cargo cult science (see Wikipedia).
One of the crucial points of science — known since Aristotle (see Wikipedia) — is that one starts from correct premises. It is pretty obvious that a subjective concept like utility does not fit indispensable methodological requirements.
Unfortunately, you have not realized this yet. Proof? You say: “If utility cannot be part of an economic theory, then you can’t study economics at all.” From the fact that you cannot do it, though, does not logically follow that others cannot do it either. This is the fallacy of composition — the most common among the numerous logical blunders in economics.
Of course, some people have clearly identified the crux: “… if we wish to place economic science upon a solid basis, we must make it completely independent of psychological assumptions and philosophical hypotheses.” (Slutzky, quoted in Mirowski, 1995, p. 362)
Utility is a psychological assumption and the representative economist has to get rid of it. You cannot do it? That is perfectly OK, you are free to stay behind the curve as long as you wish.
Standard economics is based on the concept of utility. This programs has failed. Not to realize this is the very proof of scientific incompetence. It is as simple as that.
Egmont Kakarot-Handtke
References
Mirowski, P. (1995). More Heat than Light. Cambridge: Cambridge University Press.
Solow, R. M. (1998). Foreword, volume William Breit and Roger L. Ranson: The Academic Scribblers. Princeton, NJ: Princeton University Press, 3rd edition.