The Mercatus NGDP gap model
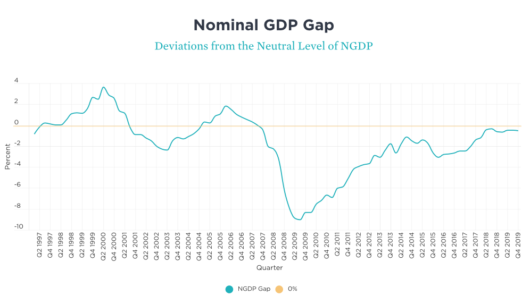
David Beckworth developed a model of the gap between actual NGDP and the previous expectation of forecasters (a distributed lag over 5 years), which does a nice job of showing whether monetary policy is too easy or too tight. Mercatus has a web page that shows the relevant graph:
 Of course there will be a huge gap by Q2, but what really matters is late 2020 and 2021. That when the Fed needs to close the gap.
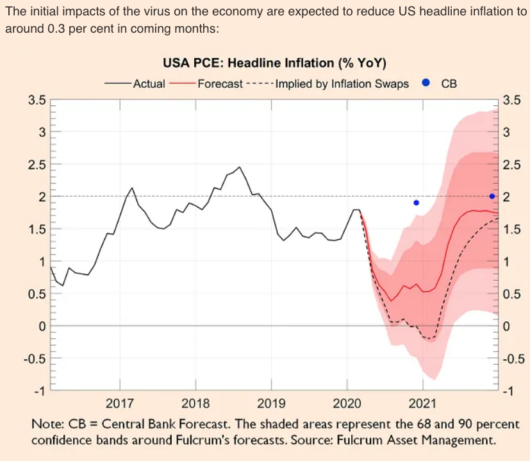
I’m becoming increasingly discouraged by Fed policy, which seems to be repeating the mistakes of 2008. They seem to believe that the problem is financial, whereas it’s actually monetary. Credit market dysfunction is a symptom. And they seem to believe that providing credit is the answer, whereas we actually need more money. A switch to level targeting (plus “whatever it takes”) would be an obvious solution, and a way of preventing a sharp fall in inflation expectations:
Meanwhile, we continue to pursue ineffective fiscal stimulus, running up huge future tax liabilities.
Tags:


30. April 2020 at 11:46
I like this.
Interesting that it shows above zero values in the late 90s and mid-2000s. You have typically argued in the past that monetary policy was not too easy during these periods.
30. April 2020 at 12:29
John, No, I’ve said that excessively easy policy wasn’t the main problem in the housing bubble.
I’ve never denied that it might have been modestly too easy.
30. April 2020 at 12:44
Sumner: “Meanwhile, we continue to pursue ineffective fiscal stimulus, running up huge future tax liabilities.” – which begs the question, does the author think that effective monetary stimulus does not run up huge future tax liabilities? Put another way, when the US Treasury did an MMT during the US Civil War and simply printed greenbacks, and it took a generation to pay off those unbacked greenbacks, was the US taxpayer liable for those greenback liabilities during the 25 years after 1864? Without paging Dr. George Selgin, methinks the answer is yes. So when today’s Fed buys junk commercial paper at 100% on the dollar and later wants to unwind this paper, and finds it has to take a haircut of say 90% of what it paid, does the taxpayer suffer? Methinks yes. TANFL. Of course I could be wrong, just like I could be wrong about the Wuhan virus being man-made. It’s just not likely.
30. April 2020 at 13:02
Ray, You asked:
“does the author think that effective monetary stimulus does not run up huge future tax liabilities?”
Yes.
And those Civil War greenbacks were debt, used to buy real goods and services. A combined monetary fiscal stimulus. Obviously that does create future tax liabilities.
30. April 2020 at 13:17
@ssumner – thanks, so I was partly right, at least about the Civil War greenbacks. You should do a future column on the difference between the Civil War greenback printing and today’s Fed buying commercial (i.e. non-government) paper. Is your position hinging on the word “huge”, ala Trump? I would find such a post quite educational and I’m sure a number of other readers would too.
30. April 2020 at 14:33
Ray,
Back then, they simply printed money, so in a sense that’s a fiscal measure. And a bad one at that, because you can only print very little money, because just printing a lot of money should be extremely inflationary.
Monetary policy means that you “print” money AND that you then use this money to buy very save securities, which you can later exchange back if you want to, for example in order to destroy the printed money. This is a fundamental difference, in this way you keep control over the money supply.
This is so fundamental. I think more should be done about this in school education, about 80-95% of the population do not seem to know the differences, so it is not surprising that fiscal policy is so loved by many voters and monetary policy is so hated.
Scott was right one more time after all, the 21st century sucks.
30. April 2020 at 14:52
I’m going to download the data and play with the numbers, but I have some initial observations:
1. Unless I’m missing something, and if we take this approach seriously, it is very consistent with my claim that US RGDP potential has been appreciably higher since the Great Recession than nearly anyone has acknowledged.
2. I don’t think an approach that excludes reasonable estimates of real GDP potential is reliable. I take Scott’s point that inflation and RGDP are mathematical constructs, and various approaches to calculating it are controversial, but there’s also good reason to believe that the three dominant inflation metrics aren’t far off the mark. Evidence for this includes the Billion Prices Project inflation numbers based on very broad internet sales data.
That said, even a good inflation model doesn’t address RGDP potential, and most don’t think there’s a reliable way to estimate RGDP potential. I disagree, but then I may just be an ignorant crank.
From a meta perspective, I think I must be wrong, but then I look at international data and see evidence that NGDP growth should equal rates on government bonds in monetary equilibrium, sans measurable sovereign default risk. Typically, rates on government bonds and NGDP growth are pretty close, on average, at least in recent decades.
While some will understand my point about the importance of RGDP potential, let me explain for those who don’t. RGDP potential can bounce around for a variety of reasons. NGDP expectations only tell you what forecasters expect monetary policy to achieve, as opposed to what it should optimally achieve. Stable expectations are not good in a Depression, for example, or a high inflation regime.
3. Professional forecasts are not market forecasts.
30. April 2020 at 14:56
I need to correct one sentence in part 3 above:
“Stable expectations are not good in a Depression, for example, or a high inflation regime.”
It should read:
Stable expectations versus actual NGDP results are not good in a Depression, for example, or a high inflation regime.
30. April 2020 at 15:19
I am not sure about those “future tax bills” run up by fiscal deficits. In Japan the central bank seems to have little problem in buying Japanese government bonds and funneling the interest payments back to the national government. The Bank of Japan adds continuously to its balance sheet, and taxes in Japan remain lower than in the US, generation after generation.
On the other hand, what the US federal government needs to address today is 50 million unemployed Americans, unemployed by various government ukases.
How will more helicopter drops on Wall Street (conventional quantitative-easing) and lower interest rates, or even negative interest rates, get those 50 million people back to work even in the absence of government ukases?
Given the unusual circumstances, printing money and giving it people is probably the best option. If we insist on printing and then lending people money, all we do is rob from the future.
A nation of debt peons will invest less, consume less, and be a fragile structure.
30. April 2020 at 18:36
High debt is not a particularly resilient policy choice.
1. May 2020 at 09:23
Is that graph showing that monetary policy has been tight since 2006, and has not gotten loose in even one year since then? Would the 21st century have sucked if the US and Europe had competent monetary policy?
1. May 2020 at 12:16
Burgos, Yes, but not quite as bad.
1. May 2020 at 13:06
@Christian List – “Monetary policy means that you “print” money AND that you then use this money to buy very save (sic) securities” – yes I know. That’s why I asked about Sumner speaking to buying unsafe securities: “you should do a future column on the difference between the Civil War greenback printing and today’s Fed buying commercial (i.e. non-government) paper.” but Sumner did not address this issue. Recall Sumner has said he’s not against the Fed buying commercial paper (unsafe securities).
1. May 2020 at 15:31
Michael Sandifer,
Congratulations on your observations. An increasing number of newer ways to measure monetary policy agree with your views.