

Real wage bleg
Paul Krugman has a column discussing the plight of America’s workers:
The point is that extreme inequality and the falling fortunes of America’s workers are a choice, not a destiny imposed by the gods of the market. And we can change that choice if we want to.
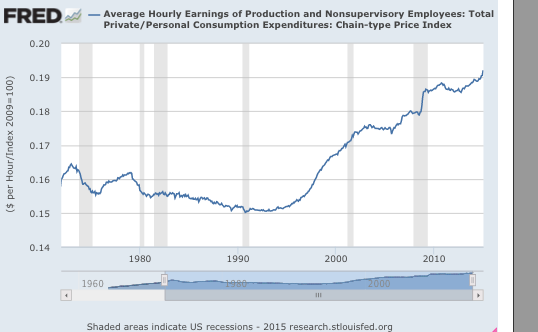
We all know that workers have done very poorly in recent decades, but exactly how do we know this? Michael Darda sent me an email pointing out that real wages have been rising since about 1994 (ironically when NAFTA was enacted), after falling during previous decades. Here’s a graph showing hourly real wages, where I use the wage series excluding the higher paid managers. I presume that’s the series people are discussing. I use the PCE price index, which the Fed seems to think is best (I find all price indices to be equally arbitrary.)
Obviously I must have made some sort of mistake. Which data series are the Democrats using to get so hysterical about real wages in America?
PS. Or maybe I misunderstood the complaint. Maybe the left thinks average real wages are fine and that inequality is the problem. In that case workers making more than average (more than $20.80/hour) should see their wages cut while those making less than average should see their pay increase. Good luck with that platform, given that a sizable chunk of low wage workers are non-voting teens and immigrants.
PS. Evan Soltas is back blogging, and has some very interesting new posts, including one on wage compression. Soon I’ll discuss his post on the cost of holding currency.
Tags:
4. March 2015 at 11:18
“Third decree: no more rich people and poor people! From now on, we will all be the same… umm, I dunno… I gotta think about that one..”
4. March 2015 at 11:23
Here’s a post from Krugman with some charts http://krugman.blogs.nytimes.com/2014/11/12/on-income-stagnation/?_r=0
4. March 2015 at 11:23
Maybe because our own biases fool us, they are looking at household income and the that is throwing them off. Blue collar households are getting smaller faster that rich households.
Also maybe because inflation was higher in the 1970s they are mentally thinking real wage growth is slower than it is.
4. March 2015 at 11:24
Scott, how much emphasis do you personally place on the stock market when judging the state of the economy? How much ‘real’ effect do you think stock market gyrations usually have?
4. March 2015 at 11:30
I would guess it’s this data series Democrats are using:
http://research.stlouisfed.org/fred2/series/MEHOINUSA672N
Of course, household income is a terrible statistic considering average household size decreasing. At least I assume household size has decreased.
Democrats would say it’s due to median vs. mean. I guess skewness is a small part of it, but likely only a small part for “production and nonsupervisory employees.” Also:
1. Your data series takes into account benefits while the median income series doesn’t. It’s always hard to know what income/wage data isn’t tainted by not including employer insurance costs.
2. Wages have increased but decreasing hours have offset the wage increase.
4. March 2015 at 11:44
Looking at Krugman’s posts that foosion links to, it appears that the price index that is used matters quite a bit. With the PCE, we get the chart Scott posted, where hourly wages are way above thier levels in the 1970’s. However, if we move to the CPI-U, we get the chart that Krugman posted in November. Using the CPI-U, the average hourly wage peaked in the early 1970’s around $22 per hour. By 2015 it had still not returned to $21 per hour. So it looks like a lot of the problems may be due to the inflation index used. I seem to recall that the Bureau of Labor Statistics did some work in the late 1990’s and early 2000’s and found that the CPI-U over estimates inflation. That may be a good reason why using the PCE is better than the CPI-U.
4. March 2015 at 12:04
If you look at the BLS’s Productivity and Costs report and look at the Nonfarm Business Sector, real compensation per hour index, real compensation has been flat since 2006.
http://research.stlouisfed.org/fred2/series/COMPRNFB
4. March 2015 at 12:09
Over the long run, the CPI rises much more than the PCE price index:
http://research.stlouisfed.org/fred2/graph/?g=Vpm
4. March 2015 at 12:16
I think Sumner misses the point. I’m not sure what Krugman is thinking but his logic makes sense if Walmart can set a price (“price maker”) since it has a monopsony on low-skilled labor. As such, it makes sense for Walmart to raises wages for the same reason Henry Ford raised wages for his workers making Model Ts. See my comments at Econlog ” Scott Sumner post, The last New Keynesian left alive” for further erudition.
4. March 2015 at 12:20
This chart looks seriously wrong especially with the huge jump in 2009 when all good fearing employees had the weekly Friday 5:00 sigh of relief. (And nobody got raises period!) I know real wages started upward since ~2012 has been occurring but it is hard to take seriously with the increase in 2008 – 2010. (It may have been the number of hours worked dropped a lot. I know my wife worked a Big Box Store and the way to out-compete your co-workers was have a very flexible schedule.)
It should be noted that the Reagan Revolution needed the change to the second income married family model for growth. So even with decreasing wages, household incomes increased. (So the Reagan Revolution needed the good economic parts of feminism.)
4. March 2015 at 12:44
Colin — that’s not surprising, though, since wages are sticky and layoffs don’t affect hourly averages. Also, nearly all increases in living standards are driven by productivity increases, e.g. women were able to enter the workforce mainly because of labor-saving devices that made homemaker less than a full-time job — leisure rose despite more “work.”
4. March 2015 at 12:45
@collin
“This chart looks seriously wrong especially with the huge jump in 2009 when all good fearing employees had the weekly Friday 5:00 sigh of relief.”
-You have a terrible memory. One of the most memorable events of my life was watching gasoline prices fall from well over $4.00 per gallon to under $1.60 in the space of a few months! Everybody felt good about that, I think.
Yeah, hours fell by about forty to fifty minutes:
http://research.stlouisfed.org/fred2/series/AWHNONAG
4. March 2015 at 12:47
Also, the U.S. has officially entered into CPI deflation due to falling gasoline prices. Again.
4. March 2015 at 13:07
Unless I’m missing something, isn’t there one obvious difference between wages and income? If a person is not working, they have no hourly wage so they are not included in wage statistics. For example,if there is a sharp increase in employment during an economic expansion, it is possible for the average wage to be stagnant even if average incomes are rising.
Looking at the Reagan years (81`-88), it looks like the real median income for males increased from $33,726 to $35,777 and for females from $13,243 to $16,810 in 2013 dollars.
http://www.census.gov/hhes/www/income/data/historical/people/
(table P8)
4. March 2015 at 13:12
I assume there aren’t statistics for real wages among born Americans? And there aren’t weighted statistics for current US real wages vs. a properly weighted average of past US and past Mexican/Colombia/Cuba/etc. real wages?
In which case, isn’t this a debate without (adequate) data?
If you want to make comparisons between the wages of US workers today and (say) 20 years ago, US wages 20 years ago are the wrong comparison class. That’s a very simple consequence of mass immigration from low-wage economies.
4. March 2015 at 13:15
So the only reason why hourly wages increased in 2009?
1) The economy dropped all the Marginal workers (h/t Tyler?)
2) Gas prices dropped a lot (Impact is limited though…And shouldn’t the wages in 2008 drop a lot? That is run up to $4/gallon)
3) Hours were cut greatly without changes to “hour wages.” So incomes went down
4) Companies cut benefits to heck while not decreasing wages.
Still, it seems that the highest increase in real wages occurring in 2009 is not going to get a very receptive response. One aspect of the Great Recession causing the push the last 3 years is the labor supply has dropped a lot the last 5 years. I don’t know if it will recover.
4. March 2015 at 13:15
Ditto, of course, when it comes to comparing women’s wages today with women’s wages in the 1960s. Many women were working for $0 per year, but their rise in incomes aren’t reflected in the average figures. Like I said, it’s a debate without data, and what really should have been done would have been to (a) collect the data relevant to the theortical questions and (b) for people to consider their hypotheses in light of the data.
4. March 2015 at 13:24
“Gas prices dropped a lot (Impact is limited though…And shouldn’t the wages in 2008 drop a lot? That is run up to $4/gallon)”
-They do so more if you use CPI instead of PCE index. Don’t know enough about the differences between the two to tell you why. Note in the graph Sumner shows, while real wages don’t fall, they do stagnate a little in late 2007-early 2008. Other that, I have no issues with your comment.
4. March 2015 at 13:35
I’m with Collin and W. Peden. That jump at the end of 2008 is massive. Let’s have more of that. Extremely tight money, higher minimum wages, and generous unemployment insurance clearly give us the outcome we are looking for. In fact, even over the long term there is a surprisingly inverse relationship between wages and employment-population ratios. Maybe those 2008 policies were working through this mechanism.
You know, I have a modest proposal. We’ve already established, as a nation, that social justice trumps the right of association in commerce. Why shouldn’t this also be the case in family structure? In addition to the EEOC, we need an EMOC (Equal Marriage Opportunity Commission) to establish a sort of affirmative action for the unwed. And, we can enforce a one-earner per household rule to keep those top 1% of household incomes in check. We all agree that there is a wide gender pay gap, so this will pull a lot of women out of the labor force. We’ll get higher average wages and much lower household income inequality.
In fact, this looks a lot like the 1950’s – Paul Krugman’s favorite era. So, I think we can all assume he’s on board with this proposal.
4. March 2015 at 13:38
Seriously, though, I was just finishing another post in my housing series, where I found an interesting issue regarding the recent rise of rental income to homeowners. On a relative basis, this has a very large positive effect on low income households.
http://idiosyncraticwhisk.blogspot.com/2015/03/housing-tax-policy-series-part-18-i-was.html
4. March 2015 at 13:39
Thanks Foosion, That’s not much of a post. My real wage series is better than his (according to the experts, not me), and households aren’t the right unit, not when households are getting smaller because of the single parent trend.
It’s odd that he’d define RGDP as NGDP/CPI. Usually it’s NGDP/deflator. I wonder why?
Ashton, Very little. It’s true that stocks do correlate to some degree with the overall economy (they usually fall during recessions), but since we have much better indicators I see little reason to use stocks as an indicator of the economy.
Thanks Matt, very good points.
Jesse, Interesting, but why in the world would anyone care about the real wages in one particular sector of the economy? Isn’t the overall economy what matters?
E. Harding. Yes, that’s something I’ve seen before–maybe a follow up post is in order.
Ray, I miss the point????? What does your comment have to do with this post?
The post has nothing to do with Walmart. I never even mentioned Walmart. Anyway, the fact that Walmart raised wages supports my point.
Collin, Why are you surprised that real wages rose in 2009? Nominal wages rose 3% and the price level fell.
Zack, Yes, wages are different from income, but the focus has been on income.
4. March 2015 at 13:51
Sorry, I should explain why the post I linked to is relevant to this discussion. Homeowner tax benefits cause owners to bid up imputed rents and the credit crunch since 2007 has created a housing supply shock. This doesn’t affect nominal wages, but the unusually high shelter inflation that has resulted does reduce real wages. Homeowners earn this back through tax benefits and through imputed rental income, but neither of these is captured by average real wage measures.
I’m hoping to eventually guess at a number for the total effect.
4. March 2015 at 13:53
The trend in household size is not nearly enough to account for the change in median HH income shown in Krugman’s chart.
https://www.census.gov/hhes/families/files/graphics/HH-4.pdf
The relevant chart would be workers per HH rather than only size, but hard to believe that would cause a different conclusion. Anyone have contrary data rather than just guessing?
4. March 2015 at 14:37
I know the Social Security Administration and the Current Population Surveys provide a lot more information on wages than just the average. If you looked at wage growth across percentiles, I think you would still see positive wage growth from the mid-90’s across all percentiles. However, you would also see increasing larger gains as you move up the percentile ranks. So, I think your first P.S. is probably right. The complaint is less about real wages for any one group in an absolute sense and more about faster wage growth for the top percentiles.
4. March 2015 at 14:58
Interesting that average wages have been growing, but median household incomes have been declining since 2001. It looks like household income is coming from fewer workers in general, and especially fewer workers per household.
I hope I’m not over-referencing my own blog here, but I did a post on median incomes a while back that included a graph of average earners per household. It has been dropping sharply.
http://idiosyncraticwhisk.blogspot.com/2013/09/median-incomes.html
4. March 2015 at 15:25
foosion, first, percentage of 1-person households is different from household size. Second, if low income couples divorce or split up at higher rates than high income couples, then using household incomes not only cuts low income divorced couples’ incomes by half (2 households instead of 1), it also *double counts* those low income couples relative to high income couples. If this pattern of low income couples splitting up more often than high income couples has been growing, then that would produce a trend of lower household income, even if average household size was not changing.
4. March 2015 at 15:29
Kevin Erdman,
Is there a name for when one treats a statistical category as having a fixed membership over time when people are moving in (and out) of it? If not, then there should be.
Someone who earns $3,000 in a Third World country and comes to the US to earn $12,000 has seen a huge increase in their incomes, but that doesn’t show up in the data. It wouldn’t be such an issue if immigration was homogenous over time in quantity and in qualitative aspects, but obviously it isn’t. Not coincidentally, I suspect, the peculiarly high wage rises of the 1950s-1960s coincided with a period of exceptionally low (for peacetime) immigration into the US-
http://www.immigrationeis.org/sites/default/files/images/charts/immigration_into_us_1.gif
Note that I’m not saying that immigration is a bad thing. Indeed, from the point of view of the immigrants (who are the largest group who cares the most about immigration) I’m saying it’s a great thing, at least economically. The issue is the statistical impact of immigration and taking proper account of it.
The same goes, of course, for women entering the labour force. Nor is just using male wages adequate, because men have different patterns of employment from women (e.g. in terms of employment in manufacturing) and because the move of women into paid employment has been a very good thing that is masked by focusing on male wage data.
4. March 2015 at 15:41
An even more useful graph-
http://cis.org/sites/cis.org/files/2012-profile-f1.jpg
If the US is a country in which roughly 10% of the population are from Third World countries, then it is rather interesting that the real wage data are as good as they are.
4. March 2015 at 15:42
Real wages increased in 2009 because nominal wages are sticky. We measure real wages by:
Real Wage = (Nominal Wage)/(Price Index)
The numerator didn’t really drop. The recession had less hours worked instead of reducing wages. The denominator did drop because non-labor commodities did drop in price substantially.
4. March 2015 at 15:47
Also, if workers are purely rational and can negotiate such a contract, shouldn’t they prefer hours cuts to wage cuts? Working 1 hour at $5 an hour is preferable to working 2 hours at $2.50 an hour.
4. March 2015 at 16:03
Unless, of course, they prefer their job to leisure, at least up to a point, which is true of only a few of us.
4. March 2015 at 16:04
On Krugman’s post, the most interesting chart is the divergence of Median Household Income versus GDP per household. Decreasing household size couldn’t explain the divergence.
There are a few possible explanations:
1. Firms somehow have monopoly/monospony power over both ends to capture rents.
2. Similar to #1 but the distinction is very important. Unions were more powerful before 1980 and perhaps LABOR was the one with monopolistic rents. Therefore the divergence was a return to market value of labor, with correspondingly lower unemployment rates. The unemployment rate has in fact been lower in general 80’s-00’s than the mid-to-late 70’s.
3. The income measure is median and not mean. The math makes perfect sense if AVERAGE household income tracks GDP/household. In that case, the skewness raises two possibilities:
a. Technology “hollows out” the labor market. Tasks requiring competencies above pure menial work but below top intellectual/social requirements are the most programmable.
b. The top end of the labor force has captured rents much moreso than the rest of the labor force. In this case, it’s labor and not capital that’s capturing rents.
4. The median household income series not including non-cash compensation.
5. Lower interest rates having some effect on the labor/capital income mix…somehow. I still haven’t figured that one out.
The interesting thing on #2 is I remember a study which said higher returns to capital seemed concentrated in formerly unionized industries. The study pointed out other industries without unions, like retail banking or health care, haven’t seen the capital/labor income mix change.
4. March 2015 at 16:05
“Also, if workers are purely rational and can negotiate such a contract, shouldn’t they prefer hours cuts to wage cuts? Working 1 hour at $5 an hour is preferable to working 2 hours at $2.50 an hour.”
Yes, sure, but the employer would certainly prefer the two hours for $2.50 if they could get it. Another employee would underbid the $5/hr. employee if labor were a typical market.
4. March 2015 at 16:06
Scott: is the chart you represent for production workers a chart of people who are employed in manufacturing? Has not the growth in the US workforce being in the services? Do not services generally pay less than factory wages?
4. March 2015 at 16:23
Matt Watters, I was going to echo what you had to say about the 2009 spike in real wages, it was a drop in the price indexes — sticky wages.
CPI vs. PCE — the biggest difference is that PCE a dynamic basket, and CPI is a fixed basket. That is, as prices change, and people buy more of the cheaper good, PCE captures that and CPI does not.
Household income vs. hourly wages — I would think that the big factor here would be the change in the labor force participation rate.
4. March 2015 at 16:32
Chinese premier sets GDP expectations at 7%, inflation target at 3%
http://seekingalpha.com/news/2347326-chinese-premier-sets-gdp-expectations-at-7-percent-inflation-target-at-3-percent
4. March 2015 at 17:13
“Scott: is the chart you represent for production workers a chart of people who are employed in manufacturing?”
-No. And manufacturing doesn’t pay that much:
http://research.stlouisfed.org/fred2/release/tables?rid=50&eid=5943&od=2015-01-01#heid_5936
4. March 2015 at 18:29
This graph deals with the hours worked issue and uses the GDP deflator. Using PCE seems to imply a fixed pattern of consumption, but PCE/compensation has been increasing.
I also show compensation/GDP, which has been falling.
It looks like it took until 1998 to get back to 1973 levels and even now we’re only up 12% for the 40 years since 1973. Not a brilliant record.
http://research.stlouisfed.org/fred2/graph/fredgraph.png?g=12YL
4. March 2015 at 19:42
@ssumner – yes you miss my point, which is relevant to this discussion. Krugman says: “The point is that extreme inequality and the falling fortunes of America’s workers are a choice, not a destiny imposed by the gods of the market. And we can change that choice if we want to.”
How can we make Krugman’s quote work? By nothing that big corporations are monopolists in their trade and monopsonists for labor, so they are not price takers but price makers, i.e., immune from the ‘market’, as Krugman says. Hence, legislating a higher minimum wage will not only not hurt them, but help them attract better workers. It’s true however that “mom-and-pop” type stores will suffer, since these small stores are price takers.
All of this was laid out in my Econlog post, but I see, after it being up for 24 hours, the moderator there has taken it down. Too bad, it’s the public’s loss. I am surprised that you’ve not moderated your blog much up to now.
PS–in the future, a post explaining the empirical evidence that supports monetarism would be nice. It will be a short post as there is no such clear empirical evidence.
4. March 2015 at 20:36
W. Peden, Good point.
Kevin, Very good point about housing.
Foosion, Yes, data on household size would be useful.
Jeff, Note that the real minimum wage has risen fairly sharply since 2006.
W. Peden, That comment reminds me that I once posted that Americans living in 2050 would be better off than the alternative if we cracked down on immigration, or did not do so. That seemingly logical impossibility is due to the fact that “Americans living in 2050” would mean something different in those two cases.
Matt, Good points.
Ben, I’m not sure. It’s the only series I could find going back decades, and it’s the series other seem to use. I doubt there is much difference between service and manufacturing wages, but perhaps others can provide some data.
E. Harding, Thanks for that info which answers Ben.
Peter, Yes, but what struck me about it is that the wage issues seems to have greatly intensified in recent years.
Ray, No one is interested when your comments are unrelated to the post they are attached to.
4. March 2015 at 20:37
Everyone, Check out my related post at Econlog.
5. March 2015 at 00:08
off topic, but could we please have a post on Australia’s appalling recent NGDP performance?
5. March 2015 at 05:04
All, I really would like to see a discussion around what is going on in the interquartile range of income. To focus on the difference between the upper income quartile and the lower income quartile if futile (or deciles, I believe the reasoning is the same). It is futile because one can always come with mitigating policies to help the lower quartile (decile) and that is not very expensive for society as a whole. Also, there will always be billionaires, that should not be a problem if you embrace capitalism. What really bothers me is that we should focus instead on how policies affect the second lower income quartile (or 2nd to 5th lower income deciles). The people in that part of the distribution are the ones falling behind, that get really hammered when there is a recession, are hurt by lower productivity growth and are hurt by inflation. I don’t know if any of you knows of studies that tackle the inequality problem from more o less this point of view … if you do, please let me know, thank you.
5. March 2015 at 05:49
@BC in addition to what you said it appears that married men make much more money than single men so even in a single income family (See Bryan Caplan on this here) divorce and non marriage can drive down income. Anecdotally, some divorced men that I have known have stopped working hard and taken easier more enjoyable jobs because they no longer feel so much responsibility and they need more time for maintaining non work aspects of their lives.
5. March 2015 at 05:50
I do not know what happened to this link:
http://econlog.econlib.org/archives/2012/01/the_college_pre.html
It should have been in my comment above.
5. March 2015 at 06:09
From what I understand, the concern is the growing gap between mean income and median income.
Something like this: http://www.ssa.gov/oact/cola/central.html
or this:
http://s4.epi.org/files/2012/ib330-productivity-vs-compensation.2012-04-26-16:45:37.pdf
(the second link is especially interesting, since it looks at median hourly wage).
We also see that wage growth is slower than productivity growth:
median hourly compensation growth < average hourly compensation growth < productivity growth
5. March 2015 at 06:36
“Democrats” or progressives think of the 50s and 60s as the Golden era. Living standards rose. Labor shared in productivity gains. Since the 1970s that hasn’t been the case as much as we’ve seen large increases in inequality.
There are multiple reasons but mostly it’s a policy choice to keep labor markets slack and to cripple the labor movement. Profits are increasingly derived from rents instead of from competition.
5. March 2015 at 06:56
Great post and great comments.
Here’s another variable: demographics. To what extent does the influx of baby boomers into the workforce from the late ’60s to the late ’80s, and their subsequent movement through their high earnings years, explain this trend?
@W. Peden, perhaps the term you are looking for is “non-logitudinal” or somesuch.
5. March 2015 at 07:04
Saturos, Do you have a link with NGDP data?
Jose, If you are interested in economic inequality, then I’d suggest ignoring income inequality data. Focus on consumption. Or labor income.
LK, How are those hourly wages computed? I assume you mean real wages—what is the price index that is used?
Peter, Obviously I don’t agree, living standards have risen substantially since the 1970s. And I see no conspiracy to keep labor market slack.
I do agree about the “rents” problem.
5. March 2015 at 07:21
‘Unions were more powerful before 1980 and perhaps LABOR was the one with monopolistic rents. Therefore the divergence was a return to market value of labor, with correspondingly lower unemployment rates.’
Nicely put, Matt. And in my experience with construction unions, correct.
5. March 2015 at 07:35
I’ll also add that the exploitative union workers were mostly white males, while the exploited, lower earning, non-unionized workers were often women and non-white males.
5. March 2015 at 08:03
“How are those hourly wages computed? I assume you mean real wages””what is the price index that is used?”
To compare the evolution of the median to the evolution of the mean, it doesn’t matter. As long as you compare nominal to nominal, or real to real.
On an hourly basis, workers are getting a decreasing part of the economy. Also, the median hourly wage is falling behind the average hourly wage. These are the two main reasons why Democrats are complaining.
5. March 2015 at 08:19
Great work Professor Sumners,
I have been a Paul Krugman liberal for some time, but I am really convinced of the great good income level targeting, NGDPLT, can do for the world. Now that I am a believer I have several questions, I am hoping you can begin to answer.
1. Is a NGDPLT, equivalent to an Income Level Target? My understanding is Income = Government Spending + Consumption + Investment.
2. What is the mechanism for the central bank to effect the GDP? Is the idea that if they do enough QE, Investment will increase?
3. Do you have any predictions for NGDPLT effect on inequality?
4. do you have any predictions for its effect on asset volatility?
5. Is NGDPLT appropriate for smaller countries with significant foreign currency debts, exports and imports.
5. March 2015 at 08:36
In the past 30 or so years, we’ve seen a huge increase in productivity and a resultant increase in wealth in this country.
Most of those gains have flowed to the top 1 percent.
The main reason the 1 percent are outpacing the rest of us is because their value of their financial assets are growing way faster than the vale of labor.
Simply put, if you own Wal-mart stock, you get a 10 percent raise every year; if you work for Wal-mart, you get 1 or 2 percent.
In a sense this is a choice, as the 1 percent have set up the financial market to benefit themselves.
5. March 2015 at 08:43
LK, You made a claim that wages trailed productivity. The deflator certainly does matter for that claim.
Thanks Tony,
1. Yes, gross product equals gross income.
2. Open market operations. Massive QE is not needed.
3. No effect on inequality.
4. A slight reduction in asset volatility.
5. Not optimal for small countries with major commodity exports (developing countries that are small.)
Charlie, Maybe average people should buy Walmart stock.
5. March 2015 at 08:58
‘Let them eat cake.’
Seriously, Mr. Sumner, you are out of touch with the big movements in today’s economy, and judging by some of your recent comments, disdainful of those poor slobs not hooked up to the financial assets system.
When labor creates value that flows primarily to the owners of financial assets because of the efforts of the central bank and the operators of the financial system, this is a) not fair, and b) an artificial constraint that cannot last.
Go back to the beginning of the last century. We almost had a revolution in this country but it was forestalled by trust busting and other legislative restrictions on the 1 percent of the time.
5. March 2015 at 09:00
Scott, you’re not giving NGDPLT enough credit. If number 4 happens, then there should be a reduction in inequality. Returns to capital are a function of risk. Lower asset volatility means lower risk means lower equity premiums. Look at compensation as a share of GDI in the late 1960s and 1990s, when low equity risk premiums were associated with stability in the business cycle. And, obviously, globally and historically, there is an overwhelming connection between high wage levels and low equity risk premiums.
I suppose in the 1990’s inequality increased, so maybe inequality isn’t the right measure to use here. Wage growth across the board is the right measure. But, that’s the inequality fetishists’ problem, not NGDPLT’s problem.
5. March 2015 at 10:13
Regarding your Econlog post.
You are asking the question, should real wages be discounted by a consumption based priced index. I would say, if you are trying to measure the well being of an “average wage earner”, absolutely.
In this case we are not trying to measure Gross Income, we are trying to measure how much utility a person for the sale of an hour of his time.
Regarding this calculation
GDP = C + I = C + S = GDI…
I realize you are trying to cut down on the extraneous variables for the sake of clarity, but I am not sure that it makes it more clear.
GDI = Wages + Profits + Rental Income + Interest Income + taxes – subsidies.
I do agree that it doesn’t make a whole lot of sense do discount GDI by a consumption price index. Particularly when you consider that rents are the largest component of CPI.
But, wages are not the whole picture.
5. March 2015 at 10:30
“Lower asset volatility means lower risk means lower equity premiums.”
Odd, we are at/near historic low volatility in equities, and although I completely ignore the concept of equity premiums, aren’t they considered high right now (historically)?
5. March 2015 at 11:10
‘In the past 30 or so years, we’ve seen a huge increase in productivity and a resultant increase in wealth in this country.
‘Most of those gains have flowed to the top 1 percent.’
How do you know that is true?
5. March 2015 at 11:39
Robert Murphy says it’s Textbook Paul v. Op-ed Paul;
http://mises.ca/posts/blog/does-walmart-prove-minimum-wage-laws-will-help-workers/
‘Man, this textbook does EXACTLY what Krugman is complaining about, doesn’t it? In case some readers are using their smart phones and the above screenshot is hard to read, let me summarize: The text’s discussion first uses supply & demand to illustrate the problems of a price floor in the butter market, and explains how historically this caused the European Commission to find itself “the owner of a so-called butter mountain, equal in weight to the entire population of Austria.” Then, after explaining how price floors screw up agricultural markets, it goes right into the minimum wage, saying “when the minimum wage is above the equilibrium wage rate, some people who are willing to work-that is, sell labor-cannot find buyers-that is, employers-willing to give them jobs.”
‘Those of you familiar with my critiques of Krugman over the years, will not be surprised to learn that the above textbook discussion comes from…Paul Krugman’s micro text (co-authored with Robin Wells). So when in his op ed Krugman admitted that the conservatives who thought you could analyze the minimum wage the same way you look at price floors on butter could actually cite some economists to support this view…one of those economists would be Paul Krugman.’
5. March 2015 at 11:50
“You made a claim that wages trailed productivity. The deflator certainly does matter for that claim.”
Agreed.
If looking only in nominal terms, the quantities of interest are NGDP/hour_worked and hourly wages:
http://research.stlouisfed.org/fred2/graph/?g=134E
The spread is growing.
The conclusion: NGDP/hour_worked growth > nominal mean hourly wage > nominal median hourly wages.
As for the other question, “Has real median hourly compensation increased?”, I agree that the answer depends on the choice of deflator. Figure 2 in http://s4.epi.org/files/2012/ib330-productivity-vs-compensation.2012-04-26-16:45:37.pdf suggests that it has in fact plateaued from 1975 to 1995 and in the past 10 years.
In other words, it is clear the median worker is seing his hourly compensation falling far behind economic growth. It is also plausible that he or she has not seen much real growth in his hourly compensation in the past 40 years.
5. March 2015 at 11:59
Re: China, Hong Kong stocks fell 1.11% today. I fear that the government might view this as easing:
http://www.reuters.com/article/2015/03/05/us-china-parliament-idUSKBN0M103W20150305
“Underscoring the challenges faced in striking that balance, the People’s Bank of China cut interest rates at the weekend for the second time in three months.
Adding a fiscal boost to the central bank’s monetary support, Beijing plans to lift government spending to 17.15 trillion yuan ($2.74 trillion) in 2015, an increase of 10.6 percent on 2014.”
While the market might view this as tightening:
“With deflationary pressures mounting after a tumble in commodity prices, Li said China would also lower its 2015 inflation target to around 3 percent from 3.5 percent in 2014.”
I fear that the market might know the future better than the government, and that’s why stocks fell.
5. March 2015 at 12:01
http://www.reuters.com/article/2015/03/05/us-china-parliament-idUSKBN0M103W20150305
“Li said China would also lower its 2015 inflation target to around 3 percent from 3.5 percent in 2014.”
“Li said China would also lower its 2015 inflation target to around 3 percent from 3.5 percent in 2014.”
“Li said China would also lower its 2015 inflation target to around 3 percent from 3.5 percent in 2014.”
5. March 2015 at 12:18
***NGDP/hour_worked growth > nominal mean hourly wage GROWTH> nominal median hourly wages GROWTH***
5. March 2015 at 12:26
LK,
Why didn’t you use nonfarm business sector compensation per hour for your wage proxy?
http://research.stlouisfed.org/fred2/graph/?g=1356
Your graph might simply be pointing to a decreasing relative quantity of hours and a change in composition in the AHETPI series.
Also, a good portion of recent GDP growth has gone to homeowners in the form of imputed rent, which is not included in wages or income. So, some of the recent divergence is simply a return to homeowners that is not captured by wage data.
5. March 2015 at 12:41
Charlie Jamieson
“Most of those gains have flowed to the top 1 percent.”
Gains don’t “flow” — they’re created by someone. If they are not created by someone, then there are not gains. And if consumers did not receive the gains, then the gains couldn’t have happened, because consumers don’t voluntarily reduce their own utility.
The drive for “income equality” is essentially the drive to destroy productivity gains.
5. March 2015 at 12:50
This is an interesting article on China, although I don’t see why China can’t just keep inflating its way out of debt crises forever. Granted, the inflation’s not helping Scott’s side of our wager re 2038 Chinese vs. Mexican PPP GDP per capita, but avoiding mass layoffs is a winner politically.
5. March 2015 at 12:58
Charlie —
“Simply put, if you own Wal-mart stock, you get a 10 percent raise every year; if you work for Wal-mart, you get 1 or 2 percent.”
You forgot about the largest demographic set in the equation: the people who shop at Walmart.
The final result of that paper is that the entrepreneurs, the people bringing in the new methods of doing things, get only 3% of the value that the new method creates. Finance capital gets some more of that value but the vast majority of it goes to consumers. This is the so called “consumer surplus” and it’s one of the problems with GDP figures that this is not included. But we can indeed estimate if for WalMart. In fact, it has been estimated for WalMart. Slightly old figures, from 2006, and they were compiled in a report that WalMart paid for. So you can take them with whatever pinch of salt you desire. But there’s no economist out there that thinks these figures are entirely wrong.
Note Worstall explains how the Ford thing Ray alludes to is one of the most common (and most obviously wrong) myths in pop econ.
5. March 2015 at 13:34
Charlie, The Fed doesn’t give money to rich people. I’m afraid you don’t understand monetary policy.
At all.
Kevin, Returns to capital are a function of risk, but also many other things. I’m not convinced the net effect would have much impact on inequality, either way.
In my view the effect on inequality is a second order effect not even worth worrying about.
Doug, I don’t understand your argument. If it’s income you care about, use the price index for income. If it’s consumption, then use the price index for consumption. But don’t mix the two.
Patrick, Bob nailed him.
LK, First of all I’d encourage you to avoid papers like that EPI article. I can’t even tell what index they are using to deflation their wage series.
You said:
“In other words, it is clear the median worker is seeing his hourly compensation falling far behind economic growth. It is also plausible that he or she has not seen much real growth in his hourly compensation in the past 40 years.”
I don’t see any evidence in that link to support your claim. They have wage series that are essentially undefined.
Thanks Travis, I’m not too worried about Chinese aggregate demand, although it bears watching.
TallDave, The bad news is that I won’t live to 2038. The good news is that you’ll lose the bet long before 2038.
Good point about Walmart.
LK, On your second comment, does the wage series include benefits?
Kevin, Good point about housing.
5. March 2015 at 14:43
“I don’t understand your argument. If it’s income you care about, use the price index for income. If it’s consumption, then use the price index for consumption. But don’t mix the two.”
I think that is the point I was trying to make.
The real wage is a proxy for a persons ability to consume. In fact, since we usually look at “wages: non-supervisory” it is a measure of a the well being of a particular class of people. It is correct to use consumer prices to discount.
Wages are also a component of GDI, which may be a point of confusion, but they are only one component. If you were measuring GDI then you would want a broad deflator. But you would also have more than wages in the the income calculation.
5. March 2015 at 18:38
Scott, Saturos, here is a link to Australian GDP data (incl at current prices):http://www.abs.gov.au/AUSSTATS/abs@.nsf/DetailsPage/5206.0Dec%202014?OpenDocument (see column BK). Y/y NGDP is now running at multi-decade lows of 1.7% pa.
5. March 2015 at 19:00
Oops, column BJ.
5. March 2015 at 19:14
Derivs, one is a measure of the willingness to hold a perpetuity with uncertain cash flows and the other is simply a measure of expected short term price volatility. You’re comparing two completely different things.
5. March 2015 at 20:13
Doug, If you want to look at consumption, then I’d suggest looking at consumption, not wages. My consumption is not even closely related to my wages.
Rajat, I can’t find the data in that spreadsheet, which tab is it under?
In any case, perhaps the Australian data is distorted by falling commodity prices. What does total labor compensation look like? I say that because RGDP growth is still decent, despite the slow NGDP growth.
5. March 2015 at 20:53
“I’d argue that for a large portion of the people in question, the goal is to shift consumption from early years to retirement, not about maximizing total consumption.”
Kevin,
1- I assumed you were referring to CAPM theory and Beta.
2- Volatility does not have to be a short term measurement. I assume that you are assuming VIX is volatility. It is just a measurement 1 month out.
3- An increase in uncertainty of cash flows = increase in volatility.
Or please tell me which parameter you use to define uncertainty?
5. March 2015 at 20:54
obviously i pasted the wrong quote above.. long night.. food poisoning.. ugly situation here.
“uncertain cash flows and the other is simply a measure of expected short term price volatility.”
5. March 2015 at 21:52
Derivs, I think we are talking about the same things. The uncertainty I was talking about was volatility in NGDP, which I think is a larger factor in equity prices than interest rates are. I think it is possible that with ngdp targeting, nominal risk free rates will rise substantially, diversified equity holdings will act more like fixed income, and more investment will be enticed into higher risk projects that increase disruptive innovation and growth.
6. March 2015 at 06:09
Prof Sumner
“First of all I’d encourage you to avoid papers like that EPI article. I can’t even tell what index they are using to deflation their wage series.”
Point taken. However, finding median hourly compensation does not seem to be an easy thing to do.
“I don’t see any evidence in that link to support your claim. They have wage series that are essentially undefined.”
My two claims:
1) “it is clear the median worker is seing his hourly compensation falling far behind economic growth”
This comes by combining two observations:
A) Mean nominal wages/hour (and average compensation per hour, as Kevin Erdmann found) is falling behind NGDP/hour. This comes from the FRED database. No deflator here.
B) Median hourly compensation is falling behind mean hourly compensation. This comes from the EPI paper, but is independent of their deflator, under the condition they used the same deflator for the mean and median compensation.
2) “It is also plausible that he or she has not seen much real growth in his hourly compensation in the past 40 years.”
I agree that EPI did not mention which index they toke. However, it is plausible they used a sensible one. In which case, it is plausible that median hourly compensation has stalled. I agree it is not definitive data, but it surely warrants taking a closer look. The Dems claims about economic growth failing to improve the median hourly wage might have some substance.
Kevin Erdmann
Good find. It that series, it looks like the spread began in the 2000s. Remember, however, that this does not affect the growing median-mean spread.
6. March 2015 at 06:17
“Derivs, I think we are talking about the same things.”
Kevin, I think so. Essentially we are discussing idiosyncratic whisk. I liked your write up very much. Adventurous, confident, but with the necessary hubris that adventurous demands. I wish you continued success.
6. March 2015 at 12:57
LK, I can’t imagine why anyone would care about median wages. It doesn’t mean what people assume it means. Why should I care how much teenagers working at McDonalds earn?
What matters is consumption. Show me consumption data, adjusted for cost of living differences, and I’ll be interested.
Unless someone can refute the graph shown above, I’m going to assume wage stagnation is a phony story.
7. March 2015 at 07:47
Prof Sumner
The average compensation is more likely to account for very high or very low wages workers (i.e. CEOs and teenagers) than the median.
7. March 2015 at 09:21
LK, The wage series in this post does not include CEOs, or any other high paid managers. It’s non-supervisory workers wages.
7. March 2015 at 11:56
Prof Sumner,
Ok then, let me rephrase that:
“The average compensation is more likely to account for very high or very low wages workers (i.e. pro athletes, Wall Street employees, oil and mining engineers, and teenagers at Wal-mart) than the median”
More to the point, you argued that the mean is more representative of the typical hourly wage in the US than the median, because of teenagers. That’s simply wrong, in my opinion.
7. March 2015 at 14:57
Amazing math from the BLS:
http://econimica.blogspot.com/2015/03/amazing-math-from-bureau-of-labor.html
The (US) population grew from February 2008 to February 2015 by 16.8 million persons, or a 5.5% increase in total population, and on a net basis, not a single one of those 16.8 million persons got a FT (full time) job… while a net 2.7 million were lucky enough to get a (or multiple) PT (part time) job.
8. March 2015 at 10:23
LK, We’ll have to agree to disagree. I think median wage data is very misleading, it’s not what the typical age 21-65 year old adult earns, which is what people tend to assume. It includes lots of jobs that are not used to support households.
8. March 2015 at 14:37
Scott, Australian nominal wages growth is at 2.5% pa, which is the series low: http://www.businessinsider.com.au/wages-growth-in-australia-is-at-2-5-the-lowest-since-records-began-2015-2 See also: http://petewargent.blogspot.com.au/2015/02/wages-rise-25-percent.html
9. March 2015 at 06:20
Thanks Rajat, See my new post.
10. March 2015 at 10:03
I still think that the Nonfarm Business Sector real compensation per hour index is showing rather flat wage growth. Nonfarm business accounts for 77% of our economy in 2000 (I imagine it is similar if not greater now). The remaining (mostly general gov’t and non-profit) would not materially alter that finding.