The dual relationship between the interest rate and QE debates

The recent debate between Keynesians and NeoFisherians has received a lot of attention. Keynesians argue that a low interest rate policy is inflationary, whereas NeoFisherians argue that a low interest rate policy is disinflationary. I say they are both wrong, as interest rates are not “policy” at all. Both sides are reasoning from a price change.

It’s less well known that this debate has a “dual” or a parallel debate involving quantities. Just as one should never reason from a price change, one should also never reason from a quantity change. An increase in quantity might be associated with lower or higher prices, depending on whether it is caused by a supply or demand shift.

Suppose that in 2019 I told you that the monetary base was likely to double over the next 12 months. How would that forecast influence your expectations for inflation in 2020? Would you raise or lower your inflation forecast?

Would your answer depend on whether the doubling of the base occurred in the US or in Zimbabwe?

If it were in the US, would it matter if the forecast occurred in 1979 or 2019?

If the QE forecast had occurred in Zimbabwe, I’d expect hyperinflation. Zimbabwe is not the sort of country to engage in American-style QE, as it doesn’t face a zero bound problem.

If the forecast occurred in the US in 2019, I’d probably expect lower inflation in 2020. I’d assume the Fed was doing QE to counter a deflationary shock to the economy, perhaps from a trade war. (I wouldn’t have expected Covid-19.)

If the forecast had occurred in the US in 1979, I’d probably expect higher inflation, as soaring inflation was on everyone’s mind and there was absolutely no thought of “liquidity traps”.

Thus the question “Is QE likely to lead to higher inflation?” is every bit as nonsensical as the question “Are lower interest rates likely to lead to higher inflation?” Without context, it’s a meaningless question.

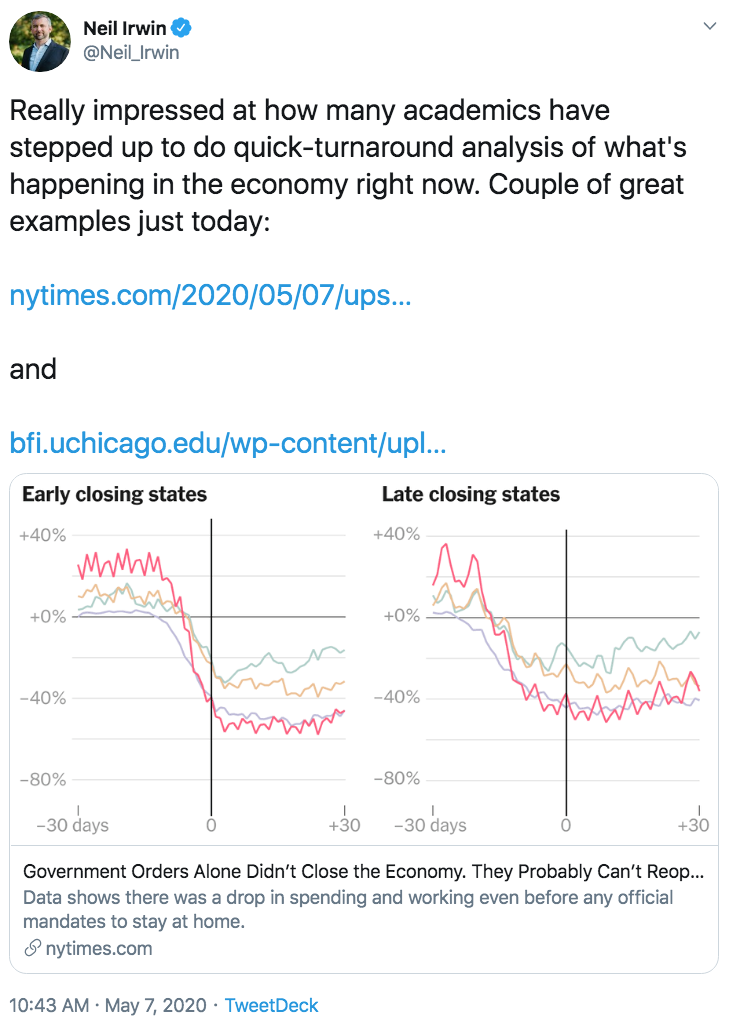
I sometimes read the economic debate on twitter but have no desire to jump in. My view of interest rates and QE is so radically different from the rest of the profession that I would hardly even know how to converse with my colleagues. Twitter is done in quick sound bits, but I need longwinded blog posts to even begin to explain where I’m coming from.

To me, twitter is a place where people think fiscal policy works, or (on the right) doesn’t work because nominal shocks don’t matter. Where central banks are frequently “out of ammo”. Where a change in interest rates or a QE program constitute “monetary policy”. Where negative interest rates are viewed as a “monetary policy choice”. Where moral hazard is not taken seriously.

I could try to jump into the debate, but I don’t think I’d even know where to begin. People would think I’ve just arrived from another planet, speaking some language like Klingon.

Pompeo implicitly admits that he and Trump lied about China

On May 2, I called out Trump for lying when he claimed there was a lot of evidence that the virus escaped from a Chinese lab. (I’m not saying that’s impossible, just that the evidence does not currently exist.)

On May 6th, Pompeo basically admitted that he and Trump were lying. It is not true that there is lots of evidence suggesting the virus escaped from a lab. Indeed, he has now “eased off” those claims:

Secretary of State Michael Pompeo again ratcheted up his criticism of China’s handling of the coronavirus pandemic, asserting that it covered up the origins of the virus even as he eased off earlier claims of “enormous evidence” that the virus escaped from a laboratory there. . . .

That’s made the top U.S. diplomat a target of Chinese ire, with officials there calling him “evil” and a “liar.”

The Chinese are right, Pompeo is an evil liar.

Yet on Wednesday, Pompeo brought up the Wuhan lab only when asked and wasn’t nearly so definitive, saying, “The intelligence community’s still figuring out precisely where this virus began.” Pressed later, he denied there was any inconsistency between his statements.

“We’re all trying to figure out the right answer,” he said. “There are different levels of certainty expressed at different sources.”

Trying to figure out? Different levels of certainty? Wait, what happened to this “enormous evidence”? Where is it Michael? Where’s your enormous evidence? I’m anxious to see it. Did it get misplaced somewhere in the State Department lost and found department?

Trump’s lies are so transparent that anyone with the intellectual capacity of an eight grader can see right through him.

This administration will stop at nothing to create a new cold war with China

How to sniff out phony data

When trying to figure out whether data is phony, I suggest looking at the evidence from many different perspectives. If something is wrong, there will often be a “tell” in other closely related data for the same situation.

I’ll illustrate this with the case of Montana, which has a suspiciously low number of “active cases”, meaning Covid-19 cases that have not died or recovered.

Montana has 20 active cases while the second best result in the lower 48 states is Vermont has 124. And Vermont has many fewer people than Montana. So Montana’s doing roughly 10 times better per capita than any other of the lower 48 states, at least on active cases. That seems doubtful.

So I decided to investigate more closely. And low and behold it seems the Montana data might well be at least somewhat accurate.

Let’s start with the obvious explanation—perhaps Montana does much less testing than other states. Might that explain the difference? Here’s the reported new daily caseload data for Montana:

That bell shaped graph looks a lot like what you see in countries that have sharply reduced active caseloads (Iceland, New Zealand, etc.) And it looks very different from most US states. Consider Montana’s neighbor North Dakota, which has a much more typical graph for a US state:

I find it plausible that Montana might have done less testing than other states, but that doesn’t explain their bell shaped graph, unless they did a lot of testing before and suddenly decided to stop testing. (Someone correct me if I’m wrong on this point.)

If you have a bell shaped graph for daily new cases, you will have a very low number for active cases relative to total (cumulative) cases, which is exactly what we see in Montana.

Did Montana luck out with very few infections early on? It doesn’t seem like that’s the case, as its new cases graph looked like other thinly populated states until April, when it fell sharply back close to zero.

So Montana really does seem to have been more successful than other states, for reasons that I don’t understand. It might simply be luck, which is possible when you are dealing with a fairly small number of infections. Perhaps they lack the meatpacking plants that saw outbreaks in other rural states.

I promised you a post where I’d sniff out phony data, and failed. But nonetheless I hope you see some value in my method—to took at the data from multiple perspectives, to see if one data point contradicts another.

PS. The following provides food for thought:

Germany has a surprisingly low mortality rate (relative to total cases), and Russia has a shockingly low rate. Russia’s data is partly explained by the somewhat more recent date of their caseload surge, but I doubt that fully explains it. Some people cite Germany’s excellent health care system, but we know that most people who need ventilators don’t survive, even with top notch medical care. Hospitals can only do so much.

We are left with differences in testing rates and differences in accuracy of mortality figures. My “prior” is to trust German figures more than Russian figures, and to assume that Germany probably does more complete testing. I’m not sure about Russia, but we know that in other countries such as China some coronavirus deaths were listed as “pneumonia” and even in the US and Europe the deaths of people at home were often missed in the official data (at least at first.) So I suspect the Russian data underreports mortality.

PPS. Western experts are split as to whether China will have a V-shaped recovery, as illustrated in this WSJ article:

In recent days, Western companies including luxury giant LVMH Moët Hennessy Louis Vuitton SE and Swedish furniture maker IKEA have raved about the rebound in Chinese spending again, buoying their earnings outlooks. Auto sales are set for their first month of year-over-year gains in two years. “It is clear that China is going through corona with a typical V-shaped recovery,” Volkswagen AG board member Juergen Stackmann told reporters Wednesday.

But it is unclear how long the recovery will last, and some are arguing that the time has come, with the pandemic largely under control, for Beijing to open up the fiscal spigots to encourage domestic consumption. That is especially since exports, traditionally a growth engine for China’s economy now accounting for less than one-fifth of GDP, will face pressure from the coronavirus’s toll in Western countries.

Julia Wang, senior economist for greater China at HSBC, warned clients in a recent note that a rise in household and mortgage debt could crimp consumption, calling for more stimulus to encourage demand. In March, retail sales fell by 15.8% from a year earlier after a 20.5% year-over-year plunge in the January-February period.

The US probably won’t have a V-shaped recovery, due to an inability to stamp out the disease and an overly tight money.

Congratulations to Faeroe Islands

Faeroe Islands is the first place with over 100 cases to completely eradicate Covid-19.

Iceland had over 1800 cases, and is still a few weeks away from being Covid-19 free.

Hoover’s curse continues . . .

Ever since Herbert Hoover was elected in 1928, the GOP has been cursed by bad luck. If you elect a Republican President, bad stuff is likely to happen:

1. The 1929 stock crash and subsequent banking crisis. (25% unemployment)
2. Three Eisenhower recessions (vs. zero for Kennedy/Johnson)
2. The 1973 OPEC oil embargo (9% unemployment)
3. The 1981-82 Volcker disinflation (10.8% unemployment)
4. 9/11
5. The 2008 banking crisis (10.0% unemployment)
6. The Covid-19 depression (14.7% unemployment, headed for 20%)

Napoleon supposedly wanted lucky generals. Shouldn’t America desire lucky presidents?

Off topic. David Beckworth directed me to this Gallup poll:

As you know, I don’t view polls as a reliable indicator of public opinion. But I think it’s fair to say that there is basically no evidence for the claim that the public is turning against free trade, or at least no evidence that anyone has presented to me.

The public has rejected neoliberalism? Prove it.

David also directed me to this interesting tweet:

As I’ve said many times, the current depression is caused by voluntary social distancing, not government mandates. Lifting the lockdown won’t stop the depression. Our unwillingness to aggressively pursue testing, vaccine development, etc., is a disgrace.