

How to sniff out phony data
When trying to figure out whether data is phony, I suggest looking at the evidence from many different perspectives. If something is wrong, there will often be a “tell” in other closely related data for the same situation.
I’ll illustrate this with the case of Montana, which has a suspiciously low number of “active cases”, meaning Covid-19 cases that have not died or recovered.
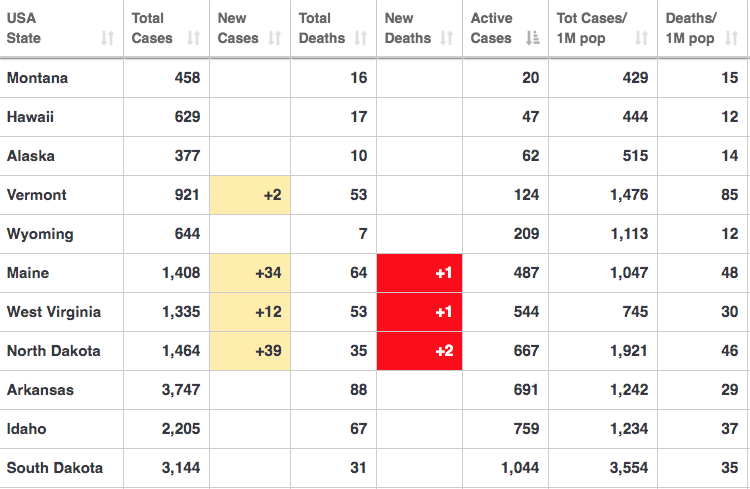
Montana has 20 active cases while the second best result in the lower 48 states is Vermont has 124. And Vermont has many fewer people than Montana. So Montana’s doing roughly 10 times better per capita than any other of the lower 48 states, at least on active cases. That seems doubtful.
So I decided to investigate more closely. And low and behold it seems the Montana data might well be at least somewhat accurate.
Let’s start with the obvious explanation—perhaps Montana does much less testing than other states. Might that explain the difference? Here’s the reported new daily caseload data for Montana:
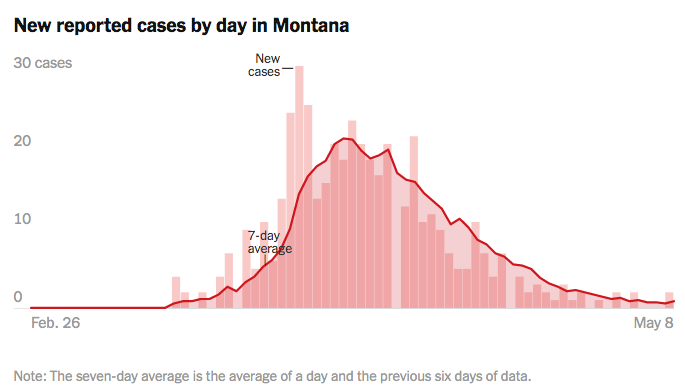
That bell shaped graph looks a lot like what you see in countries that have sharply reduced active caseloads (Iceland, New Zealand, etc.) And it looks very different from most US states. Consider Montana’s neighbor North Dakota, which has a much more typical graph for a US state:
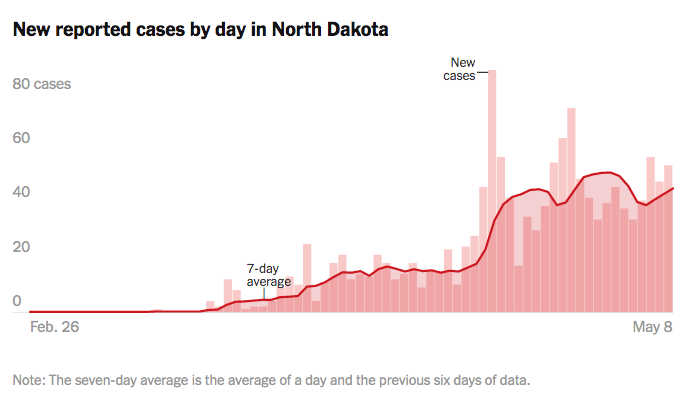
I find it plausible that Montana might have done less testing than other states, but that doesn’t explain their bell shaped graph, unless they did a lot of testing before and suddenly decided to stop testing. (Someone correct me if I’m wrong on this point.)
If you have a bell shaped graph for daily new cases, you will have a very low number for active cases relative to total (cumulative) cases, which is exactly what we see in Montana.
Did Montana luck out with very few infections early on? It doesn’t seem like that’s the case, as its new cases graph looked like other thinly populated states until April, when it fell sharply back close to zero.
So Montana really does seem to have been more successful than other states, for reasons that I don’t understand. It might simply be luck, which is possible when you are dealing with a fairly small number of infections. Perhaps they lack the meatpacking plants that saw outbreaks in other rural states.
I promised you a post where I’d sniff out phony data, and failed. But nonetheless I hope you see some value in my method—to took at the data from multiple perspectives, to see if one data point contradicts another.
PS. The following provides food for thought:
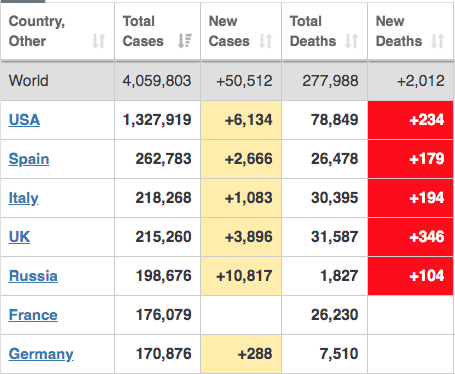
Germany has a surprisingly low mortality rate (relative to total cases), and Russia has a shockingly low rate. Russia’s data is partly explained by the somewhat more recent date of their caseload surge, but I doubt that fully explains it. Some people cite Germany’s excellent health care system, but we know that most people who need ventilators don’t survive, even with top notch medical care. Hospitals can only do so much.
We are left with differences in testing rates and differences in accuracy of mortality figures. My “prior” is to trust German figures more than Russian figures, and to assume that Germany probably does more complete testing. I’m not sure about Russia, but we know that in other countries such as China some coronavirus deaths were listed as “pneumonia” and even in the US and Europe the deaths of people at home were often missed in the official data (at least at first.) So I suspect the Russian data underreports mortality.
PPS. Western experts are split as to whether China will have a V-shaped recovery, as illustrated in this WSJ article:
In recent days, Western companies including luxury giant LVMH Moët Hennessy Louis Vuitton SE and Swedish furniture maker IKEA have raved about the rebound in Chinese spending again, buoying their earnings outlooks. Auto sales are set for their first month of year-over-year gains in two years. “It is clear that China is going through corona with a typical V-shaped recovery,” Volkswagen AG board member Juergen Stackmann told reporters Wednesday.
But it is unclear how long the recovery will last, and some are arguing that the time has come, with the pandemic largely under control, for Beijing to open up the fiscal spigots to encourage domestic consumption. That is especially since exports, traditionally a growth engine for China’s economy now accounting for less than one-fifth of GDP, will face pressure from the coronavirus’s toll in Western countries.
Julia Wang, senior economist for greater China at HSBC, warned clients in a recent note that a rise in household and mortgage debt could crimp consumption, calling for more stimulus to encourage demand. In March, retail sales fell by 15.8% from a year earlier after a 20.5% year-over-year plunge in the January-February period.
The US probably won’t have a V-shaped recovery, due to an inability to stamp out the disease and an overly tight money.
Tags:
9. May 2020 at 15:58
Re: Germany – they checked up on confirmed cases regularly and caught lower oxygen levels before hospitalization would have regularly happened, which prevented people from needing ventilators.
9. May 2020 at 17:25
Hi Scot, agreed with the point of looking at different perspectives to sniff out fake data. More broadly — looking at five different perspectives where each only has a 60% chance of giving you the right answer: well if each of them give you the same answer (and they’re uncorrelated) then you have a 99.0% chance of getting the right answer even though each is just 60%.
On a different note — I’m a bit puzzled as to why you find money so tight right now. Sure, inflation breakevens are low but there are liquidity dynamics in that market plus the breakevens for years 2-5 are at 1.2%-ish. I get that the Fed focusing on credit spreads is “wrong”, but doing so very likely boosts 2021 NGDP. I think you’re saying that the Fed will at some point over the next year stop its attempts to boost 2021 NGDP but I don’t see a ton of evidence for that. Your thoughts welcome!
9. May 2020 at 18:20
Why Shut Down? COVID-19 Infections Would Plummet If 80% Of Americans Just Wore Masks According To Study
Did Scott Sumner unmask the truth?
https://www.zerohedge.com/health/why-shut-down-covid-19-infections-would-plummet-if-80-americans-just-wore-masks-according
9. May 2020 at 18:58
@Benjamin Cole
Pardon my French, but the article you linked to is garbage.
1. Japan has been very proactive in contact tracing.
2. In the model that they refer to, the infection rate they are using is completely unrealistic. (Everyone of these bouncing dots models does this to try to prove a point, which are in fact mathematically unsupportable with realistic assumptions.)
3. The article ignores the fact that there is very little testing in Japan, which according to the accepted narrative is critical in order to stop the spread of the disease.
4. The article ignores the fact that until 3 weeks ago, there were 15 million daily unmasked riders on the Tokyo subway.
9. May 2020 at 18:59
Bing says that there have been around 1,500 new deaths reported in the US since yesterday, and about 79,700 total.
9. May 2020 at 19:13
Amin, I’m still skeptical that medical care makes a big difference, but I’ll keep an open mind.
FS, I agree with your first paragraph. The second might be correct, but on balance I still expect lower than 2% PCE inflation.
People have been telling me for 12 years that TIPS spreads are not reliable, and I agree they understate inflation expectations. But overall, TIPS have been more reliable than the “experts” for the past 12 years. That counts for something.
I also see all sorts of signs of deflation, from falling oil prices to falling rents on LA apartments. So I’m going to assume sub-par inflation/NGDP in 2021 until proven otherwise. You also have negative rates in 2021 in the fed futures market. Do you think the Fed will set the interest rate target at zero in 2021 if inflation/NGDP is on track? Especially on track to a “level target”?
Burgos, Yes, that screenshot was from earlier in the day; the final total was close to 1500, as you say.
9. May 2020 at 19:29
Scott, 100% agreed that TIPS over the last 12 years have on average been more reliable than the experts. Right now though, I think they are way less reliable than usual. Said differently, the spread between “true expected inflation” and BEI varies over time and today it’s quite high. With respect to the many signs of deflation — I do agree there are many signs of deflation, but I also see a Fed which has moved very quickly and faster than most Fed watchers thought was possible. Given those moves I’m willing to give them some more rope: I think they’ll do more over the next few months and those moves will further boost expected NGDP in 2021 (which, to be clear, is more or less what the S&P is saying). As a separate but related point, I wonder to what extent the tight relationship between NGDP growth and RGDP growth breaks down during these times. I.e., perhaps with resource re-allocation a NGDP increase of 2% can be consistent with 1.5% RGDP growth due to compositional changes. I really don’t know if that’s true but it’s something I ponder
9. May 2020 at 19:33
Scott,
1. Looking at cases doesn’t tell you anything about trends in the actual number of cases unless you have a constant test regimen. The reason the U.S. and most States don’t have a bell shaped curve for cases is because they’ve increased test intensity.
2. Testing rates have very little to do with mortality rates. If anything lower testing intensity will result in a higher mortality rate because of delays in diagnosis and treatment.
3. I don’t think you can ascribe the differences in mortality to differences or errors in death reporting. Reporting of deaths is pretty complete and rigorous in most countries. Possibly it could explain a 10 or 20% difference, but no way does it explain a 5x or 10x or 20x or 100x difference in the mortality rate.
4. But even with mortality rates, there are some problems because of the changing definition of mortality… particularly in the U.S. Under current definitions in some States, any kind of respiratory related death is counted as a Covid death even without a confirmed infection, and any death for a person with a confirmed infection is a Covid death….even if you get hit by an asteroid. I’m not arguing that one approach is better than another, but if you keep changing the length of your yardstick, you won’t be able to draw accurate conclusions about the progression of the disease.
10. May 2020 at 00:00
Re Montana (and New Zealand). NZ didnt have great contact tracing capacity as at late March. But we locked down with low absolute numbers of cases, so we were able to use the contact tracing capacity we did have to get a handle on the virus. If we had locked down with 10x the number of cases it would have been far less successful because our contact tracing would have been overwhelmed.
Contact tracing only has a significant effect if the absolute case numbers are low enough. Apparently NZs R0 got down to <0.5, whereas I understand oother places (like Western Europe) have not got R0 too much below 1. I would guess, without knowing anything about Montana, that they were able to lockdown early enough such that their contact tracing could still be effective.
10. May 2020 at 02:49
“When trying to figure out whether data is phony, I suggest looking at the evidence from many different perspectives.”
A useful example being Krugman’s “Ricardo’s Difficult Idea” a piece which we’ve both remarked upon before – to each other even.
Michael Lind claims wages haven’t been rising as fast as productivity. If this were so – of compensation at least, not wages – then the capital share of the economy would be growing. Back then it wasn’t – the claim must be untrue.
10. May 2020 at 03:44
@dtoh
“1. Japan has been very proactive in contact tracing.”
It hardly existed for weeks. When did this start, outside of Wakayama?
10. May 2020 at 04:13
https://www.bangkokpost.com/opinion/opinion/1915492/chinas-assault-on-reality-a-game
So the CCP has thrown a blogger and journalist into prison. Chen Jieren, in for 15 years.
As far as I can tell, some Western media covered the Chen imprisoning, but only the Bangkok Post has condemned it in the form of an editorial.
The Bangkok Post? That’s it?
“Meanwhile, Reporters Without Borders (RSF), in its most recent 2020 World Press Freedom Index, ranked China 177th out of 180.”
Greater trade with China is coupled with shrinking freedoms there. Why?
10. May 2020 at 05:30
Russia is reporting twice as many tests as Germany according to Worldometers, so it could be that Russia has a lower mortality rate at least in part because it is testing better (though the difference is so shocking that there is probably some underreporting as well). I find this plausible Russia would be testing better as it was also hit later and thus should have had more time to prepare. The methodology for counting deaths does seem to vary significantly between countries though; I imagine we will only be able to get a true apples-to-apples number from looking at changes in all-cause mortality during this period.
Benjamin, trade with China has been falling the last few years at the same time it’s gotten more repressive, so I’d say falling trade is coupled with fewer freedoms in China.
10. May 2020 at 09:36
Were the Fed to announce an NGDPLT regime, what are the odds that they would wait until after the election to do so? It seems that the translation period might present a chaotic period of time in which politicians are too overwhelmed with other things to spend too much time criticizing the Fed.
Bernanke’s Fed came to a consensus that NGDPLT was superior to inflation targeting but they were too afraid of conservative politicians to implement it. It seems like now, or sometime close to now, would be the most opportune time to announce such a change, because media bandwidth is taken up with other stuff. It doesn’t seem to me that announcing a change now really moves the needle on political risks to the Fed. I think that all of the risk really comes from dissatisfaction with the economy and with partisanship.
10. May 2020 at 11:21
FS, Moving aggressively doesn’t help much if you are not moving in the right direction. The BOJ looks like it’s moved aggressively, but to no avail.
They really need level targeting, not more QE.
I agree that the RGDP/NGDP relationship is much weaker now, due to the big real shock of Covid-19.
dtoh, I disagree on both points. I don’t think Montana can be explained by differences in testing, indeed I’m almost certain it cannot. And increased testing does not explain the shape of North Dakota’s curve, except to a very minor extent.
And Covid-19 mortality estimates are wildly inaccurate in a number of developing countries, a point that is widely accepted among experts. For instance, they don’t match total mortality estimates at all in some places. (If you are claiming total mortality estimates are fairly accurate then I agree, but total mortality in Russia is rising fast.)
Matthew, I agree. This problem is much easier to address when caseloads are low.
Tim, Excellent example.
Mark, A month ago we saw Chinese traders returning from Russia to China with very high rates of infection. Yet at the time Russia showed low rates of Covid-19. I suspect Russia was a bit behind the curve on both testing and reporting mortality. Like China and France and the US, I expect they’ll eventually adjust their mortality estimates upward.
Burgos, I think that’s very unlikely.
10. May 2020 at 11:57
Montana is much less dense than Vermont. That has to be considered before making any conclusion.
* The comment about the Bangkok Post is a bit offensive. The writer implies that “only” the Bangkok Post reported, as if the Bangkok post is not a leading paper. It is! Bangkok is a powerhouse in Southeast Asia, and has been for quite some time. Thailand has arguably the world’s best medical professionals (outside of cuba), which is why we lead the world in medical tourism. We also have a booming tech industry. Many of the world’s robotics and startups are coming out of BKK and SG now. And most SFO firms have branches in SG and BKK (SV is simply investing in those startups).
Moreover, the U.S. is renowned for it’s propaganda news agencies. The only decent journalism coming from western countries these days is Reuters. The rest of it is partisan nonsense. And has been since the mid-90s.
I think Americans are living in a delusionary world. Yes, in the 1960’s America was a powerhouse, had good objective journalists, great economy – it still had internal problems, but not like today. Today America is just a comedy show. So if you want to know why your agencies don’t carry the story, and “only little Bangkok Post”, it’s because “Little Bangkok Post” is a real newspaper that reports objectively!
10. May 2020 at 16:36
Scott,
If want to ferret out the phony data, you DO indeed need to look at the evidence (as well as basic math.)
1. The magnitude of the Montana curve (or any state) will be affected by testing intensity, but as we all agree because of differences in testing, the number of “confirmed” cases doesn’t necessarily give you an accurate picture of the magnitude of actual cases.
2. If you have a constant testing regimen; however, then the shape of the curve of “confirmed” cases will give you an accurate picture of the shape of the curve of actual cases and the rate of acceleration or decline in actual cases. Montana is a good example of this and the path of the disease is very similar to what you see in most places that have had relatively constant testing regimens.
3. North Dakota, on the other hand, has NOT had a constant testing regimen. Beginning on April 22, the number of tests increased four fold over a roughly 10 day period. That’s why instead of a decline you see a relatively flat curve for new “confirmed” cases.
10. May 2020 at 17:06
Scott,
I do think though that mortality data do give a pretty good indication of actual cases. So I think it’s safe to conclude that the actual case rate is higher in North Dakota than Montana. Here’s my hypothesis..
Almost all the cases in two states are in Fargo, Bozeman, and Jackson areas. This matches population pretty well, except that Billings, the biggest city in Montana has had very few cases.
Nobody goes to Billings in the winter so this suggests that travel might be implicated. The only people who go to Bozeman and Jackson in the winter are skiers and they are not sitting inside with locals very much. Visitors to Fargo on the other hand are more likely to be spending time with locals because they go there on business or to visit family or to dispose of bodies in woodchippers.
10. May 2020 at 19:03
Are there experts at understanding how the Fed thinks about politics and what kind of risks it faces? From the outside it looks like they are way too risk averse, but I haven’t found good models of why, or what, if anything, might change their minds.
11. May 2020 at 00:17
Why would Russia undercount deaths while accurately counting cases? Death numbers are almost certainly more accurate. Almost no countries identify even 10% of actual infections, and I see no reason to believe that Russia is any better. While I haven’t looked at their trends, the numbers above suggest that a lot more Russians will die over the course of the next month. 200 000 confirmed infections probably means at least 2 million real infections, out of which 10 000 will die.
11. May 2020 at 01:52
What? Apparently I live in another Germany. In the first few weeks we “checked” people mainly by phone. You can of course measure your oxygen level as much as you want to, but if it really drops significantly, then it’s already very serious, it is an overrated measure. You don’t need a pulse-oximeter in order to tell that you are having trouble breathing.
What shocked me were the American guidelines of the first weeks, which practically banned non-invasive ventilation. It was strongly discouraged, because with non-invasive ventilation the virus is distributed in the room as an aerosol. The German guidelines also warned of the potential danger of infection for healthcare workers, but also emphasised that non-invasive ventilation is better for the patient.
The first autopsies in Hamburg indicate that pulmonary embolisms could also play a relatively large role. The examination group was small, but 50% of those examined had pulmonary embolisms.
And the cause of death was pneumonia in 100% of cases, i.e. the cause of death that CCP deducted from Covid-19 positive patients, which explains their “low” death figures. Probably the Russians are cheating, too. It’s interesting to see how Scott believes the CCP again, but not the Russians.
Putin’s regime is vicious, but his control is still not as totalitarian as in CCP China, he cannot control the data as much as the CCP.
I clearly agree with Scott on one point: I also believe that medical care does not play a major role. A big factor in the different death rates in Western countries is probably the nursing homes.
Germany and Austria, for example, have quickly sealed off their nursing homes, while in countries like the US, UK, Sweden, France, Spain, there seems to be a lot of deaths in nursing homes. In US states like NY and NJ 30-50% of the deaths seem to come from nursing homes.
11. May 2020 at 05:41
I’m brought back to something Christian said a few weeks ago about “smart testing” in Germany. At this point, the US is doing more testing than most countries, but we only test people with symptoms. My understanding is that countries like S. Korea and Germany did contact tracing, testing and isolating people who do not yet present symptoms. Both countries appear to be opening up successfully with a much lower volume of testing than I would have thought to be sufficient. My takeaway, is that the plan should be to get the numbers down low enough that effective contact tracing can be performed.
We still have a lot to learn about the virus, and I have no explanation for Japan’s relative success.
I don’t believe Russia or China’s numbers because they are probably both lying. I don’t have confidence in our numbers, because at this point we are still too overwhelmed to get accurate counts.
11. May 2020 at 11:23
dtoh, Testing is endogenous, it tends to respond to caseloads in various states.
Aleksander, See the PS on my new post, the Russian underreporting is now confirmed.
11. May 2020 at 13:10
ssumner:
I don’t doubt that deaths are undercounted in Russia, but that just means they’re probably doing an even worse job at identifying living infections.
11. May 2020 at 16:12
Scott,
It doesn’t matter if it is endogenous. If you have a constant test regimen (e.g. tests only done on people with 3 days of cough and a fever over 37C) then changes in confirmed cases (i.e. positive test results) will accurately reflect changes in actual cases.
You can easily tell if the test regimen has changed by checking the rate of positive test results. For example, in North Dakota while the rate of testing was rapidly increasing, the rate of positive test results fell from 10% to 2.5%. So very clearly, the testing is not just responding to the caseload, instead they have actually changed to a more intensive (looser criteria) test regimen, which is why you see a plateau in new cases rather than a decline.
Follow your own advice and “look at the evidence.”
11. May 2020 at 23:59
Tim, thanks for mentioning Krugman’s “Ricardo’s Difficult Idea”. I found the article at http://web.mit.edu/krugman/www/ricardo.htm and thoroughly enjoyed the read!