

Never reason from a quantity change
David Beckworth has a graph showing the relationship between inflation and the size of central bank balance sheets, as a share of GDP:
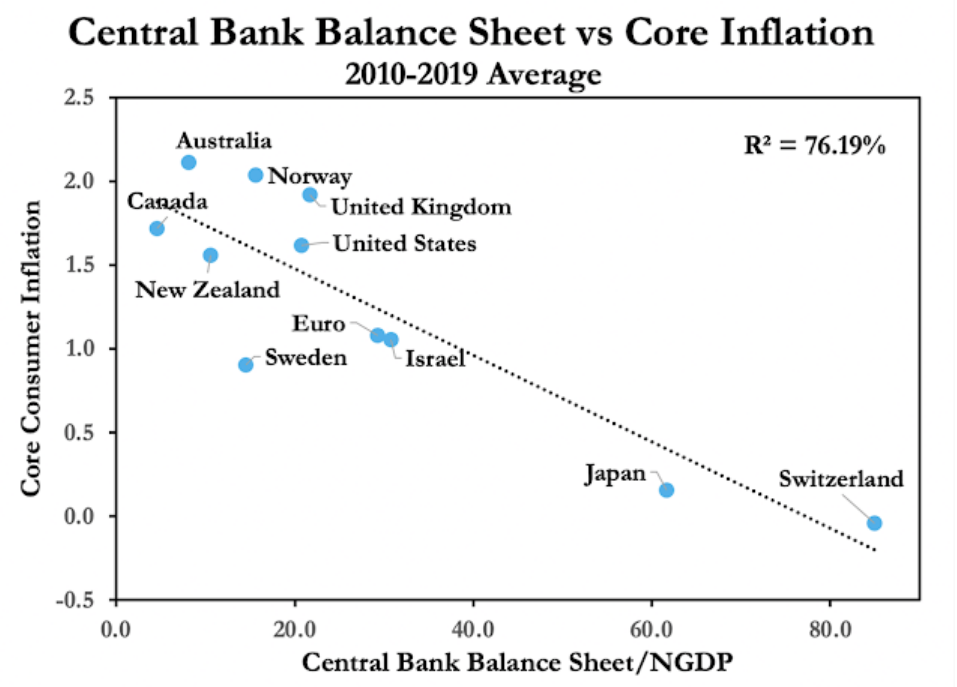
(You get roughly the same result with either NGDP growth or nominal interest rates on the vertical axis.)
So why is this line downward sloping? Shouldn’t printing lots of money lead to higher inflation?
Just as one should never reason from a price change, you also need to avoid reasoning from a quantity change. When expected inflation falls to extremely low levels, the opportunity cost of holding base money declines and the demand for base money rises sharply.
At this point the central bank faces a choice. They can do nothing, in which case you’ll end up with the sort of severe deflation that we saw in the early 1930s, or they can inject enough base money into the economy to keep prices roughly stable. The BOJ and the SNB decided to avoid severe deflation by accommodating the increased demand for base money.
People often ask whether QE “works”? That’s as nonsensical as asking whether lower interest rates work. It depends on whether the QE is temporary or permanent, and also whether the QE is creating excess cash balances, or merely accommodating an increased demand for base money. Similarly, it depends whether lower interest rates are caused by a tight money policy or an easy money policy.
What “works” is a level targeting regime combined with a whatever it takes commitment to increase the base (or decrease the base) enough so that market expectations of inflation equal the policy target.
Suppose I am wrong, and the graph above somehow proves that increasing the money supply doesn’t “work”. What then? Does that mean we should forget about the money supply and target interest rates? Not at all.
You could construct an alternative graph showing the relationship between inflation and nominal interest rates. That graph would have a positive correlation. And how should we interpret that positive correlation? Would it imply that lower interest rates lead to lower inflation?
If you think the graph above shows that QE doesn’t “work”, you’d be forced to conclude that reductions in interest rates also don’t “work”. But those economists who are skeptical of the efficacy of changes in the money supply are often big believers in the efficacy of changes in interest rates. Unfortunately, in the realm of macroeconomics most economists either reason from a price change or they reason from a quantity change.
The graph shown above merely reflects the fact that inflation is a proxy for the opportunity cost of holding money, and thus it’s merely telling us that demand curves slope downward. That’s not surprising!
The positive relationship between inflation and nominal interest rates reflects the Fisher effect, the fact that lenders and borrowers care about real interest rates. Because money is neutral in the long run, the nominal interest rate will tend to rise with inflation. That’s also not surprising.
Lots of things that seem strange from one perspective look perfectly normal if you avoid reasoning from a price change, or a quantity change.
PS. My favorite part of David’s post shows a graph comparing population growth rates and real interest rates. It seems clear to me that the global slowdown in population growth is one factor in the long run downward trend in real interest rates.
Tags:
22. November 2020 at 00:33
It seems clear to me that the global slowdown in population growth is one factor in the long run downward trend in real interest rates.–Scott Sumner
Interesting. Of course, back when I was futzing around with Fortran cards, there was not the merest whisper that population growth and interest rates were linked.
And inflation has come down too. Sumner says real interest rates are linked to inflation, so….
Suppose the US goes to zero population growth, and eases up on property zoning. Would the US be more prone to deflation—-thus leaving a larger window open for money-financed fiscal programs?
I think so.
It does seem the developed world in moving to deflation, which opens up a new vista for macroeconomics, certainly in a practical sense.
What is the point of borrowing money (and piling debt onto taxpayers) to build infrastructure, a military, a healthcare system, when in practical terms it can be built through money-financed fiscal programs without inflationary consequence?
Maybe inflation is like gaining weight. Why do you gain weight? Exercise? Eating? If you take up smoking, will you lose weight (look at old newsreels, and no calories in smoke). If you eat a lot but mostly vegetables, will you gain weight?
So, if you exercise a lot, eat vegetables and smoke, maybe you can eat all you want, and not gain weight.
Maybe the US can move to money-financed fiscal programs, and not endure inflation.
I still wonder about forward guidance.
David Beckworth also ran a chart on what all the experts thought was the future for interest rates. In the real world interest rates go up and down, but in forecasting land they ever are pending flat to usually higher.
The Fed proposes, but the market disposes?
22. November 2020 at 00:33
“People often ask whether QE “works”? That’s as nonsensical as asking whether lower interest rates work”.
The only thing nonsensical about that question is Scott’s response.
The truth is that we don’t need QE. We never needed QE. We don’t need a Fed. We never needed Fed.
Think about the last few injections of QE.
1. 2008-10″ Banks should have simply failed. But no, govt stepped in on behalf of the “globalist elite” to force the American middle class tax payer to foot the bill.
2. 2020: Globalist elites want to coordinate global shutdowns to kill off small businesses. Every academic study worth its salt shows that masks have zero efficacy. 13K scientists signed the Great Barrington Declaration. No real scientists outside of government believe we should be shutting down our economy.
Response: inject three trillion of money we don’t have into the market system so the government isn’t overthrown by bedraggled, starving bodies.
QE is a great name for government theft. A reckoning is coming soon.
22. November 2020 at 00:58
QE is only needed as a solution to problems government create themselves.
1. Covid lockdown scam.
2. Shadow banking
END THE FEDERAL RESERVE.
END SOCIALISM.
HOLD POLITICIANS ACCOUNTABLE
NEVER TOO BIG TO FAIL
And then you don’t need QE.
22. November 2020 at 03:15
Scott,
If we put you in charge of the Fed, what doomsday rate of inflation could we expect from your crackpot policies? 2.5%? Maybe as high as 3%? And for how long would honest people tolerate this debasement of their money before they started spending it on services that would drive the unemployment rate down to 1%?
We might need immigrants to make up for labor shortages under such awful conditions.
22. November 2020 at 05:15
Despite all the nonsense that one can see on this sight (mine included) Scott has taught me one or two concepts (or at least persuaded me) that has been very valuable to me. First, “holding money has an opportunity cost” and second “a whatever it takes attitude to be sure market expectations meet equal policy objectives”.
In economics, what I remember at least, we would have seen the above chart and be doing multi-variable regressions on the relationship between NGDP+Interest rates+ Balance sheet size and create a “correlation”(“don’t forget, correlation does not equal causation” !) and “explain” inflation. Which, it would not have on its own.
I do wonder, though, why a Fed is necessary. It has made massive mistakes multiple times. We have created what often seems like a “serial correlation economy” —-GDP has the illusion of being more stable——except we then have the blow ups—usually caused by the Fed.
22. November 2020 at 07:12
“You could construct an alternative graph showing the relationship between inflation and nominal interest rates. That graph would have a positive correlation. And how should we interpret that positive correlation? Would it imply that lower interest rates lead to lower inflation?”
I know at least one MMT type who insists that is true….
22. November 2020 at 08:56
David, I’d guess that my policy would lead to around 2% inflation in the long run, reaching 3% in the worst years and 1% in the best.
Tim, I plan to do a couple posts on MMT this week.
22. November 2020 at 11:28
I’m not sure how robust that trendline is. If you remove Switzerland and Japan from the chart, the R value drops to 0.1. And, Switzerland and Japan are countries with very different central bank holding profiles considering Japan has government debt of 223% and Switzerland of 33%.
22. November 2020 at 12:29
Carl, With the introduction of IOER you’d expect the relationship to weaken dramatically, But prior to 2008 it was pretty strong, especially if you brought in a lot of very high inflation countries.
22. November 2020 at 14:42
Misleading Sumner post. Beckworth specifically says, contrary to Sumner’s reasoning, except for the “PS” at the end, that this chart shows central banks are powerless viz inflation.
https://seekingalpha.com/article/4390874-storytelling-friday-chart-edition “My explanation for these charts, forthcoming in a working paper, is that something else is driving both the low inflation and the expanding central bank balance sheets.” (David Beckworth)
Beckworth goes on to say demographics determine long run interest rates (Japan has low inflation due to low demographics, Israel has higher inflation due to higher demographics).
And poster “xu” is right, deflation is nothing to be afraid about (money is largely neutral, short term and long).
22. November 2020 at 15:30
Does this mean anything more than when trying to estimate the slope of a demand or supply curve, be a sure as you can that you have isolated the effect of price or quantity from other variables that affect the amounts demanded or supplied?
22. November 2020 at 16:09
Tim, I plan to do a couple posts on MMT this week—Scott Sumner
I hope you include a section on Depression-era Japan, or I should say “non Depression-era Japan,” since Japan was the lone developed nation to sidestep the Depression of the 1930s.
22. November 2020 at 17:51
I love the radically different conclusions drawn by Sumner vs. Beckworth, over the exact same data / charts. (Even silly troll Ray Lopez noticed, but of course he backed the wrong horse, as usual.) Of course Sumner is correct, and Beckworth is mistaken.
This seems like a classic “causation vs. correlation” confusion. It seems that Beckworth needs to go think about Friedman’s thermostat again. (Nick Rowe: https://worthwhile.typepad.com/worthwhile_canadian_initi/2012/07/why-are-almost-all-economists-unaware-of-milton-friedmans-thermostat.html )
22. November 2020 at 18:31
@Don Geddis – thanks for noticing. I read you too. Before I retired at age 40–look at the jokers in this forum, still working–I made well into the six figures for my keen eye. Then I inherited a ton of money from relatives, stopped working, and you know the rest, I’m in the 1% in net worth. You can bet on monetarism as a cure for what ails the USA, but in the end, you’ll be backing a longshot.
22. November 2020 at 19:47
Quite right, and in the US, this graph I produced indicates the Fed Funds rate is nearly 1.5% above the neutral interest rate:
https://twitter.com/mike_sandifer/status/1330718432287920129
I produced this graph by translating changes in the S&P 500 discount rate into changes in NGDP growth expectations.
22. November 2020 at 19:52
Update: Neutral rate is at least 1.5% below Fed Funds rate, as we still hadn’t recovered from the trade wars before the Covid crisis started.
https://twitter.com/mike_sandifer/status/1330720474842738689
22. November 2020 at 22:55
Ray, You said:
“Beckworth specifically says, contrary to Sumner’s reasoning, except for the “PS” at the end, that this chart shows central banks are powerless viz inflation.”
I must have missed that part.
Thomas, That’s one way of putting it.
27. November 2020 at 05:54
After I originally commented I seem to have clicked on the -Notify
me when new comments are added- checkbox and from now on whenever a comment is added
I recieve four emails with the exact same comment.
Is there a means you can remove me from that service? Appreciate it!