

Life expectancy in Shanghai
Here’s Paul Krugman:
I’m being flip, but the AQI in Delhi was 263, which is serious don’t-breathe-too-hard territory; actually, on day one I blithely tried my usual morning routine, and really felt the difference. Hong Kong was better but having an unusually bad stretch, and Shanghai was back to the air apparent. No big deal for me, of course, but the health costs to those who live there must be immense.
The pollution is quite bad in Shanghai, but I wonder about those health costs. Are they truly “immense?” Here’s a list of life expectancy of some countries. Japan leads the world, and Iceland leads Europe. Of course Iceland has virtually no air pollution. I also included some other East Asian countries:
Japan 84.6
Singapore 84.0
Hong Kong 83.8
Iceland 83.3
Shanghai 82.3
Beijing 81.3
Korea 81.0
Taiwan 80.6
US 79.8
Denmark 79.5
If the health cost of air pollution is immense, why is Singapore’s life expectancy only 0.2 years above highly polluted Hong Kong? Also keep in mind that the Chinese smoke at a very high rate, which could easily take a year off their life expectancy, even with no air pollution. And if the cost is truly “immense,” what adjective would describe the health cost of all that cheese, butter and bacon consumed by the Danes?
Every few years I spend a month in Beijing, which is much more polluted than Shanghai. After the first day you never pay any attention to the pollution, except that it makes the city look uglier. The severe pollution in Beijing probably does slightly reduce their life expectancy, although the fact that Shanghai is richer and has a milder climate may also explain part of the difference. But I get really annoyed when I read press reports like this one:
They’ve learned too that in the two decades from 1981-2001 the life expectancy of the 500 million Chinese living in the north was a full 5.5 years shorter than that of their fellow citizens in the south. The reason? Heavier coal use for heating during the north’s frigid winters.
That’s not at all what the study they refer to (by Chen et al) claims. Andrew Gelman and Adam Zelizer have an excellent paper that uses the Chen et al study to look at the broader issues of statistical significance. Here’s a graph from the study they criticize. I don’t see any difference in life expectancy between the north and south of China. The finding is based on the assumption that the data should be fit with a cubic model rather than a linear model. Here’s the graph showing where the 5.5 years comes from:
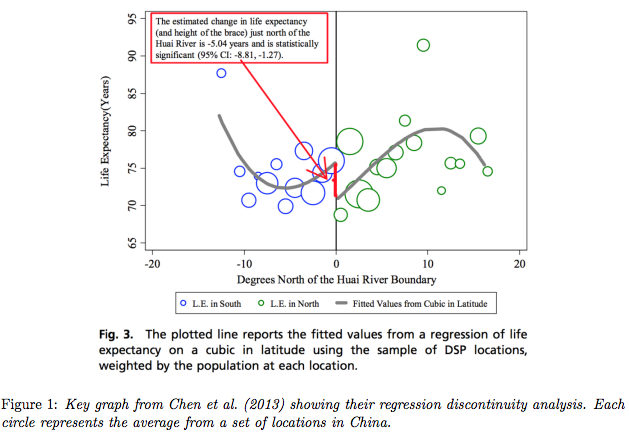
How much confidence can we have that the cubic model is correct?
And this is even more dubious:
Now that we know China’s air pollution problem is impacting the air here in the United States, it’s important to understand what that pollution is doing to public health in China.
According to a new study, it could be taking up to 16 years off people’s lives.
I’ll end with some sensible suggestions from the Gelman/Zelizer paper:
4.3. Skepticism without nihilism
The current rules of publication seem to us to be simultaneously too loose (in the sense of accepting the highly questionable analysis indicated in Figure 1) and too restrictive (in essentially demanding statistical significance, obtained some way or another, as a condition for acceptance).
. . .
We have the impression that research journals have an implicit rule that under normal circumstances they will publish this sort of quantitative empirical paper only if it has statistically significant results. That’s a discontinuity right there, and researchers in various fields (for example, Button et al., 2013) have found evidence that it introduces endogeneity in the forcing variable.
PS. I do wish the Chinese government would institute changes in local governance and/or property rights that would reduce pollution. It’s not as bad as is claimed, but it is still a problem. Gelman and Zelizer also emphasize that the are not questioning the claim that China has a severe air quality problem, merely the reliability of the 5.5 year estimate widely cited in the media.
Tags:
17. February 2015 at 11:39
If you control for homicides and traffic accidents (stuff that has relatively little to do with the direct harm of air pollution), you can see that there is very, very little variation in life expectancy across the countries you mention. Instead of five years from top to bottom you get less than 2 years. See the analysis here:
http://angrybearblog.com/2009/07/per-capita-spending-and-life-expectancy.html
17. February 2015 at 11:59
Wouldn’t one of the big problems of current air pollution is the effects might be decades versus immediate data? So the very high pollution in Beijing might have more effect in 20 years in terms of life expectancy.
17. February 2015 at 12:06
Putting life expectancy to the side, there is a lot of evidence that pollution exposure (even at relative low levels in the US) in utero or early childhood has negative health effects (low birth weight, etc.) There is also some recent (credible) evidence that early life pollution exposure has long-term effects – see Currie et al. “What Do We Know About Short- and Long-Term Effects of Early-Life Exposure to Pollution?”.
17. February 2015 at 12:56
You need early deaths to make big differences in average life expectancy, and presumable air pollution doesn’t kill a lot of people in the teens, for example.
And as OneEyedMan said in the first comment, we do a lot to drag down our overall life expectancy with our cars and violence.
17. February 2015 at 13:12
Off-Topic: WHY WHY WHY are risk-free interest rates soaring higher and higher????
http://www.businessinsider.com/treasury-yields-are-spiking-2015-2
17. February 2015 at 13:14
Gelman’s example of fitting a cubic function to get a p-value is a classic. His blog should be on everyone’s daily reading list.
Although it is frequently (Bayesian-ly lol?) quite technical there’s more than enough on experiment design, publication and replication issues, plagiarism, and his current running contest, the selection of the best seminar speaker of all time, to be valuable to someone with a less-than PhD level of stats education (like say an economist).
17. February 2015 at 13:32
You might not die early, but you might spend your last 20 years sucking oxygen, which is what would make the health care costs immense.
17. February 2015 at 14:04
Travis
Why did those yields crater in January is the more apt question. Momentum trading?
Scott
I was in Hong Kong and New Delhi late last year. The air, ground and water pollution in New Delhi was 10x worse than HK, especially the air pollution. I was told it was due to lots of hidden diesel generators chugging away waiting to click into full action to bring on emergency power to cover up for the frequent power cuts. There are no power cuts in super efficient HK.
17. February 2015 at 14:05
When you get into the details of LE, it’s surprising how much uncertainty there is in these calculations, and how much variations there is within the United States. The variation within the U.S. is actually about the same as the variation within the OECD, which includes places like Estonia and Turkey.
17. February 2015 at 14:18
Everyone, I agree that life expectancy doesn’t pick up all the health issues, but keep in mind that the media is reporting a huge impact on life expectancy in China–and that seems very doubtful to me.
Collin, Maybe, but when I went to Beijing in 1994 the pollution was horrible. So they’ve had quite a long period. Also recall that China’s had lots of other problems over the earlier decades, which would have been expected to reduce life expectancy. Low quality health care, famine, poor nutrition, etc.
TravisV, I don’t know.
James, That doesn’t surprise me, but I’d point out that Hong Kong does have much worse pollution that Singapore–so much so that some businesses have moved for that reason. Of course much of the HK pollution comes from across the border, so it’s not their fault.
TallDave, I also recall that there is a surprising amount of uncertainty about the data. Is that right? I recall a claim a few years ago that American Hispanics had a long life expectancy, and then someone questioned the data.
17. February 2015 at 15:45
Life expectancy doesn’t measure what you think it does.
A high life expectancy doesn’t mean that that people are living longer into their old age. It means that fewer people die when they young.
Infant mortality is the primary driver of life expectancy.
The next biggest factor is accidents.
17. February 2015 at 16:34
Doug, You said:
“Life expectancy doesn’t measure what you think it does.”
Yes it does.
“A high life expectancy doesn’t mean that that people are living longer into their old age.”
Yes it does, at least in this case.
“It means that fewer people die when they young.”
Life expectancy at age 65 has recently significantly in recent decades.
17. February 2015 at 16:37
I grew up in Los Angeles when it hurt to take a deep breath, the 1950s and the 1960s. You could see the smog looking across the street. Lead in gasoline too.
You do wonder what is the point of progress when you cannot take a deep breath. Still, I see little health effects among my peers.
18. February 2015 at 02:18
“A high life expectancy doesn’t mean that that people are living longer into their old age”
When I was younger, reaching 100 was virtually non-existent, now the tail has moved out to about 114-116 yrs. Also we are aging so much better than we did just 30-40 years ago.
18. February 2015 at 04:27
OneEyedMan, how is the typical life expectancy around 76 in your chart while it’s around 80-84 in Sumner’s post? Is that the average life expectancy for the 90’s?
As far as air pollution, Japan and Switzerland are high on the list of cigarette consumption per capita. I wouldn’t argue that smoking doesn’t reduce LE because two of the countries who smoke most have the longest life expectancies.
Also, except for maybe Hong Kong, those Chinese cities have only had the current level of air pollution for perhaps 10-20 years. What would be the effect on LE after 40+ years of exposure at the current levels?
Air pollution could also affect people differently, just as some people don’t get cancer from smoking. Let’s say 10% of people have their life expectancy reduced by 10 years. That’s a pretty significant reducing in lifespan, but only shows up as a year less in the LE statistics.
18. February 2015 at 05:43
The studie nicely fits into a very good blog I once read around statistics: http://t-a-w.blogspot.sk/2009/12/misunderstanding-statistical.html
Short summary of ho he sees this hunt for statistical significance:
Gather data
1) Throw data at some statistical package
2) Keep tweaking “hypothesis” until you get “statistically
significant” answer, and send for publication
3) If no “statistically significant” answers are obtained, usually forget about the entire thing, or maybe send for publications anyway and hope it gets accepted
4)Watch people misinterpret “statistically significant” as “almost certainly true” and “not statistically significant” as “almost certainly false”
18. February 2015 at 06:47
I sprayed my coffee laughing when I saw that cubic fit! Chen et al was published in PNAS, which I didn’t realize was a joke journal…
18. February 2015 at 09:52
Matt, The Chinese are very heavy smokers. And I didn’t say that air pollution does not reduce life expectancy.
I addressed the long term affect in an earlier comment. But recall that the claim was that life expectancy had already been reduced sharply.
18. February 2015 at 12:06
Modestly positive market reaction to this news: “Many Fed Officials Were Inclined to Keep Zero Rates Longer”
http://www.bloomberg.com/news/articles/2015-02-18/many-fed-officials-inclined-to-stay-at-zero-longer-minutes-show
18. February 2015 at 14:30
Man, the north shore of that river must be lined with dementors. That’s some powerful voodoo.
If I may toot my own horn, Scott, I just finished a post on my series on housing (this one on the run up to the crisis), and it’s one of those where I had kind of looked at everything, but when I sat and put it all together, I was shocked at how clear the story it tells is. You and your readers might like it. Let me know if I’ve messed up anywhere.
http://idiosyncraticwhisk.blogspot.com/2015/02/housing-tax-policy-series-part-8-crisis.html
18. February 2015 at 15:24
what adjective would describe the health cost of all that cheese, butter and bacon consumed by the Danes?
Seeing as how cheese, butter and bacon are HEALTHY, I’d say the health cost is nonexistent.
19. February 2015 at 04:07
Scott,
unrelated to anything….how about a BIRDMAN review ????
19. February 2015 at 04:31
Completely off-topic, but I found this fascinating
http://www.overcomingbias.com/2015/02/ian-morris-on-foragers-farmers-industry-ems.html
19. February 2015 at 04:31
Kevin,
I notice one mistake. You reasoned from a (lack of) price change in homes, and you reasoned from a price change in stocks.
If half of the rise in home ownership is associated with no increase in prices, then it is so because supply increased. And why shouldn’t supply increase? Home builders knew that the 1994 regulatory change would likely result in more spending on homes. S they build. But they did not build enough to keep the entire C-S index unchanged.
Also, it is not the case that home prices must correlate with stock prices.
Yes, 64% to 69% is on a superficial basis a modest increase. But you can’t only look at the number itself. You have to consider who those homebuyers are. Given banks have already lent to worthy home owners prior, it I’d reasonable to assume that the great bulk of the increase are from home buyers who otherwise would not have bought homes. Sub-prime borrowed, etc. That is just one factor among many that you guessed it, has nothing to do with NGDP.
The biggest mistake though is your assessment of the “timings”. I think from your intellectual background in equilibrium modeling you don’t have enough nuance and understanding of the market process. You write that the timing between the fed funds rate and the mortgage delinquency rate do not align the way they should. You suggest that if rising rates had something to do with the delinquency, that the delinquency rate should have risen earlier. But the theory of interest rates and mortgage delinquency rates is not supposed to have only happened exactly concurrently. You’re therefore addressing a straw man.
Rates rising would of course have a delayed effect on mortgage delinquency rates due to such things as dipping into savings, mortgage rate resets taking place not every single minute, as well as lenders offering a delay in payment.
Nothing happens in the market instantaneously.
Those are just some initial points, I stopped reading after that.
19. February 2015 at 04:40
Kevin,
Also, the fed funds rate is not a 30 year mortgage rate, which is itself not the 10-year treasury rate.
Most importantly, there is never one single real variable that is the cause for why things happen. If you look at many different real variables, and in isolation they have only a modest effect on the total, then it would be wrong to go through them one by one, and dismiss them one by one, on the basis that they are each too small when considered one by one.
The market IS those myriad of small variables.
19. February 2015 at 06:11
Prof. Sumner,
Any estimate for when your Oxford University Press article on Friedman is coming out?
http://mises.ca/posts/blog/would-milton-friedman-endorse-todays-market-monetarists/#IDComment897717770
19. February 2015 at 10:21
Thanks Kevin, I’ll take a look.
Daniel, I’m willing to believe that might be true, but it does leave open the question of why Danes live shorter lives than other East Asians and Western Europeans.
bklyn77, Haven’t seen that one. I no longer see many new films.
Daniel, Yes, I think that’s a good point about history. No one living in America today knows what it was like to live in ancient Egypt or Greece. I think we are a bit arrogant in assuming we can look down on them because of their values.
Travis, I don’t know.
19. February 2015 at 14:14
why Danes live shorter lives than other East Asians and Western Europeans.
This might be of interest
https://jaymans.wordpress.com/2013/02/09/and-yet-another-tale-of-two-maps/
20. February 2015 at 05:38
Daniel, I don’t like that post at all. He says the maps correlate “almost perfectly” but they don’t at all. Not even close. The Danish temperature map is the same color as France. But the French live much longer.
21. February 2015 at 11:45
There was a long discussion of LE and related things like IM and perinatal mortality at Megan’s place several years back, during the PPACA debate. Some countries still do not count low birthweight infants to be live-born despite a 1980s WHO standard, Japan is known to have a gender discrepancy in how it records stillbirths, and some countries just don’t have good records.
The OECD has so little confidence in some of these numbers they often warn against international comparisons. The true MOE in reported numbers is probably about +/-5 years in OECD countries.
22. February 2015 at 06:10
Talldave, Thanks for that info.