

Is employment a lagging indicator?
There seems to be a widespread view that employment is a lagging indicator of changes in the business cycle. But it’s not clear why.
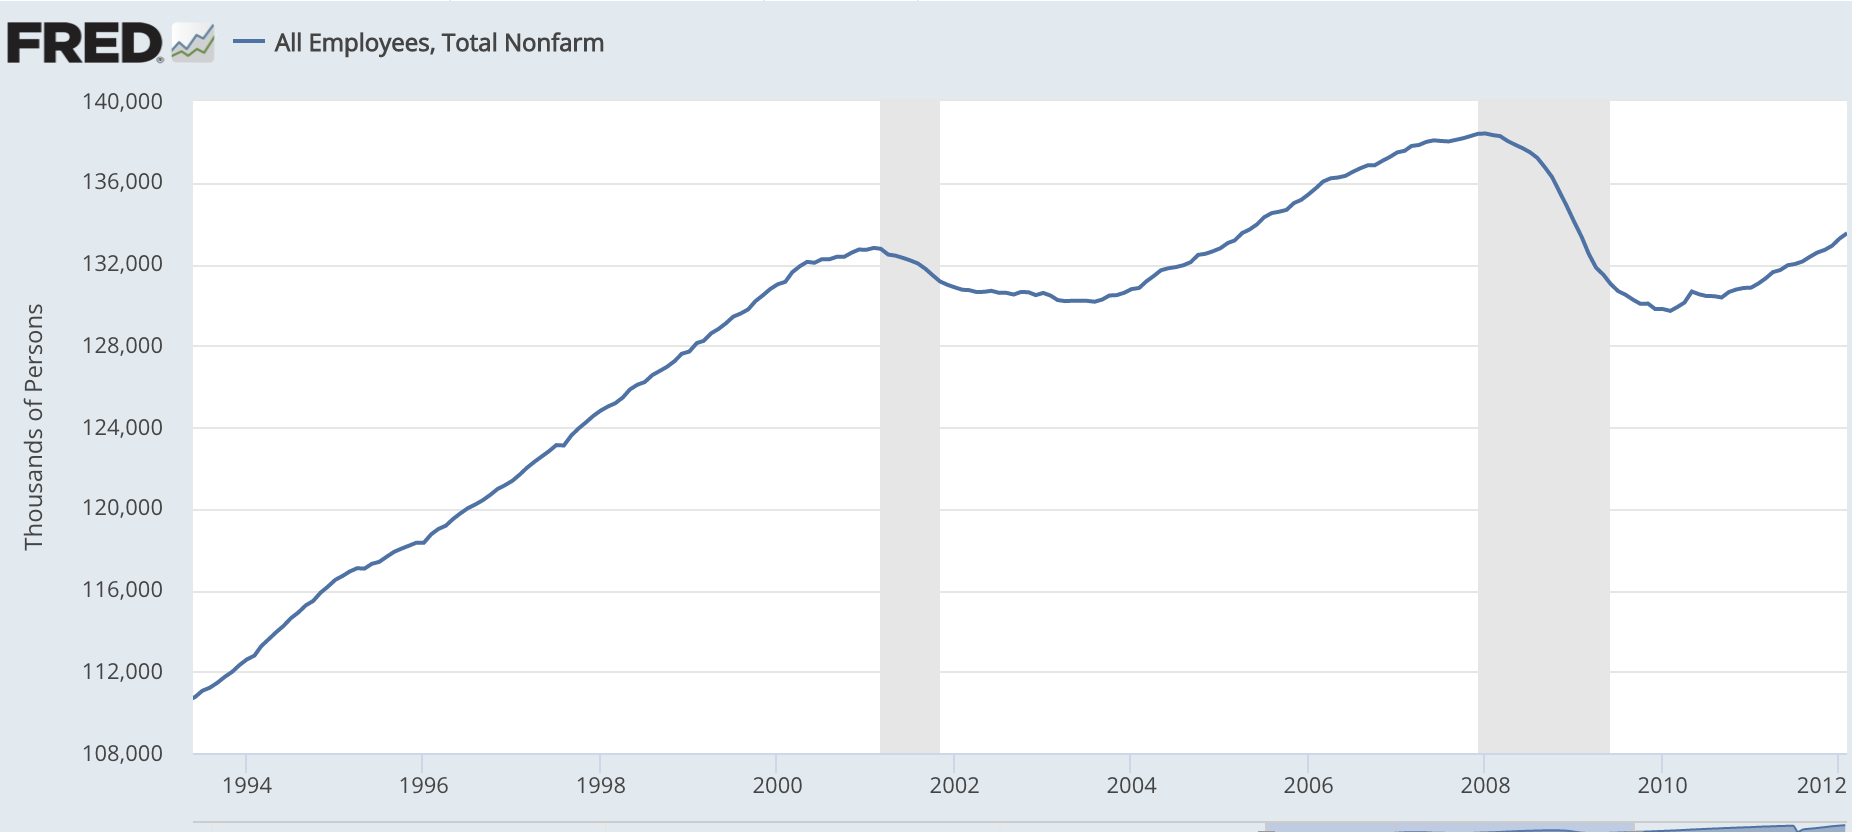
In March of 2020, payroll employment fell immediately as the economy was hit by Covid. While that was an unusual case, the 2007-09 recession was not much different. Payroll employment peaked in January 2008, just one month into the downturn. More importantly, the growth rate of payroll employment slowed sharply in the 6 months before the onset of recession. Between June and December 2007, only 323,000 jobs were created, which is far below trend.
The same pattern occurred prior to the previous recession, which began in March 2001. Payroll employment grew by only 642,000 in the 10 months between May 2000 and March 2001. Total payroll employment actually peaked in February 2001, a month before the business cycle peak.
Thus when there is no unexpected shock like Covid, it seems as though employment growth tends to slow well before the onset of recession. This is important, as the current rate of growth in employment is still far above trend. If the previous pattern were to hold this time around, then we would be at least 6 to 10 months from the onset of recession, even if employment growth immediately fell to below the trend rate of growth (which is probably no more than 100,000/month.). Now consider that Bloomberg has argued that a US recession is 100% certain by October of this year. Maybe so, but how do they know this?
I am skeptical of claims that we can predict recessions, and I don’t put a lot of weight on the pattern observed in previous business cycles. But I’m a bit puzzled that people tend to view employment as a lagging indicator. Where does this view come from? It certainly seems to have been a leading indicator in the two recessions that preceded Covid.
Tags:
2. January 2023 at 12:57
Good points!
One current oddity is that the employer survey has been showing growth but the household survey has been relatively flat for most of the past year, and it’s hard to know when it shifts from being noise to being a trend.
2. January 2023 at 13:38
Is it possible to construct this using the employment data reported at the time? My recollection is, for example, that employment numbers for the first half of 2008 were later revised down a lot.
2. January 2023 at 14:24
regarding current employment, the COVID recession is quite a bit different than previous recessions with respect to employment. The entire restaurant / entertainment industry was decimated for somewhere between 6-24mo, while shipping and some other industries experienced a massive boom for about the same amount of time. Now these industries are heading back to some modified form of their previous trends so there’s bound to be some sort of disequilibrium effect. Also we’re just coming through Xmas now and there’s been a huge push to unload excess inventory, but sales were very roughly flat relative to inflation. So in effect retail is looking at a relative downturn, shipping is looking at the same and restaurant entertainment might be looking at some upside, but how much relative to previous and considering inflation? So I wouldn’t put too much stock in the current high employment yet. If things are still going great in March, then perhaps we’ve slipped out of the noose, but my bet is they’ll be going worse in march.
2. January 2023 at 14:26
Bill, you can do that with Alfred data from the St. Louis Fed, although it increases the magnitude of the drop the revisions don’t really change the trend story.
But the reason why people refer to it as lagging (or really maybe coincident more than lagging) is because it lags leading indicators such as PMIs, New Orders data, commodities prices, market internals.
Some people refer to it as lagging because it lags other data that moves first, not necessarily the business cycle itself in my experience. Currently of course many of the leading indicators point to economic weakness (although not enough for recession inevitability in my opinion)
2. January 2023 at 19:43
Kevin, My hunch is that the payroll survey is better for cyclical changes and the household survey is better for long run trends.
Bill, I seem to recall that the revisions are generally too small to change the fact that growth often slows sharply before the recession. Perhaps someone can confirm.
Note, I agree with that.
Rafael, Good comment.
3. January 2023 at 04:07
I agree with Rafael, especially re equity indices. The Nasdaq peaked in March 2000, a year before the ‘tech wreck’ recession started. FWIW, John Hussman, a fund manager, has commented that:
“The reason our Recession Warning Composite focuses on psychologically-driven variables like stock prices, yield spreads, credit risk, and purchasing manager surveys is that few measures of ‘hard’ economic activity reliably lead recessions. For example, while recessions tend to be preceded by sub-par employment growth over the preceding 6-12 month period, job growth tends to turn negative only after entering a recession, not before. Similarly, the rate of unemployment tends to tick up slightly before a recession starts, but the strongest increases in the unemployment rate typically lag the start of a recession by about 8 months. New claims for unemployment also have only slight short-leading usefulness.”
https://www.hussmanfunds.com/comment/mc191009/
3. January 2023 at 06:50
Leading indicators are asset markets – stocks, yield curves, housing (starts, listings, inventories and contract prices), and sometimes commodities. Employment, official recession starts, and CPI/PCE tend to lag. In 2008-9, employment didn’t start to fall rapidly until we all knew we were in a recession. Other variables, like retail sales, can lag or lead depending on the context.
The covid recession was driven by a seizing up of human interaction, including employment, so employment was coincident rather than lagging. But that was unusual.
Asset markets right now are suggesting recession – even energy is down significantly from the peak, and should be higher given the supply constraints. Forward-looking housing indicators are not good, and that is a major driver of future economic activity. Yield curve inverted, stock market is down.
The labor supply over the next ten or fifteen years will probably be constrained, so absent acute crises, employment will probably hold up better than expected during recessions.
3. January 2023 at 07:50
Scott, you wrote, “the growth rate of payroll employment slowed sharply in the 6 months before the onset of recession”, referring to 2008.
Growth rate of payroll employment slowed from March 1994 to January 1996. Yet no recession followed.
Do you think the Fed engineered a soft landing in 1996?
3. January 2023 at 07:57
see: “Why is M2 Still a Component of ECRI’s WLI?”
https://imarketsignals.com/2013/why-is-m2-still-a-component-of-ecris-wli/
“The BCI is now signaling a recession, earliest in 12 weeks but not later than 25weeks”
3. January 2023 at 08:10
“Recessions, on the other hand, tend to be preceded by slowing rates of money supply growth.”
https://mises.org/wire/money-supply-growth-turns-negative-first-time-33-years
3. January 2023 at 08:15
Had the same thought as Mr. Velasquez. Here’s another leading indicator – housing starts compared to employment: https://fred.stlouisfed.org/graph/?g=YneO
But isn’t NGDP itself a lagging indicator? Hence the need for a futures market in NGDP in order NGDPLT monetary policy to work well?
3. January 2023 at 08:56
https://centerforfinancialstability.org/amfm/Chartsinside_big.gif
3. January 2023 at 09:02
Rajat, That’s all true, but does it contradict my claim that employment growth has recently fallen to well below trend 6 to 10 months before a recession? I’m not saying there’ll be no recession in the next year, I just wonder why people seem to think it will start almost immediately.
Daniel, You said:
“so employment was coincident rather than lagging. But that was unusual.”
Nope, Check the data. Employment turns down at roughly the business cycle peak. And the growth rate slows even earlier.
Todd, You can make that argument, but I define soft landing as a few years of continued growth after the unemployment rate hits its cyclical low. That has never happened in the US, but does happen in other countries.
Captain, “But isn’t NGDP itself a lagging indicator?”
No, it’s a coincident indicator.
3. January 2023 at 13:52
Based on market monetarist logic, I would expect the most leading indicator to be a speculative market. Employment would be lagging relative to that, as it tends to change more slowly. But a market monetarist would also be skeptical of trying to predict recessions, because once it’s likely the markets will already be crashing.
3. January 2023 at 14:07
We need you to talk about Blanchard’s claim on inflation being a distribution conflict. Huge discussion on Twitter
4. January 2023 at 05:47
The way I understand it, the fed issues new money in order to buy up assets.
That’s the framing.
But if that was the case the entire fed balance sheet and the backing for notes and coins would be securitised mortgages and loans, and it isn’t.
Which means that the central bank is permanently doing QE of government bonds. It’s just done more of it over the last decade or so.
And since the central bank, under the MMT view, is really just part of the government sector, that means that net government spending has simply been restricted by mainstream theology to the repurchase of government bonds.
Taxes and bond sales are funded by government.
Government spends £100. That is taxed at 20%, which means somebody earns £80. They spend that which is taxed at 20%, meaning somebody earns £64. And so on, like a stone skipping across a pond. Add up all the tax and you’ll find it equals £100.
The only time that doesn’t happen is if somebody down the chain doesn’t spend all they earn.
Those that don’t spend save, and government swaps those savings in money at a lower interest rate for savings in bonds at a higher interest rate.
All very simple, logically consistent and fully explains how the system expands over time – both privately and publicly.
In the mainstream world Banks create loans, which create deposits. Deposits are taxed by government. Bank sells loans to the central bank for ‘reserves’, which are then used to buy bonds from government. Government then has enough tax and bond income to spend having ‘crowded out’ sufficient bank deposits.
After that, banks just sell bonds to the central bank to get the reserves to buy new bonds, which is why the central bank doesn’t seem to have a large stock of mortgages, just lots of bonds. Why would banks do that? Don’t know.
As soon as you lay the mainstream narrative out in full, it makes no sense at all – particularly in the context of a growing economy. Hence why you get the narrow frame – government borrows what it can’t raise in taxes.
Ignore the man behind the curtain. Behold the Wizard of Oz.
4. January 2023 at 07:54
re: “government swaps those savings”
Banks don’t lend savings.
4. January 2023 at 08:48
TGGP, That’s right.
Ronald, You said:
“Huge discussion on Twitter”
I’d say that 90% of twitter macro discussions are nonsense. Inflation didn’t suddenly rise due to more distributional conflicts; it was caused by faster NGDP growth, i.e., monetary policy.
4. January 2023 at 11:31
There’s interesting discussion by Blanchard, Cochrane, Jared Bernstein, DeLong, David Glasner, Nick Rowe and others, both on and off twitter. I tried posting some links, but my post didn’t post.
5. January 2023 at 15:29
Funny, when I was working in finance, the most anticipated numbers and considered to be the most relevant indicators of a change in the business cycle were the monthly non-farm payrolls and the weekly initial jobless claims numbers.
5. January 2023 at 15:34
Is NGDP a conicident indicator?
By definition, it has to be. However, we don’t get the final NGDP data until nearly the end of the following quarter. That means that if the economy begins a downturn in January, it will show up in the GDP report released in May. If you are a market watcher, the GDP report is considered “old news.”
6. January 2023 at 09:55
foosion, I find it really sad that the profession is still debating the issue of what causes inflation.
Doug, You said:
“Is NGDP a conicident indicator?
By definition, it has to be.”
No, unless you think Zimbabwe was booming in 2008.