

Eliminate the LM curve? Only if we also eliminate the IS curve
Over at Econlog I have a post criticizing Olivier Blanchard’s suggestions for improving the way we teach macro. Blanchard wants to focus on the IS relationship, and pretty much discard LM:
The LM relation, in its traditional formulation, is the relic of a time when central banks focused on the money supply rather than the interest rate. In that formulation, an increase in output leads to an increase in the demand for money and a mechanical increase in the interest rate. The reality is now different. Central banks think of the policy rate as their main instrument and adjust the money supply to achieve it. Thus, the LM equation must be replaced, quite simply, by the choice of the policy rate by the central bank, subject to the zero lower bound. How the central bank achieves it by adjusting the money supply should be explained but can stay in the background. This change had already taken place in the new Keynesian models; it should make its way into undergraduate texts.
I’d rather get rid of IS/LM entirely, but if we insist on using the model, then I’d prefer we keep LM. Even with the complete IS/LM model, economists often fall into the trap of reasoning from a price change. For instance, they often assume that a fall in interest rates represents an easy money policy, even though the IS/LM model clearly suggests that it might also reflect a leftward shift in IS:
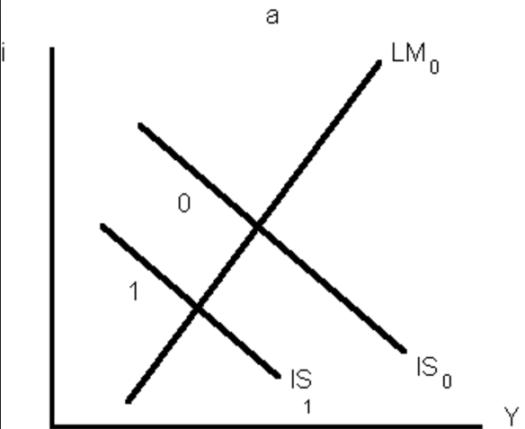
Now suppose we get rid of the LM curve, as Blanchard proposes, and instead assume that the interest rate represents monetary policy. Won’t students be even more likely to make this mistake?
My favorite example is the period from August 2007 to May 2008, when the growth in the monetary base (which had averaged a bit over 5% in the previous decade, came to a halt. This led to a sharp slowdown in NGDP growth, triggering the recession (albeit not yet a “Great” recession.) Indeed it appears the Fed triggered the Great Recession regardless of whether you accept my NGDP view of the stance of monetary policy, or whether you prefer the old “concrete steppes” approach—was the Fed injecting new money into the economy. My worry is that people will confuse the following two graphs:
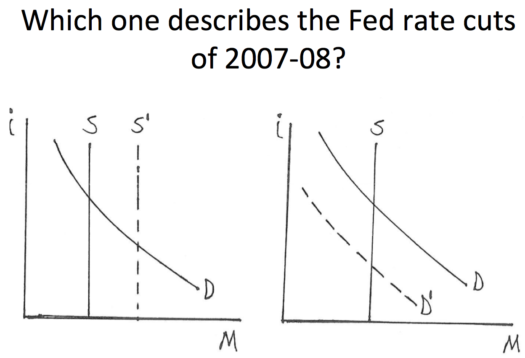
The graph on the right shows what actually occurred during the onset of the Great Recession. But if we eliminate the LM curve, as Blanchard suggests, then most students will assume the graph on the left shows what happened during late 2007 and early 2008. It will look like monetary “stimulus”. They won’t even consider the possibility that tight money might have triggered the Great Recession, as money “obviously wasn’t tight”.
What I find so maddening about all this is that we already have a macro misdiagnosis problem, and the changes proposed by Blanchard will make that problem even worse.
PS. Although I often talk about 2007-08, there are lots of other examples. Both the monetary base and nominal interest rates fell sharply in 1920-21 and again in 1929-30. In both cases money was clearly tight, as the reduction in the monetary base caused NGDP to plunge sharply. But those who focused on interest rates saw policy as being “accommodative”. If you misdiagnose the cause of the Great Depression, how likely is it that you’ll come up with effective remedies?
HT: Marcus Nunes
Tags:
4. June 2016 at 11:19
Scott, Blanchard is 16 years late with his “proposition”. David Romer had proposed it in 2000:
http://eml.berkeley.edu/~dromer/papers/JEP_Spring00.pdf
4. June 2016 at 11:28
Scott, you covered the “ideal” DAD/DAS framework put forth by Cowen and Tabarrok 7 years ago!
http://www.themoneyillusion.com/?p=3025
4. June 2016 at 16:05
“Although I often talk about 2007-08, there are lots of other examples. Both the monetary base and nominal interest rates fell sharply in 1920-21 and again in 1929-30. In both cases money was clearly tight, as the reduction in the monetary base caused NGDP to plunge sharply.”
Regarding 1921, when you say “fell sharply”, you neglected to tell your readers from what trend it fell:
https://research.stlouisfed.org/fred2/graph/fredgraph.png?hires=1&g=4Di1
Regarding 1929, when you say “fell sharply”, you neglected to tell your readers from what trend it fall:
https://research.stlouisfed.org/fred2/graph/fredgraph.png?hires=1&g=4Di3
In both cases, there was a significant increase in the monetary base in the prior years.
Why is there always always always an absence of this consideration whenever “tight money” is to blame? It is like we’re supposed to believe that when a person drinks 5 beers less a day, yes I said 5 beers, less a day, such that they get a big hangover after, that the hangover is to be explained completely by that drop in alcohol consumption, and we’re supposed to ignore the fact that the person was increasing his alcoholism prior, such that by the time he dropped his consumption by 5 beers, he was drinking upwards of 20 beers a day.
Sumner’s logic is that the hangover was caused by the drop in 5 beers per day, to 15 a day, and not that the person was drinking more and more prior to get to 20 per day.
Apparently we are to regard the 1960s as the only time in US history that had “too loose money”. Even by that arbitrary standard, the recession of 1971? Sumner still blames tight money. Apparently the too loose money should have accelerated instead.
4. June 2016 at 16:08
Something is wrong with central bank culture.
When was the last time a central banker said, “Of course, the true target is robust economic growth.”
4. June 2016 at 17:57
It is Pete Peterson blog where this was posted. No surprise. He could care less about anyone knowing anything. He funded the attack on public school teachers as if it were a grass root movement. It was an astro turf movement, fake as a 3 dollar bill.He is a bad dude, an very arrogant billionaire, like so many are these days, like Trump, Kolomoyskyi, etc.
4. June 2016 at 18:17
Sorry, Major Freedom, the Fed failed to lift bad loans off the backs of the banks, in the commercial paper market. That is fact. The Fed allowed mark to market. That is fact. The Fed took a recession based on real estate bubbles in 4 states and turned it into the Great Recession. And that is fact.
It was a classic case of liquidation, and Hoover knew that was what the Fed did, and now we know even Bernanke did it!
4. June 2016 at 21:25
Excellent blogging, Scott.
4. June 2016 at 23:00
@MF I don’t see any contradiction between you and Sumner. The hangover and the recession were caused by the drop. Also, I don’t think that Scott would disagree that ever accelerating growth is unsustainable nor that there might be a growth that is too high. There are trade-offs after all to be made and corner solutions are often unlikely. Were you two might disagree is about whether there is a bubble or that is a useful concept.
5. June 2016 at 04:21
you keep talking about AD curve being rectacural hyperbola which represent NGDP, is there any other definition of AD in as ad model?
5. June 2016 at 05:54
Fly in Sumner’s ointment: he shows a vertical AS curve. It’s upwardly sloping, but not completely vertical. Oops! But I’m sure that Sumner, a clever dodger, will come back with a reply that it’s not a bug, but a feature (never mind no textbook I know of draws such a vertical AS curve when teaching the IS-LM model).
5. June 2016 at 06:32
Denis, Yes, the Keynesian definition.
Ray, You said:
“Fly in Sumner’s ointment: he shows a vertical AS curve. It’s upwardly sloping, but not completely vertical. Oops! But I’m sure that Sumner, a clever dodger, will come back with a reply that it’s not a bug, but a feature (never mind no textbook I know of draws such a vertical AS curve when teaching the IS-LM model).”
Ah, it’s good to have the old Ray back, providing a few laughs. Sometimes I’m almost blown away by the depths of your ignorance. Is there no limit to your stupidity? Whatever it is that makes you comment like this, please don’t stop. It’s boring around here when all I have is deluded Trumpistas to mock.
Please, someone else explain to Ray why he’s such an idiot. Save me the trouble.
5. June 2016 at 06:33
Marcus, Yes, this is nothing new.
5. June 2016 at 08:42
Pretty sure his name is Olivier, as in Sir Lawrence. Don’t think it a typo, as you used the same name in your econlog post. Irrelevant to the point you’re making but just thought I would correct 🙂
5. June 2016 at 09:14
I sat down to finally understand this IS-LM thing. It seems to have zero value, as either an empirical model or a pedagogical tool.
The IS curve sort of makes sense. A lower real rate has higher RGDP because there is more capital investment? Sure, whatever. It’s good enough for government work.
But the LM curve? The theoretical justification for more liquidity holding at lower interest rates is specious, outside the zero-bound. The theoretical reason for more liquidity demand at lower interest rates is “trips to the bank.” Higher interest rates means people make more trips to the bank to carry less cash in their pocket. This is silly on a number of levels:
1. You have debit cards today. Even before those, consumers generally made large purchases such as rent or mortgage payments with checks. Consumers made other purchases with credit cards. Businesses made nearly all their purchases with checks.
2. For consumers or business which used cash, the risk of losing the cash through theft or misplacement heavily outweighed very marginal interest.
For the difference between M2 and M1, that depends on the bank reserve level. Bank deposits should be a relatively constant multiple of NGDP, assuming again we are outside the zero-bound.
What’s bizarre about the IS/LM model is this LM curve determines both interest rates and overall RGDP growth. The IS curve should depend on the fundamental structure of the economy and so LM curve is the determining factor.
In reality, real interest rates are basically independent of RGDP growth. IS-LM is also a real model and not nominal, so it doesn’t really explain unemployment. And as a pedagogical tool, the LM curve doesn’t make intuitive sense. MV=PY and AD/AS make immediate intuitive sense. Expectations make sense just from a Keynesian beauty contest perspective. IS/LM makes no sense.
5. June 2016 at 10:45
Scott,
One problem with the current macro curriculum and the changes suggested by both you and Blanchard is that the student will come away with the view that policy variables like the quantity of money, the Fed funds target, tax rates and budget deficits are the most important determinants of economic variables like prices, wages and output. Whatever models a curriculum might cover, I would hope that the curriculum would also be explicit about how much (or little) real world explanatory power those models actually have.
Do you tell your students how much out of sample variation in economic variables can be explained by naively extrapolating trends from historical values vs. how much can be explained by the policy variables in whatever models you are using?
5. June 2016 at 12:17
Gary Anderson:
“Sorry, Major Freedom, the Fed failed to lift bad loans off the backs of the banks, in the commercial paper market. That is fact. The Fed allowed mark to market. That is fact. The Fed took a recession based on real estate bubbles in 4 states and turned it into the Great Recession. And that is fact.”
You too are ignoring the fact of previous significant increases in the monetary base and only focusing on the symptoms later on.
5. June 2016 at 15:54
Zephito, That’s one of those 1/2 typo, 1/2 brain freeze. If you had asked me which one, I would have immediately remembered it was Olivier. But I’m going too fast in my posting, and I forgot to sound it out in my mind—in both places.
Stupid of me.
Matthew, I agree that IS-LM is a bad model, but I’m afraid I can’t agree with your comment. The evidence that the demand for money is a downward sloping function of nominal interest rates is so massive and overwhelming that it isn’t even debated.
James, I agree that our models do a very poor job of predicting the macroeconomy.
6. June 2016 at 05:52
@Sumner – the silence in your plea to have others explain your stupidity to me is deafening. With an audience like this, no wonder you shine. “In the land of the blind, the one-eyed is king” – French proverb.
6. June 2016 at 08:05
Scott,
Do you think that the poor predictive performance of popular macro models relative to naive models like AR(1) might indicate something is wrong with those macro models? People in other fields seem to think in this way and I’ve never heard of a reason to think macro is a special case.
Do you think there is an important lesson in how little of the variation in macro stats can be predicted variables related to fiscal and monetary policy? Specifically, that even if the people controlling policy could discover and implement an “optimal” monetary and fiscal policy, employment and output would still be largely beyond their control, and not that much different from whatever would happen under some other choice of monetary and fiscal policy?
6. June 2016 at 13:17
Ray, Everyone is too lazy. Here’s a clue, my post does not contain any AS/AD diagrams.
James, You are confusing several issues. The current models don’t do very well, but that’s because they misidentify monetary shocks. You can explain a lot of the variation in RGDP from fluctuations in NGDP. And you can explain a lot of the variability of NGDP with fluctuations in expectations of future NGDP. And you can control expected future NGDP with monetary policy.
8. June 2016 at 04:41
Very interesting post Scott. I have a question about the second figure (right side graph), which shows a decrease in money demand…
I’m a little confused…I would have assumed that the demand for money increased during the crises (hence the fall in velocity). What is the piece that I’m missing here?
8. June 2016 at 05:22
Alex, Good question, and here are two answers:
1. V actually increased slightly in the August 2007 to May 2008 period, as NGDP rose slightly while the base was flat.
2. You are right that after mid-2008 V plunged very sharply. I think of that as an increase in quantity demanded, not a shift in the demand curve. I.e. we were moving along the Md curve, which becomes very flat at zero interest rates. That’s not to say the curve itself didn’t also shift, just that the zero rates alone would cause a big increase in quantity demanded.
8. June 2016 at 10:51
Scott,
I’m not confusing anything. Perhaps you are confused by punctuation? I appreciate your replies but you seem to have neglected the question marks in my comments. I’ll try again: Do you know of any macro model that predicts future inflation, empoyment, and RGDP with smaller out of sample error variance than simple autoregressions?
To set a good example, let me address what you have said.
“The current models don’t do very well, but that’s because they misidentify monetary shocks.”
If you are claiming that a better treatment of monetary shocks can improve the in sample goodness of fit of the currently popular New Keynesian style macro models, I’m sure you are right but that’s a needlessly low baseline. If, on the other hand, there is some way to use monetary shocks to generate better out of sample forecasts than autoregressions, please do share.
“You can explain a lot of the variation in RGDP from fluctuations in NGDP.”
Of course. Changes in ln(PY) = ln(P) + ln(Y) will be correlated to changes in ln(Y).
“And you can explain a lot of the variability of NGDP with fluctuations in expectations of future NGDP. And you can control expected future NGDP with monetary policy.”
I want to take you literally and ask how much additional variation in NGDP you can explain by using expected NGDP as a variable in your model, but I fear that you are ust making an assertion without evidence. Do you have a spreadsheet of expected future NGDP that you can share so that I might reproduce your result?
8. June 2016 at 12:13
Thank you for the reply Scott. I think I’m stuck in a Keynesian lucidity trap…it’s what causes one to automatically assume that financial crises to cause economic crises rather than to predict them.
On your point #2…
(1) The issue with a movement along the Md curve, is that requires an increase in the supply of money–which is what’s argued to be missing to begin with.
(2) Being on the horizontal portion of the Md curve implies a liquidity trap. I think for the MM story to work then, there needs to be a break between base money and broader monetary aggregates (which seems to have occurred…i.e., IOER and a growing demand for fed funds from foreign banks).
(2a) Is this a difference between monetarists and MM? The monetarists assumed the Md curve was highly inelastic w.r.t. interest rates, whereas MM seems to imply the Md curve a rectangular hyperbola as assumed by the (old) Keynesians.
(3) In the following, interest rate and money are in nominal terms: Let’s say in ’06 the interest rate was 4%. In ’07 Md increases and the interest rate goes to 5% (holding Ms relatively constant). In ’08 the interest rate falls to 1%, implying the magnitude of the Ms increase outweighed any rightward Md shifts.
(4) Does the following paraphrase sound correct? The Fed’s failure to counteract the ’07 money demand increase in a timely way is what led to the Great Recession. Keynesians think MP is completely useless now but MM believes that the central bank can still do more…e.g., helicopter drops, etc.
(5) However, the only issue is that a very flat Md curve implies that any money supply increases will be hoarded as the liquidity trap theory predicts.
I know that I’m missing something here from the MM story, as I generally agree with the arguments you’re making. Perhaps the whole issue is using the IS-LM apparatus and its ancillary parts to begin with which is the source of the confusion.
Apologies if this lacks coherence. Contemplating the relationship between money demand and velocity and how the elasticity of money demand w.r.t. to interest rates affects the shape of the LM curve always gets messy. At least perhaps this post adds weight to the argument in favor of dropping it from textbooks.
9. June 2016 at 21:21
Scott,
In terms of how the U.S. monetary base behaved in the 2000s, to me the most striking thing is how it decelerated more or less smoothly over the course of the decade. Not sure I see your “significant” slowdown just prior to 2008.
See here: http://www.sfu.ca/~dandolfa/sumner.png
10. June 2016 at 05:48
David, I’m not sure I said there was a “significant” slowdown, but I believe there was. I said that there was basically no growth in the base between August 2007 and May 2008. Your year over year data doesn’t precisely pinpoint that key 9 month period. I also said that base growth had previously averaged 5%, so a 9 month period of no growth at all is kind of unusual. But yes, I agree that base growth had previously been slowing somewhat, as the rise in interest rates from 2003 to 2006 clearly boosted velocity a bit. Still, no growth at all for 9 months is rather extreme, and probably contributed to the onset of recession. (Of course I strongly oppose using the base as either an indicator or a target of monetary policy, I’m just doing the accounting here.)
But I think you missed the key point I was trying to make here. The period from August 2007 to May 2008 saw rapid declines in the fed funds rate target, from 5.25% to 2.0%. I believe that most economists thought that rates were falling due to an easy money policy (the graph on the left) whereas rates were actually falling due to a weak economy (right graph) and the Fed was merely adjusting it’s target to reflect market conditions.
When I talk to economists about tight money causing the onset of the recession, they often reply, “it wasn’t really tight money, it was a fall in V that the Fed failed to offset”. But V did not fall at all during this 9 month period! They are so used to thinking of monetary policy in terms of interest rates, that they never even bothered to look at the MB data.
Again, I do not think the base is a reliable indicator of monetary policy, it obviously soared in late 2008 as NGDP plunged, I’m just trying to clarify the distinction between errors of omission and errors of commission. It’s perfectly reasonable to claim that in late 2007 and early 2008 the Fed stopped increasing the base, and this tilted the economy into a mild recession. But the much bigger mistakes came later in 2008.
10. June 2016 at 06:11
James, You said:
“Do you have a spreadsheet of expected future NGDP that you can share so that I might reproduce your result?”
This is the kind of comment that drives me insane. I am devoting much of my life to getting the Federal government to create a highly liquid NGDP futures market, and am getting almost no support from the rest of the profession. I can’t help it if economics is still stuck in the Stone Age. Other than Robin Hanson and Justin Wolfers, what famous macroeconomists are demanding real time data on NGDP expectations? I can’t do it all by myself.
Because we lack this data. I rely on lots of other market indicators, and try to come up with a crude proxy for NGDP forecasts. Take the example of late 2008, when every single asset price that is likely linked to NGDP expectations was plunging, including TIPS spreads, stock and commodity prices, real estate prices, long term bond yields, etc., etc. Now you’ll probably say we have no proof that those price movements reflected falling NGDP expectations. Yes, I agree, which is why I want an NGDP futures market. Lacking this market, all we can do is use our best judgement, and my best judgement is that actual NGDP and expected future NGDP are strongly correlated. If someone can show me that this is wrong, I’ll change my mind. I’ll bet that this would be true even if you didn’t use my preferred asset prices, but rather some sort of VAR model that predicted future NGDP.
You said:
“Of course. Changes in ln(PY) = ln(P) + ln(Y) will be correlated to changes in ln(Y).”
There’s no “of course”. Not in Zimbabwe, and not in more developing countries than you might imagine. Yes, they are correlated in the US, because with sticky nominal wages, a shock to NGDP will play a causal role in changing RGDP. That’s why it’s so important for the Fed to stabilize NGDP expectations.
Alexander, I don’t follow your question. I don’t assume money demand is a rectangular hyperbola, a DEFINE AD as a rectangular hyperbola.
You said:
Does the following paraphrase sound correct? The Fed’s failure to counteract the ’07 money demand increase in a timely way is what led to the Great Recession.”
Just the opposite. Money demand did not increase, look at the right side graph; the problem was the growth in the money supply stopped, which dramatically slowed growth in NGDP
10. June 2016 at 11:35
Scott,
Please don’t scream. I asked for expectations data because you claimed that “you can explain a lot of the variability of NGDP with fluctuations in expectations of future NGDP.” Now you come clean that you never had the data to substantiate this claim. Thank you.
You have made it your mission to advocate for NGDP targeting, but your comments on this post suggest that you don’t even have a reliable basis to predict the size of the effect from adopting that policy.
14. June 2016 at 06:28
Ray Lopez, i think you are the one who is confused. What Scott’s drawn above is a Money Demand and a Money Supply curve, not a AD/AS curve. A Money Supply curve is vertical as we assume the Central Banks has complete control over setting the Money Supply. Cheers
13. June 2021 at 05:44
[…] something in 2007. As I said above on supply and demand, low rates could result from a shift in the IS curve, but it’s clear that most economists didn’t think so in 2007 because they thought low […]