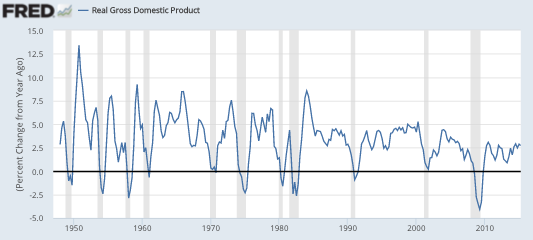
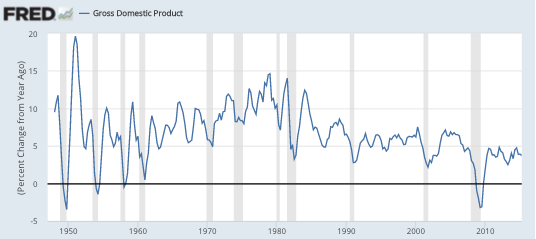
There’s a new Vox article by Lola Gadea, Ana Gomez-Loscos, and Gabriel Pérez-Quirós showing that the Great Moderation that began around 1984 is still intact, despite the Great Recession. This got me thinking about the cause or causes of the Great Moderation. In the end I’ll argue there were two causes, and that the moderation actually occurred in two steps, first in 1961 and then in 1984. Here’s a RGDP growth rate graph that clearly shows a decline in volatility after 1984:
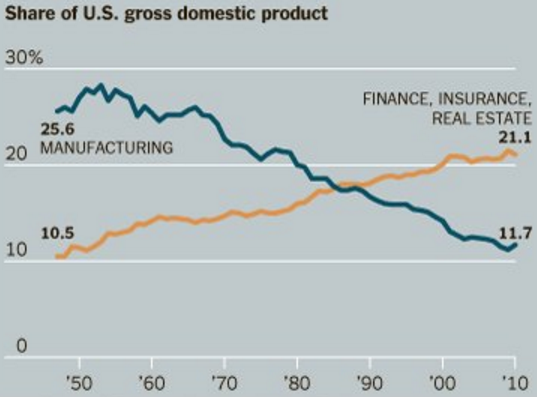
 The first idea that popped into my head was that industrial production is unusually volatile, and has been becoming a smaller share of our economy. When did this start? I don’t have data on IP as a share of the economy, but this graph shows that manufacturing has been shrinking as a share of GDP, and manufacturing is the vast bulk of IP.
 So maybe the Great Moderation simply reflects the shrinking share of this highly cyclical industry. Unfortunately, further research disproved that theory, as even IP has been getting much less volatile over time:
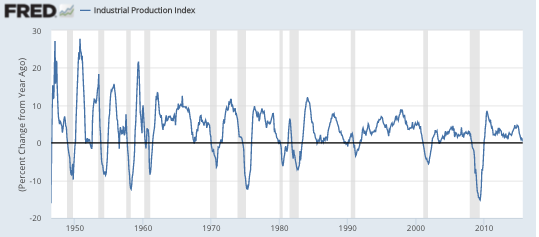 Now you can begin to see why I hypothesized two stages in the Great Moderation. The five business cycles during the Truman/Eisenhower years saw especially volatile IP. Most strikingly, the smallest peak of those 5 cycles (my birth year) is higher than the highest peak since 1960. On the IP graph it looks like the Great Moderation began in 1961, and then got even more moderate after 1984. So that made me wonder why other researchers don’t point to 1961 as the turning point.
Go back to the real GDP graph, and you’ll see why. The moderation in real GDP during the Kennedy through early Reagan years (say 1961-84) is much less pronounced than for IP. Not really statistically significant.
We’ve looked at IP, so what’s left? Most of what’s left is consumption—was that becoming more volatile during 1961-84, offsetting the improvement in IP stability?
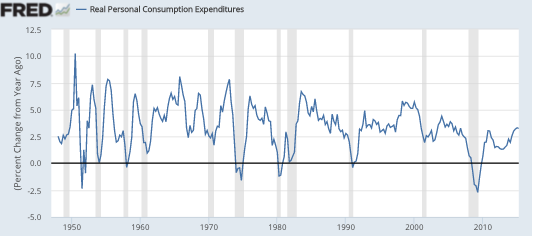 Not as far as I can tell. Indeed if it weren’t for the two severe oil shocks (1974 and 1980) consumption might well have become less volatile after 1961. If those two oil shocks had occurred in the Truman/Eisenhower years, and not during 1961-84, then perhaps the Great Moderation would have been dated from 1961.
But we still have a mystery to explain. The reduced volatility in IP after 1961 is quite clear, whereas consumption is about the same, or perhaps slightly less volatile. So why doesn’t the real GDP graph show more improvement? After all, consumption and IP are most of the economy (and yes I know I’m double counting a bit here, but my question remains.)
One thing that’s left is construction. I could not find a real construction series going back that far, but did find residential investment:
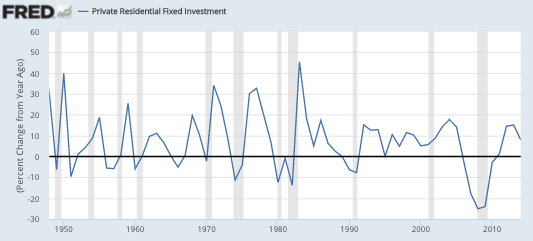 Now we are getting somewhere! Notice that residential investment is actually more volatile during 1966 to 1984 that during the preceding 14 years. Yes, home building is a modest share of GDP, but look at the swings in those growth rates. (I could only find nominal growth, but the swings are so large that they’d also show up in real growth.)
So now we seem to have a partial answer. There was some tendency for the economy to moderate after 1961, but mostly if you exclude homebuilding. If you include homebuilding, then 1984 looks like the year that the Great Moderation began. The question is why?
Here’s the graph you have all been waiting for, monetary policy (er, I mean NGDP growth.)
 NGDP growth volatility clearly fell after 1961, and then moderated further after 1984 (except for 2008-09, obviously.)
So why didn’t RGDP growth moderate as much as NGDP growth, during the 1961-84 period? The easy answer is the two oil shocks. (And I’d add the imposition and removal of price controls in 1971-75.) Yes, that may be part of the story; the oil shocks hit consumption hard. But let’s think about residential investment, which became more volatile during the middle period. Why did that occur when NGDP growth was becoming more stable?
The answer seems clear, NGDP growth from one year to the next was becoming more stable, but the longer-term NGDP growth rate was becoming unanchored, as inflation soared from 1% to 13%. With trend NGDP growth changing significantly, and unexpectedly, long-term nominal interest rates (on T-bonds and fixed rate mortgages) became highly unstable. Yields on 30-year T-bills soared to roughly 15% in 1981.
Because of our peculiar residential mortgage system, these big swings in interest rates whipsawed residential investment, making it highly volatile during the Great Inflation. That’s why the Great Inflation had to end before the Great Moderation could begin. It also implies that if the Great Inflation had been steady inflation/NGDP growth, which was predictable, then the Great Moderation would have begun in 1961, not 1984. (And if my grandmother had wings . . . )
In this story there are two key milestones:
1. In 1961 the Fed figured out how to avoid the stop-go policies of the previous 15 years. But their technique left longer-term inflation/NGDP growth completely unanchored. After 1984 the Fed figured out how to walk and chew gum at the same time, how to keep inflation both low and stable. Ditto for NGDP growth (except 2008-09)
If you look closely at the residential investment graph, you’ll see that homebuilding was more volatile in the 1990-91 recession than in the 2001 recession. That may be because in the first of the two we were still working off the last bit of the Great Inflation. Inflation went into that recession at a 4.5% rate, and came out closer to 2%. In the 2001 recession we entered and left the recession with about the same (2%) inflation rate. Of course there were other factors too, the 2001 recession was focused on business investment, and the resulting fall in interest rates helped homebuilding. In 1990, homebuilding had been overextended by reckless S&L lending. But even with all the craziness in homebuilding in the past few decades, the 1970s were even more unstable.
Obviously the Great Recession is sui generis (first time I’ve used that term), but in the recovery period we are back to eerily steady RGDP growth. The 5 recessions in 15 years that we saw after WWII now seems like ancient history. I can’t even imagine the US having 5 recessions in the next 15 years—although the one thing I’ve learned in macro is that just when you expect something will never return (like zero interest rates) it comes back. So all forecasts are provisional.
PS. IP involves domestic capital goods, domestic consumer goods and exports. The domestic consumer goods portion is double-counted in my analysis. It might have been better to use services rather than consumption—but I doubt my conclusions would have changed.


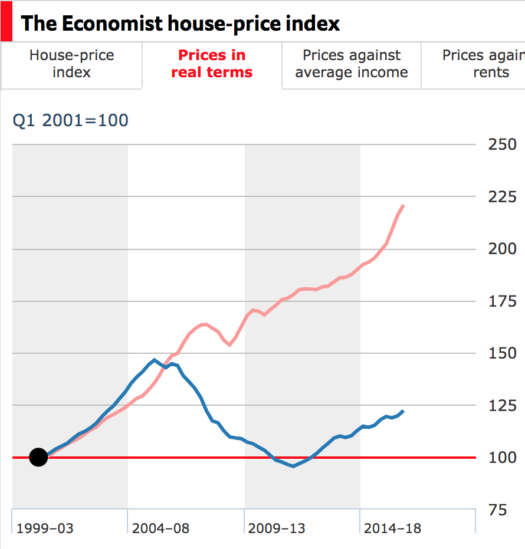
 So let’s see what these pundits say today. Are they calling for investors to engage in “the big short”, as John Paulson did in 2008? Are they predicting another Great Recession? Are they predicting another crash in housing prices? Are they predicting another banking crisis? If not, why not?