

Bleak chic
Janan Ganesh has an piece in the FT entitled “The Rise of Bleak Chic”.
I don’t demand show trials or the ritual egging in public squares of people who were bearish on cities. There is no need for a mea maxima culpa from those who doubted if even the handshake, let alone the restaurant, would return. But let’s imagine that things were reversed: that we optimists were the ones proven wrong. We wouldn’t have been allowed to slink off like Homer Simpson into the hedge. There would have been recriminations.
There is an asymmetry in public life. If you err on the side of optimism, it can dog you forever. Ask Francis Fukuyama. Erring the other way incurs much less cost. Ask . . . well, whom? Who is the reference point for incorrect pessimism? If a name doesn’t occur, it’s because we tend to let these things go.
In the past, I’ve made a similar argument about asset price “bubbles”. Those who wrongly suggest that high prices are the new normal are mercilessly criticized after the crash. People still cite Irving Fisher’s claim that stocks had reached a permanently high plateau in 1929.
[Actually, Fisher’s claim was probably reasonable. Stock valuations were not out of line in 1929, and the crash occurred because of a severe economic depression that almost no one forecast.]
In contrast, asset price bears get off almost scot-free when asset prices soar after inaccurate bearish calls.
After the 2006-09 house price crash, claims were made that housing prices at the peak were obviously excessive. (Kevin Erdmann was a notable exception.) By the late 2010s, that no longer looked to be the case. But even then, people would often single out a few places like Phoenix as being obviously overpriced in 2006. Yes, they argued, high prices in California and New York might be justified by restrictions on new construction, but surely there was no justification for the insanely high prices in Phoenix, which is surrounded by endless expanses of desert. Even I found it hard to explain what had occurred.
Well, if prices in Phoenix were obviously irrational in 2006, they are just as high today. In the graph below I presented the Case-Shiller index deflated by the price level—in nominal terms Phoenix houses are now much more expensive than in 2006.
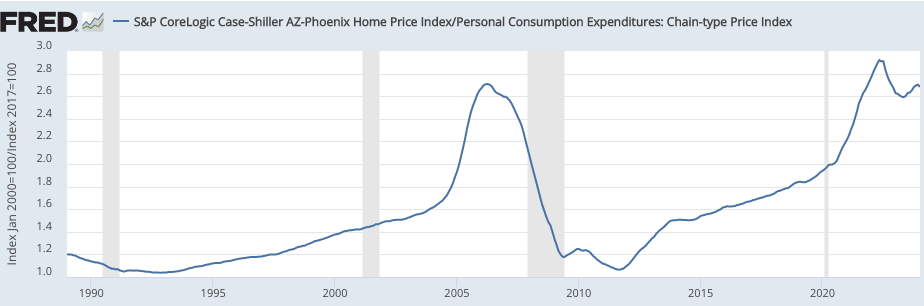
People that assured us that high prices in 2006 were justified are ridiculed, while we ignore those who suggested that the low prices of 2009-13 were justified.
Bleak chic is just one of the many psychological flaws that contribute to belief in bubbles.
Tags:
12. April 2024 at 17:05
So prices rose exactly in-line with inflation over a 17-year period, and you regard that as good? Admittedly it’s not awful, but it is quite poor.
12. April 2024 at 17:08
Cassandra?
12. April 2024 at 20:11
Robert, Isn’t that almost a dictionary definition of average? House prices rose at the same rate as other prices? What’s your point?
Owen, OK, let’s say “in recent millennia”
12. April 2024 at 22:58
People make an awful lot of predictions that are rarely tracked. If you’re a known name, your enemies ensure that your bad calls are never forgotten. If you’re a nobody, you can forever crow about your long shots.
In the end, doing justice to a particular prediction often takes more care, time, and objectivity than most of us are willing to give. That said, anyone who assured us that handshakes and restaurants were never coming back needs his prediction license permanently revoked.
14. April 2024 at 16:35
I have long thought your talk of bubbles arent useful analytical tools is mostly correct.
But in the Phoenix case it seems relevant that it took nearly 20 years to get back to that point. If i extrapolate the 95 to 2005 trend it seems to match where we are now. One can be forgiven for looking at that chart today and saying yep 2006 = bubble even if that process cant reliably be replicated.
15. April 2024 at 08:03
Andrew, I don’t see why the 20-year gap is relevant. The issue is whether or not this sort of real housing price for Phoenix is “rational”. And I say we don’t know.
I put little weight on trend lines in asset price markets. It’s mostly a random walk.
15. April 2024 at 09:11
Housing is an asset, it should rise faster than CPI measured inflation, though not as fast as other assets. CPI+1% is probably about right.
15. April 2024 at 09:19
“it should rise faster than CPI measured inflation”
That may be true of land, but it’s not true of housing, regardless of whether you call it an “asset”. I can call my car an “asset”, it doesn’t make it rise in value. Ditto for diamond rings.
15. April 2024 at 16:28
If the rental rate in AZ was rising over time and indeed expected to rise due to say rising population. Then housing prices woul also rise over time as the pv of those future cash flows rise overtime. It would do so on a more advanced schedule but not all at once. This is why asset prices connected to economic growth generally rise over time and why the 20 year gap is relevant.
I agree that this doesnt mean people can reliably predict the “bubble” in real time. But i do think after the fact the chart is good evidence that 2006 was over valued.
I do however note anecdotally there seem to be more ppl that can consistently over perform on real estate than stocks. So over valuations may in fact be easier for some ppl to spot in that sector.
15. April 2024 at 19:01
A better divisor for your graph would be income, not PCE price index. House prices relative to income matters much more than house prices relative to other goods & services. Kevin Erdmann’s analysis is very helpful for separating markets according to the dynamics that explain why price:income is changing and why that might or might not be expected to continue.
16. April 2024 at 06:44
Ted, It may depend on how housing prices are defined. You might expect the physical price of a given house to rise with the CPI (excluding land), but the average price may rise with income if quality is improving as real GDP rises.
Does Zillow look at prices of a given house?
16. April 2024 at 17:31
Scott -the Case-Shiller HPI is well documented and, as a repeat-sales index, is theoretically quality-constant. Alas, despite my cajoling of each of the major vendors of HPI’s (years ago), none of them have pursued decomposing prices into land (a generally appreciating asset) and structure (a depreciating durable good). Zillow estimates individual home values (one price for the land and the structure combined) based on a variety of inputs and models, and they also construct weighted repeat-sales indices (like Case-Shiller) which are used in their Zestimates. In my work modeling mortgage insurance risk, I found income (per capita worked best for me) to be far and away the best correlate to HPI across geographic areas and time. Kevin’s work is very insightful for helping to explain a phenomenon that puzzled me, which is that in many markets the coefficient on income is greater than 1, i.e. home prices tend to increase faster than incomes.
16. April 2024 at 20:19
Ted, Thanks for that info. I agree that Kevin’s work is excellent.
I suspect that structures are more costly than land in Phoenix (but not here in California.) So in Phoenix I’d expect the price of existing homes to rise only slightly faster than the CPI, unless other factors like zoning restrictions were increasingly binding.
18. April 2024 at 07:10
Scott – In 2006 I can assure you that the rate of increase of home prices in Phoenix was well in excess of CPI and there were no factors like zoning restrictions. You don’t like the term “bubble”, but speculative demand was through the roof and the only restriction was the amount of time it took to build a house. Classic real estate cycle of fast-moving changes in demand and slow-moving changes in supply. Using CPI to adjust construction cost, the change in home prices in 2006 in Phoenix implied a doubling of land value in a year. That in a place where creating a new lot meant raking the sand on the other side of the street to make a flat spot.
18. April 2024 at 11:57
Ted, You said: “That in a place where creating a new lot meant raking the sand”
I used to have that view, but now it seems clear that there are significant restrictions on building in Phoenix.
19. April 2024 at 01:16
Scott,
“Actually, Fisher’s claim was probably reasonable. Stock valuations were not out of line in 1929, and the crash occurred because of a severe economic depression that almost no one forecast..”
which data points do you use for this claim? Looking at the follwing valuation measures 1929 does stick out.
https://www.hussmanfunds.com/comment/mc211108/
wonder what u think of it
19. April 2024 at 01:22
Scott,
not sure your Phoenix real house price graph proves your point.
Not earining anything in real terms for twenty years on your biggest asset (seen as low risk, and probably even pre-capex needs) and in addition to beeing in the hole for the best part of that period is what most people would call a bubble.
An analogy might help:
According to this logic I could also say the Fed didn’t make major mistakes in the 1930 because NGDP eventually surpassed the 1929 peak twenty years later, obviously nonsense!
19. April 2024 at 08:22
Viennacapitalist, That graph shows the 1929 peak to be lower than today. So if was overvalued then, it’s even more overvalued today.
There was an academic study that showed valuations in 1929 were reasonable. I don’t recall the specifics, but I cited it in The Midas Paradox.
“Not earning anything”
What? People live in their houses! That’s a big service flow.
You are confusing physical goods with financial assets. The baseline assumption should be that any given physical good rises in price at roughly the same rate as other goods, unless you have some specific reason to expect otherwise (such as tightening restrictions on building.)
That analogy with NGDP misses the point. I never claimed the market never made a mistake; markets make mistakes (ex post) every single day, often big ones. I said it wasn’t obviously overvalued at the time. And it wasn’t.
20. April 2024 at 10:22
Scott,
yes, ppl live in their houses, but they have to cover depreciation and interest-( the chart does not adjust for that), probably still a terrible deal…
given that demand elasticities of goods are vastly different, I do not see why One should expect uniform price increases across goods. where do u have that theory from?
a house is an asset that can throw offa cash flow, it therefore is similar to a capital good. financial assets are representations of capital goods and hence similar. and many people treat it as such…