

AIT is increasingly credible
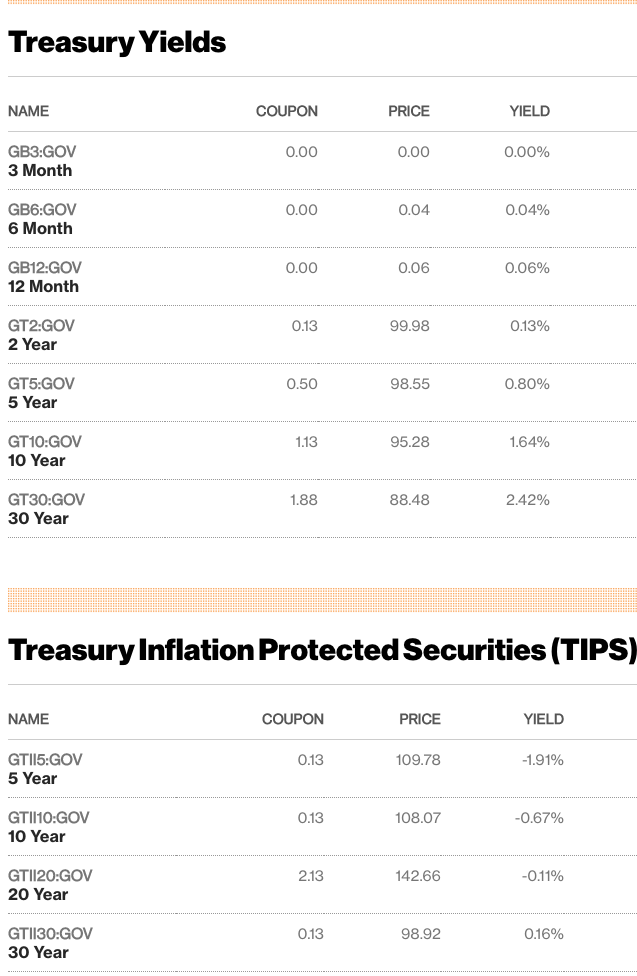
The Fed recently forecast 2.4% PCE inflation for 2021. The TIPS markets are showing evidence that investors expect 2% PCE inflation over 30 years, and somewhat higher inflation over the next 5 years. This is all consistent with the Fed’s 2% AIT framework, as some make-up is required for the 2020 undershoot of 2% inflation. Mostly because of AIT, the economic recovery will likely be much faster than during 2009-19.
Note that TIPS are indexed to the CPI, which runs at least 25 basis points above the PCE that is being targeted at 2%. So TIPS spreads need to be adjusted downwards by at least 25 basis points to get a crude estimate of market PCE inflation forecasts. And finally, TIPS spreads are not a perfect indicator, as there may be a time-varying liquidity premium:
Tags:
17. March 2021 at 16:01
https://youtu.be/2DH4v6FnbvM
Interesting new rules segment from Bill Maher, Scott. It’s not just conservatives now who are afraid of China.
China has become a rich country and is eating our lunch.
17. March 2021 at 17:16
I don´t think “AIT increasingly credible” is true. As a friend recently put to me:
“He (Powell) does not have confidence in Board staff forecasts of inflation based on the Phillips curve. He does have confidence in his ability to control inflation based on the assumption of a flat Phillips curve with an upward sloping section starting at a very low rate of unemployment. Keynesian hubris.
Problem is that AIT, like IT before it, is based on the wrong foundation:
https://marcusnunes.substack.com/p/is-the-new-monetary-policy-framework
18. March 2021 at 02:13
Marcus, AIT can work without any Keynesian underpinings. Can’t it?
So even if the people who introduced AIT might be Keynesians (and also assuming Keynesianism is wrong), that doesn’t have to mean the policy itself must fail.
18. March 2021 at 02:16
Scott, I’ve also been following the TIPS spreads closely over the last year. I’m quite impressed by how well the market took to AIT.
Btw, do you have an opinion on targeting NGDP vs targeting the integral of NGDP (ie total accumulated spending)?
18. March 2021 at 04:43
As the Calafia Beach Pundit said:
https://scottgrannis.blogspot.com/2021/03/the-covid-winter-is-over.html
Chart #3 is one of my perennial favorites, since it shows the Fed has been responsible for almost every recession in the past 60+ years (the notable exception being the brief Covid crackdown recession that started a year ago). Recessions (gray bars) have occurred after every major spike in the real Fed funds rate (blue line) and every major flattening or inversion of the yield curve (red line). The purpose of Fed tightening has always been to increase real interest rates (and effective borrowing costs) in order to break the back of rising inflation. (Higher real interest rates work to increase the demand for money thus reducing the amount of excess money in the system at the same time the Fed is withdrawing reserves and shrinking the supply of money.) A significant tightening of monetary policy also causes the yield curve to flatten and to eventually invert (when long-term rates fall below the level of short-term rates). An inverted yield curve almost always means that monetary policy is so tight the economy begins to suffer and the market realizes that the Fed will soon have to reverse course.”
18. March 2021 at 05:02
re: “Mostly because of AIT, the economic recovery will likely be much faster than during 2009-19.”
When Bankrupt-u-Bernanke introduced the payment of interest on interbank demand deposits, he destroyed nonbank lending. Bernanke’s artificial inversion of the short-term segment of retail and wholesale money market funding yield curve, induced nonbank disintermediation (where the size of the nonbanks shrank by $6.2 trillion, while the banks were unaffected, increasing by $3.6 trillion. I.e., the FED chair destroyed velocity (or the savings->investment process).
Why the difference? “Pushing on a string” should have only applied prior to the nominal legal adherence to the fallacious “Real Bills Doctrine” which was terminated in 1932 – due to a paucity of eligible (hopelessly impaired), commercial and agricultural paper for the 12 District Reserve bank’s discounting purposes).
Disintermediation for the DFIs can only exist in a situation in which there is both a massive loss of faith in the credit of the banks & an inability on the part of the Federal Reserve to prevent bank credit contraction, as a consequence of its depositor’s withdrawals.
Ever since 1933, the Federal Reserve has had the capacity to take unified action, through its “open market power”, to prevent any outflow of currency from the banking system (i.e., before the remuneration of IBDDs emasculated this power).
In contradistinction to the NBFIs, dis-intermediation for the DFIs isn’t predicated on the prevailing level of market clearing interest rates or the administration of policy rates. The DFIs could continue to lend even if the non-bank public ceased to save altogether. The lending capacity of the DFIs is dependent upon monetary policy, not the savings practices of the public.
18. March 2021 at 07:57
Scott,
This strikes me as very good news. I have no doubt that AIT will be a vastly superior framework, even if it is not the optimal. I think we are about to see improvement in the quality of life for millions of Americans. Very exciting.
18. March 2021 at 07:59
AIT is increasingly credible?
Are nominal variables rising faster than real variables? There is a “sweet spot” where an injection of new money is temporarily robust.
18. March 2021 at 09:06
Reposting my comment from an earlier thread. Curious what you think of this? Link: https://www.ft.com/content/c8959502-7dae-43b1-b993-3bf85fb4325a
If can’t access, key quote: “Today, a new scourge — asset price inflation — looms. And New Zealand has launched another counterattack. While consumer prices have been held in check by globalisation and automation, easy money pouring out of central banks has been driving up the price of assets from stocks to bonds and housing. As homes are generally not counted as consumer goods, even sharp price spikes carry relatively little weight in central bank deliberations.”
Are asset prices rising because of central bank money “printing”, or just due to lower natural rates of interest? And if the former, can they effectively combat the excess increases with monetary policy? Should they?
18. March 2021 at 11:28
Jason, You said:
“China has become a rich country and is eating our lunch.”
Actually, they are manufacturing “lunch” and we are eating it. Enjoy!
Matthias, I’d prefer to target the level of NGDP.
Trying, Asset prices are not climbing because of central bank policy, as central banks don’t determine the long run real interest rate.
18. March 2021 at 16:51
Scott, could you elaborate on your response to Trying? I hear this all the time and while I don’t like the term “asset price inflation” the idea that looser monetary policy would lead to higher asset prices makes intuitive sense to me. Would love to understand this better.
18. March 2021 at 18:27
Scott,
Kind of off topic but I thought you might find this amusing:
https://twitter.com/karenfinerman/status/1372558685990490112?s=20
18. March 2021 at 19:43
Can Sar, To be clear, monetary stimulus can boost both nominal and relative asset prices in the short run, and nominal asset prices in the long run. But what matters is the long run relative price of assets, and that’s not something that monetary policy can affect.
Regarding the short run, if the monetary stimulus is not boosting NGDP substantially, then it’s not actually an expansionary policy stance. In that case, any rise in asset prices is being caused by something other than “easy money”.
Don’t equate low interest rates with an expansionary monetary policy
18. March 2021 at 19:44
Garrett, Cute.
18. March 2021 at 20:31
To the degree this post is correct, the new framework is insufficient, but then we all knew that. The Fed’s doing a better than it used to, but that’s not nearly good enough.
For weeks now, the S&P 500 futures curve has been negative going out to December, at least.
Larry Summers has been correct. Much of the money in the recent Covid relief bills has been misspent, and there’s overspending overall, leading the Fed to threaten to overreact.
18. March 2021 at 20:32
Or, I should say the markets feel threatened that the Fed will overreact, even though the Fed’s made no threats.
19. March 2021 at 07:00
re: “the new framework is insufficient”
First, the FOMC targets are wrong. The FOMC’s monetary policy objectives should be formulated in terms of desired rates-of-change, roc’s, in monetary flows, volume times transaction’s velocity, relative to roc’s in the real-output of final goods and services -> R-gDp.
Roc’s in N-gDp, or nominal P*Y, can serve as a proxy figure for roc’s in all physical transactions P*T in American Yale Professor Irving Fisher’s truistic: “equation of exchange”. Roc’s in R-gDp have to be used, of course, as a policy standard, as the policy anchor.
And if R-gDp is to fill the output gap (or even a higher N-gDp target), then the banks must be driven out of the savings’ business (reversing both savings’ velocity since 1961, and bank debits to deposit accounts or transactions’ velocity since 1981). I.e., from an accounting perspective (double-entry book-keeping on a national scale), all bank-held deposits are temporarily frozen, lost to both consumption and investment.
The output gap is predetermined by a rate of change in short-term monetary flows that substantially exceeds the rate of change in long-term monetary flows.
It is a macro-economic accounting truism that banks don’t loan out deposits. The only way to truly activate those deposits is for their owners, saver-holders, to invest outside of the payments’ system or otherwise spend directly or indirectly. Whereas an increase in bank CDs (commercial bank deposits shifted to savings’ deposits), adds nothing to GDP.
19. March 2021 at 07:54
Michael, It seems to me that the markets do NOT fear overreaction, at least based on TIPS spreads.
19. March 2021 at 08:55
Scott,
What do you think is behind tech stocks selling when inflation expectations goes up?
19. March 2021 at 09:25
For what its worth – 10yr 4% zero coupon inflation caps have caught a significant bid. They are now worth 80c rather than the 10c they were in 2018, the floors are now worth 5c rather than 10c – at the time then 10yr swaps were around 2.40, as they are today.
Note these options are on the cumulative CPI index change rather than several annual observations, so they reflect views on the persistent realised trend rather than higher annual variance.
This is implying that the market is assigning some reasonable probability to a significant and persistent overshoot.
19. March 2021 at 09:53
Scott,
I see the 5-year forward inflation expectations, which reflect TIPS, which are down since early February:
https://fred.stlouisfed.org/graph/?g=CaMb
I see Treasury yields spiking, and when I do, I usually see a big sell-off in the NASDAQ, and often also in the S&P 500. The dollar index rises, and gold typically falls on those days.
The dollar index has been rising since the first half of last month:
https://fred.stlouisfed.org/graph/?g=CaOB
The S&P 500’s been mostly flat, while the NASDAQ’s taken a beating:
https://fred.stlouisfed.org/graph/?g=CaOF
https://fred.stlouisfed.org/graph/?g=CaON
The S&P 500 futures curve is negative for the remainder of the year:
https://www.cmegroup.com/trading/equity-index/us-index/sandp-500.html
And, of course, nominal Treasury yields beyond 2 years have been rising:
https://www.treasury.gov/resource-center/data-chart-center/interest-rates/pages/textview.aspx?data=yield
At least from my perspective, the weight of the evidence seems to suggest tightening money, and that we keep hitting what the market thinks is the Fed’s tipping point for raising rates.
19. March 2021 at 11:44
Aleksandar, I don’t know. I’d expect more of a relationship with the real interest rate. Of course if inflation gets seriously high then it hurts almost all stocks (as in the 1970s).
Olek, Thanks. It makes sense that the risk of high inflation has risen slightly. Is there an implied probability?
Michael, I don’t think stocks or interest rates are a very reliable indicator of monetary tightening, unless the stock market move is very large.
19. March 2021 at 16:48
Scott, thank you, that was crystal clear. The second part I already knew but the first I hadn’t properly conceptualized.
20. March 2021 at 07:28
Let’s hope that AIT gives us a few decades of monetary policy boredom. Maybe our next recession will be a few months of a 1% rise in the unemployment rate. Maybe 10 year bank CD’s will pay 2% rates. Maybe a 30 year mortgage note will be at 5%.
Some people who are smart and/or lucky will continue to make money at the margins because of asset price volatility. That’s a good thing, but it shouldn’t be driven by drama at the Fed.
Scott can spend more time watching movies and TV–do give Breaking Bad another try. Just fast forward through boring scenes.
20. March 2021 at 07:33
re: “the weight of the evidence seems to suggest tightening money”
That’s exactly what the curve from money flows are telling us. Oil is following the rate of change in M*Vt. That’s why there’s a “sweet spot”. But that should prove to be temporary.
Contrary to Nobel Prize–winning economist Milton Friedman and Anna J. Schwartz’s “ A Monetary History of the United States, 1867–1960 “ monetary lags are not “long and variable”. The distributed lag effects for both real output and inflation have been mathematical constants for over 100 years. Thus, we can precisely calculate any “output gap”, any “sweet spot”.
“The Making of Index Numbers (1922) is to identify the characteristics of the best feasible index of prices for use in measuring changes in the purchasing power of money. This book, in which he tried to systematize and rationalize index number theory by defining a certain number of criteria, is in fact an extension of chapter 10 of his Purchasing Power of Money and of the appendix to that book. His research into the qualities of a satisfactory price index was a by-product of his general analysis of the equation of exchange.”
“Whereas Fisher’s approach in The Purchasing Power of Money was deductive, in The Making of Index Numbers it was inductive and empirical: he compared the results of using different formulas on the same historical data. He used two principal criteria of evaluation, the “time reversal test” and the “factor reversal test,” and recommended use of the “ideal” index, the geometric mean of the Paasche and Laspeyre indices.”
“There can be no doubt that Fisher’s study, which was the most extensive at that time in the field of index numbers, was a fruitful springboard for much of the progress made subsequently [See INDEX NUMBERS].”
“Distributed lags. Fisher was the first to envisage a systematic dependence of the present on the past in economics, and thus he opened up a whole new area. The existence of systematic effects explains why it has been possible successfully to analyze economic and geophysical time series using autoregressive equations which when inverted can be written formally as in which y-t is the cumulative effect of earlier actions, εt-p, weighted by coefficients a-p, which decline with distance in time.”
“The accepted English term for this formulation, “distributed lags,” was coined by Fisher. This term is intended to convey that each εt-p acts with a certain delay, so that lags of different length must be taken into account when studying the influence of the past.”
“In his study “Our Unstable Dollar and the So-called Business Cycle” (1925) Fisher proposed a formulation of the type in which the weights α(θ) are distributed lognormally, for study of the interdependence of the level of economic activity y(t) and past values p(t—0) of the general level of prices.”
“Later, in his Theory of Interest (chapter 19, sec. 6), he used weights a, which declined linearly with time, to study the relationship between the rate of interest and earlier rates of increase of the price level.”
“The line of approach initiated by Fisher was later to prove particularly fertile in econometric thought. [See DISTRIBUTED LAGS .]”
http://www.encyclopedia.com/...
Irving Fisher: Pioneer on distributed lags – by J.N.M. Wit
“Fisher’s theory was that any cause produces a supposed effect only after some lag in time, and that this effect is not felt all at once, but is distributed over a number of points in time. He hypothesized that the best general form for the lag distribution is presumably the lognormal distribution. In essence, this distribution satisfies his idea that the effect will quickly reach its peak after a very short period, and then slowly taper off.”
“To find this estimate, Fisher provided a heuristic approach in case one already knows the lag length that makes the correlation between the lagged xt and yt at its maximum. A good guess for the value of n* would be three to four times the numerical value of the aforementioned lag length.”
“Fisher’s ‘Note on a Short-Cut Method for Calculating Distributed Lags’ in the Bulletin de l’Institute International de Statistique. Fisher’s contribution unintentionally provided the first parsimonious device that is able to solve the multicollinearity problem.”
web.uvic.ca/…
Econometrics Beat: Dave Giles’ Blog
Irving Fisher & Distributed Lags (1925)
“At the bottom of p. 183, he claims that “So far as I know this is the first attempt to distribute a statistical lag” and then goes on to explain his approach to the question. Among other things, I’m still struck by the fact that Fisher’s “computer” consisted of his intellect and a pencil and paper.”
“We note at once that P’ supplies an oscillating barometer without requiring any of the corrections for secular trend and seasonal variation found necessary in most “ cycle “ data including the “ T “ here used:”
davegiles.blogspot.com/…
20. March 2021 at 08:14
It appears the markets are trusting Powell’s intent on AIT, as inflation forecasts above 2 is not having a negative effect. Yes on short term price fluctuations of TIPs due to relative “illiquidity”——makes them a reasonable trading instrument. Investors need to be reminded when they buy a TIP and hold to maturity they are locking in the real return as it presented itself on the date of purchase.
I know you like NGDP targeting as it is more specific——-but you have made recent comments that inflation AIT targeting can be just as effective (I believe you have) hence I am happy with Powell.
The WSJ referred to him negatively as an MMT believer. These same people still like Phillips curve. Although I did like Greg Ip’s most recent essay.
I have mentioned this before, but the financial press appears to not even understand what monetary policy is or even means.
I follow you because you have been more right——-but even though your underlying framework is very complex (to me) it’s conclusions seem very simple—-and it makes one want to resist.
But Einstein once wrote theories need to be as complex as they need to be, but not more complex. That sounds simplistic, but in the practice of science it is not.
20. March 2021 at 15:16
Scott,
Do you have an opinion you haven’t shared on what’s slowing down stocks and intermittently roiling the stock market?
20. March 2021 at 19:05
David, Yes, I’m hoping for boredom.
M. Rulle, AIT is not quite as good as NGDPLT, but it’s a big improvement. And Powell is certainly not an MMTer!
M. Sandifer, In my view stocks have been doing very well, so there is nothing to explain.
21. March 2021 at 02:20
Powell is an economic ignoramus?
Chair Jerome Powell says:
“ . . . it interferes with the
03:19 process of credit intermediation that
03:22 banks undergo they take in deposits they
03:24 lend it out “
https://www.youtube.com/watch?v=mtixgCEEt_4
21. March 2021 at 04:16
Scott,
During the latest market turbulence since last month, the NASDAQ 100 was down more than 11% at one point. That’s not a big enough move to be concerning?
I judge it more by the implied change in the GDP growth path, versus secondary effects of low interest rates on safe assets. The NASDAQ 100 is dominated by companies such as Apple, Alphabet, etc., which typically have hundreds of billions of dollars on their balance sheets, obviously representing extremely remote insolvency risk.
21. March 2021 at 06:13
@postkey
That of course is the stupendous error. Never are the DFIs intermediaries in the savings->investment process. The DFIs are credit creators. The NBFIs are credit transmitters.
The accounting ramifications are prodigious (esp. with an artificially inverted yield curve). The prosperity of the DFIs is dependent upon the prosperity of the NBFIs.
21. March 2021 at 06:25
re: “I judge it more by the implied change in the GDP growth path”
On point. The rate-of-change in short-term monetary flows, volume times transactions’ velocity, the proxy for real output for the last 100 + years:
05/1/2020 ,,,,, 0.54 0.47
06/1/2020 ,,,,, 0.61 0.53
07/1/2020 ,,,,, 0.65 0.55
08/1/2020 ,,,,, 0.68 0.56
09/1/2020 ,,,,, 0.68 0.52
10/1/2020 ,,,,, 0.76 0.60
11/1/2020 ,,,,, 0.87 0.82
12/1/2020 ,,,,, 1.26 0.89 R-gDp peaks
01/1/2021 ,,,,, 1.31 0.56
02/1/2021 ,,,,, 1.27 0.50
03/1/2021 ,,,,, 1.21 0.43
04/1/2021 ,,,,, 1.25 0.39
Jan 22, 2021. 07:52 AMLink forecast
21. March 2021 at 06:28
But the economy, N-gDp peaked a little later:
parse; date – rate-of-change in inflation
01/1/2020 ,,,,, 0.12
02/1/2020 ,,,,, 0.04
03/1/2020 ,,,,, 0.19
04/1/2020 ,,,,, 0.47
05/1/2020 ,,,,, 0.54
06/1/2020 ,,,,, 0.61
07/1/2020 ,,,,, 0.65
08/1/2020 ,,,,, 0.67
09/1/2020 ,,,,, 0.67
10/1/2020 ,,,,, 0.75
11/1/2020 ,,,,, 1.16
12/1/2020 ,,,,, 1.24
01/1/2021 ,,,,, 1.45 plateau
02/1/2021 ,,,,, 1.41
03/1/2021 ,,,,, 1.35
04/1/2021 ,,,,, 1.39
05/1/2021 ,,,,, 1.35
06/1/2021 ,,,,, 1.32
07/1/2021 ,,,,, 1.34 probable peak after 1.9T stimulus
08/1/2021 ,,,,, 1.32
Feb 18, 2021. 11:19 AMLink forecast
21. March 2021 at 06:38
The drop in the ROC in R-gDp, from 89 to 39, permits the FED to re-establish the ceiling in the output gap (all without an excessive expansion in long-term monetary flows). I.e., the $1.9 trillion Covid-19 stimulus package will increase real variables relative to nominal variables.
21. March 2021 at 06:46
re: “AIT is not quite as good as NGDPLT”
That’s exactly what the recent data precisely proves.
21. March 2021 at 07:22
“Neutrality of money is the idea that a change in the stock of money affects only nominal variables in the economy such as prices, wages, and exchange rates, with no effect on real variables, like employment, real GDP, and real consumption.”
There is a “sweet spot”, a window of time where money is robust – not neutral, not harmful. Milton Friedman agreed with this.
If there is a short-run robustness, there isn’t, paradoxically, necessarily a long-run robustness.
Bankrupt-u-Bernanke “In particular, as Friedman told us, a monetary expansion has its more immediate effects on real variables such as output, consumption, and investment, with the bulk of these effects occurring over two to three quarters.”
Bankrupt-u-Bernanke “The proposition that money has no real effects in the long run, referred to as the principle of long-run neutrality, is universally accepted today by monetary economists.”
Bankrupt-u-Bernanke “The idea that monetary policy had long-run effects–or, in technical language, that the Phillips curve relationship between inflation and unemployment could be exploited in the long run–proved not only wrong but quite harmful.”
Remarks by Governor Ben S. Bernanke At the Federal Reserve Bank of Dallas Conference on the Legacy of Milton and Rose Friedman’s Free to Choose, Dallas, Texas –October 24, 2003
https://www.bis.org/review/r031031g.pdf
Bankrupt-u-Bernanke cited Nobel Laureate Dr. Milton Friedman’s “lecture, “The Counter-Revolution in Monetary Theory.” Friedman’s “11 propositions”
21. March 2021 at 08:21
I want to believe in 2.5% 5-year Breakeven TIPS spreads. I just don’t see the relevant parties getting over their conditioned fear of inflation statistics.
You can explain NGDPLT or AIT/PCE-LT all day to these (often extremely smart) people, and it will be akin to arguing that crops shouldn’t be watered with Brawndo, it’s got what plants crave, after all.
The AIT faction will have to run a withering gauntlet of criticism this summer and fall, as the various inflation measures break the magical 2.0% threshold in annualized and YoY terms. Do the ruling class understand the matter well enough to give the FOMC support? Maybe some of the oligarchs, but few in the de facto state apparatus, I suspect.
Anyway, the market thinks it will happen, and it’s a subject with tradeable implications. No need to argue, we’ll find out the answer soon enough.
21. March 2021 at 13:58
[…] all, at least if you take the Fed’s 2% average inflation target seriously. At the moment, markets expect a modest overshoot of inflation over the next 5 years, to make up for the undershoot during 2020. […]
21. March 2021 at 16:00
Scott,
I also point out that the VIX is still well-above it’s pre-Covid recession level, and if you look at stock index data, such as that for the S&P 500, you see the pattern of the index not returning to trend paths after recent economic slowdowns and the recession.
https://fred.stlouisfed.org/graph/?g=CeGQ
https://fred.stlouisfed.org/graph/?g=CeGY
These are pretty good indications to me that markets don’t expect to catch up recent previous NGDP growth trends.
21. March 2021 at 21:30
Michael, No, a 11% drop in Nasdaq does not concern me. That index has always been very volatile
22. March 2021 at 01:51
Scott,
Are you grading the Fed within the context of merely being expected to hit its average inflation target, or are you saying that they’re actually doing a good job of keeping NGDP growth expectations on trend? Or, would you go even further and say they’re doing a good job at catching up to the pre-crisis trend? And what about the pre-trade war growth trend?
22. March 2021 at 07:26
Michael, Most forecasts show a very strong recovery this year, so I see no sign that policy is far off course from a NGDPLT perspective.
22. March 2021 at 09:15
Scott,
Am I correct to think you’re not referring to market forecasts predicting a very strong recovery this year? You’re referring to the use of forecast models? Monetary policy would have to be the tightest since the Great Depression to prevent a big bounce back this year, given that most of the problem is real and the real factors are expected to be greatly ameliorated in the coming months.
But, what does that have to do with the long-run path of NGDP growth, other than perhaps you think that the recovery this year will be so strong that it reflects NGDP growth returning to trend? If so, why aren’t markets predicting that?
22. March 2021 at 21:11
Michael, I don’t know exactly what markets are predicting, but AFAIK, it a pretty healthy recovery. Right now, I see no reason to worry, perhaps in 6 months I’ll change my mind.
23. March 2021 at 06:08
I make these observations:
1. AIT is expected to create shortfalls in the growth path of NGDP, in response to real shocks, versus say, NGDP level targeting. Though, this is an improvement over simple IT.
2. The growth path of the S&P 500 primarily reflects the expected long-run NGDP growth path. That trend has shifted down twice in the most recent few years. Once was due to the relatively tight money in response to the trade war, and the other in response to the pandemic. The S&P 500 is not even close to having returned to it’s pre-pandemic growth path, and S&P 500 futures predict the S&P 500 will actually decline some through the end of this year.
3. With NGDP level targeting, the S&P 500 earnings yield, and earnings would be much more stable over time, meaning it would grow at the discount rate, on average. The fact that we get all this crazy bouncing around is a symptom of monetary disequilibrium.
4. Other market data I’ve mentioned above is consistent with my view that money is currently tight and there are concerns about it getting tighter, though those concerns have eased somewhat over the prior two weeks, due to a small, positive real shock.
23. March 2021 at 07:15
Spencer Bradley Hall,
I just noticed your comments. Interesting. Obviously I’m trying to nail down market-based metrics for determining the stance of monetary policy, and think I’ve made a lot of progress. Some economists are starting to agree, but it’s hard to close a case like this.
23. March 2021 at 09:49
Breakevens show longer-term compression and flattening. That is evidence of past tight money policy.
https://libertystreeteconomics.newyorkfed.org/2021/03/the-persistent-compression-of-the-breakeven-inflation-curve.html
23. March 2021 at 12:32
Over longer periods, the U.S. $ indices reflect ease or tightness.
As an example, the price of oil troughed in Jan 2016 as long-term money flows fell by 80 percent from 1/2013 to 1/2016. Oil fell by 70 percent during the same period. The Trade Weighted U.S. Dollar Index: Broad, Goods and Services rose from 1/2/13 to 1/4/16 from 90.6941 to 114.1596.
27. March 2021 at 10:20
Michael, S&P500 is at an all time high, and well above the trend line. Not sure what you are talking about.
27. March 2021 at 14:41
Scott,
I apologize, becaues my eyes deceived me. Now, having actually calculated the trends, the current one is ahead of the previous one.
I thought I’d gotten out of the habit of trusting my eyes so much, but old habits die hard in this case. So, the S&P 500 is not only saying the Fed is doing better than with previous downturns, but that money isn’t tight now, compared to just before the crisis.
27. March 2021 at 14:42
And honestly, if you knew how bad my eyes were, you’d realize how much worse this actually is than one might assume.
27. March 2021 at 15:15
Lastly, it’s a measure of my confirmation bias that I didn’t notice the obvious fact that, given that the S&P 500 exceeded it’s pre-crisis high roughly midway between the low and and now, that, given the average rate of increase, it’d have to be near or above trend at this point.