Archive for October 2016


Now the fun starts

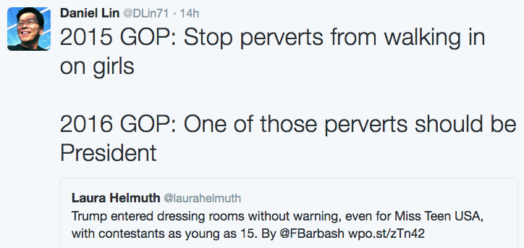
I don’t know how to do twitter, but apparently it’s ablaze with gallows humor.  Here’s one example:

screen-shot-2016-10-13-at-12-31-01-am

That’s from Daniel Lin, and there’s lots more good stuff.  I’ll try to do something more serious when I get caught up from my trip.  As usual, my Econlog posts are more respectable.

Matt O’Brien also has some great stuff, including a retweet of Rush wondering why the left makes such a big deal of “consent”.

We are currently in the circular firing squad phase.  I eagerly await the “Hitler was so pissed the generals let him down that he decided to destroy Germany when he knew that he was going to lose” phase.

The Tar Heel State

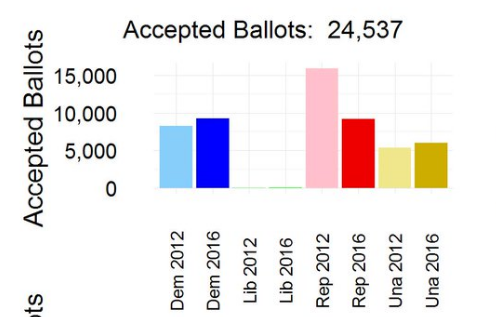
North Carolina is pretty close to a must win state for Trump.  Romney won the state in 2012, despite losing the election by 4%.  It has 15 electoral votes, and Clinton could win even without North Carolina, if she holds New Hampshire, Virginia, Colorado, Pennsylvania, and the upper Great Lakes—all areas where she is well ahead. And she currently leads in North Carolina polls, albeit by a small margin. Here is the early voting as of today, compared to the same date in 2012:

screen-shot-2016-10-09-at-2-31-10-pm

However, I also noticed this information about a change in NC election law, which occurred after the 2012 election:

In August 2013, North Carolina enacted the worst voter suppression law in the country. Among other provisions, this “monster” law (H.B. 589) shortens the early voting period by a full week, eliminates same-day registration, requires strict forms of voter ID, prevents out-of-precinct ballots from being counted, expands the ability to challenge voters at the polls, and ends a successful pre-registration program for 16- and 17-year olds. Each of these provisions has a disproportionate impact on North Carolina’s African-American and Latino voters. Here are stories of some of the plaintiffs and witnesses in our lawsuit, brought on behalf of the North Carolina NAACP, challenging H.B. 589. These individuals know all too well this law’s harmful impact on North Carolina’s voters of color.

So that one week delay may explain the fall in early voting, although of course not the uneven way that it is falling.  I suspect the Clinton campaign is better at GOTV.

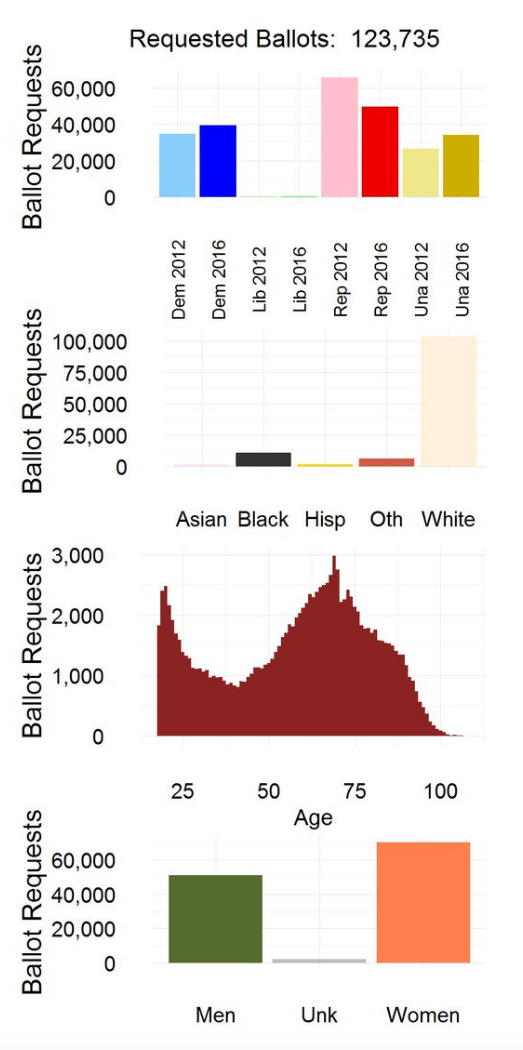
If I am right, you’d expect to see a much smaller drop in the applications for voting ballots, and that’s what we see:

screen-shot-2016-10-09-at-2-35-18-pm

Early voters skew strong white and old (favoring Trump) and also female (favoring Hillary.)  Requested ballots are 5 times as numerous as accepted ballots.

By election day, 60% of North Carolina voters will have already voted. That means that the outcome of the election depends not just on where the polls are on election day, but also the path of polls over the intervening period.  Time to review my calculus book on how to do integration.

Generally I view these snippets of information as somewhat unreliable (recall Dixville Notch?), and this is no exception.  It doesn’t address the issue of whether Trump can draw significant votes from independents and Dems.   But with all the discussion of “Brexit”-like black swans in the polling, it’s worth looking at the first hard evidence that we have.

HT:  Megan McArdle

PS.  Nationwide, 410,000 have voted as of yesterday.

Why it’s difficult to draw market implications from election shocks

There’s been some recent discussion of how the changing fortunes of the Trump campaign might or might not be impacting the markets.  One point I have not seen people address is that these shocks also impact the likelihood of the GOP retaining control of Congress:

Before Friday’s revelations, online bookies had installed Democrats as a 58 percent  favorite to win Senate control. Those odds quickly rose to 69 percent on a site called PredictIt.  If the Democrats win the presidency –now even more likely than before—they only need 50 seats (not 51) to control the Senate: Vice President Tim Kaine would control the tie vote. The markets are now saying that is more than a two-thirds probability.

If the Democrats take the Senate, it’s likely that we will see higher taxes and more regulation than otherwise.  It’s quite possible that the negative impact of that outcome on market sentiment largely offsets any positive effects of Trump losing.  Notice that the 11 point jump in the chance of a Democratic Senate is actually larger than the fall in the odds of Trump being elected.

Keep in mind that in past Congressional election fiascos, the cause of the trouble was not so much people switching their votes to the other party, as demoralized supporters simply staying home.  So even if GOP voters do discriminate between Trump and the Senate races, the GOP could be hurt by even a slightly lower turnout of its voters. The race for the Senate is very close.

A tale of two states

California has a delightful climate and beautiful scenery.  As a result, rich people like me want to live there, despite its poor governance.  But for the working class, it’s an entirely different story.  Here’s an interesting piece on the Latinos in Texas by Joel Kotkin and Wendall Cox:

Much of this rapid demographic shift stems from, again, Texas’s opportunity urbanism. Though many of the newcomers—along with “Tejanos,” native Texas Latinos—are poor and often not well educated, they’re much better off economically than their counterparts in New York, Los Angeles, or Miami. Texas’s vibrant industrial and construction sectors, in particular, have provided abundant jobs for Latinos. In 2015, unemployment among Texas’s Hispanic population reached just 4.9 percent, the lowest for Latinos in the country—California’s rate tops 7 percent—and below the national average of 5.3 percent.

Texas Latinos show an entrepreneurial streak. In a recent survey of the 150 best cities for Latino business owners, Texas accounted for 17 of the top 50 locations; Boston, New York, L.A., and San Francisco were all in the bottom third of the ranking. In a census measurement, San Antonio and Houston boasted far larger shares of Latino-owned firms than did heavily Hispanic L.A.

In Texas, Hispanics are becoming homeowners, a traditional means of entering the middle class. In New York, barely a quarter of Latino households own their own homes, while in Los Angeles, 38 percent do. In Houston, by contrast, 52 percent of Hispanic households own homes, and in San Antonio, it’s 57 percent—matching the Latino homeownership rate for Texas as a whole. That’s well above the 46 percent national rate for Hispanics—and above the rate for all California households. (The same encouraging pattern exists for Texas’s African-Americans.)

California and Texas, the nation’s most populous states, are often compared. Both have large Latino populations, for instance, but make no mistake: Texas’s, especially in large urban areas, is doing much better, and not just economically. Texas public schools could certainly be improved, but according to the 2015 National Assessment of Educational Progress—a high-quality assessment—Texas fourth- and eighth-graders scored equal to or better than California kids, including Hispanics, in math and reading. In Texas, the educational gap between Hispanics and white non-Hispanics was equal to or lower than it was in California in all cases.

Though California, with 12 percent of the American population, has more than 35 percent of the nation’s Temporary Assistance for Needy Families welfare caseload—with Latinos constituting nearly half the adult rolls in the state—Texas, with under 9 percent of the country’s population, has less than 1 percent of the national welfare caseload. Further, according to the 2014 American Community Survey, Texas Hispanics had a significantly lower rate of out-of-wedlock births and a higher marriage rate than California Hispanics.

In California, Latino politics increasingly revolves around ethnic identity and lobbying for government subsidies and benefits. In Texas, the goal is upward mobility through work. “There is more of an accommodationist spirit here,” says Rodrigo Saenz, an expert on Latino demographics and politics at the University of Texas at San Antonio, where the student body is 50 percent Hispanic. It’s obvious which model best encourages economic opportunity.

So California takes in millions of Hispanic immigrants and gives them welfare. Texas takes in millions of Hispanic immigrants and gives them jobs.  (Fun fact, both California and Texas are exactly 37.6% Hispanic–only New Mexico is higher.)

Critics of the Texas model made three points.  First it was propped up by the oil industry.  That might once have been true, but is no longer the case. Indeed Texas continues to draw in migrants from all over the country, despite the oil bust. Second, that it is simply a “sunbelt” story.  That’s false, the good Sunbelt climate is in the southeast and southwest.  The other (hot and humid) south central states do not show the fast population growth that we see in Texas.

The third argument is that some of the social indicators are not so hot.  But people who look more closely at the data generally find that various educational and income statistics in Texas are quite good, if you control for ethnicity and cost of living.  (Non-Hispanic whites in Texas are a minority, a much lower share of the population than in most other states, which explains why average incomes in Texas are not all that high.  But adjusted for cost of living, they are above lots of other states that have lower percentages of blacks and Hispanics.  That’s pretty impressive.)

So I encourage people to move to Texas, if you can’t afford California.

PS.  And yes, zoning reforms in California would really help.

Lots of Americans are bad people

This caught my eye:

An even sharper partisan dynamic exists when voters were asked whether the video gives them a more or less favorable impression of Trump. Among all voters, 61 percent say it makes them feel either somewhat or much less favorable toward Trump, while 28 percent say it doesn’t affect their view of Trump; 8 percent said it makes them feel more favorably toward Trump.

Eight percent of the adult population is about 20 million people.  The figure may be higher if you assume that non-voters are even more degenerate (on average, excluding Bryan Caplan) than voters.  I.e., what would the poll numbers be if they surveyed the 2 million American non-voters in prison!  Or the far larger number that have been released from prison.  I’m going with 25 million as an overall estimate—what do you think?  (I’m not sure why the GOP is trying to prevent ex-cons from getting the right to vote.)

P.S.  I would not go so far as to call those 20 million people “deplorables”, but they certainly are bad people.

PPS.  I’m in the 28%.  There is nothing “lower” than rock bottom, which is where I had already pegged him.

PPPS.  Keep in mind that there are also other types of bad people—such as those bigoted against Mexicans and Muslims, without approving of sexual assault.  If we added up all the various types of bad people, including bigots and sexual predators, how many would we have?

PPPPS.  Somebody needs to find the original data, and get me a gender breakdown on the 8%.

Update:  I probably should have indicated that most of the 8% were probably being sarcastic.  I was also trying to be sarcastic.