Back in early 2009, many economists seemed to move away from New Keynesian ideas, back to the so-called “vulgar Keynesianism” of the 1950s and 1960s. Recall that by the 1990s, the NKs accepted many ideas from the monetarists:
1. Monetary policy determines the path of NGDP, and thus fiscal countercyclical policy is useless.
2. Wages and prices are flexible in the long run, and hence the economy eventually adjusts back to LRAS curve. Demand side policies only have a short-term impact on output.
3. Sluggish growth in productivity and/or the size of the labor force reflects structural problems, and cannot be remedied by demand stimulus (which can reduce high unemployment).
In 2009, economists like Paul Krugman assured us that the abandonment of NK orthodoxy was temporary, that “everything’s different” at the zero bound. Fiscal policy can be effective when the Fed is out of ammo.
I was skeptical that this would be temporary, and thus I’m not surprised that the old-style Keynesian revival has survived into the post-zero bound period. Here’s Alan Blinder in the WSJ:
Let’s look at some of the agreement’s main provisions. The budget for fiscal year 2016 and beyond blows through the spending caps put in place in 2013. (Remember the fiscal cliff and the sequester?) Furthermore, Congress extended more than 50 special tax breaks, often called “extenders,” without paying for them. So if your Christmas wish was further deficit reduction, you ended up with a lump of coal.
But the federal deficit that President Obama proposed for fiscal 2016 was merely 2.5% of GDP—a number in line with historical norms. There was no need to shrink it. Furthermore, with a still sluggish economy and the Federal Reserve beginning to raise interest rates, a little fiscal stimulus is welcome, even if the agreement provides very little. The big bucks in the budget deal come in the tax extenders, which everyone knew would be extended regardless. So making some of them permanent does not provide stimulus, nor does it really raise future deficits.
Blinder seems to defend some outrageous and inefficient (GOP) tax breaks, on the grounds that they provide fiscal stimulus. But how can that be? The inflation targeting Fed would simply raise rates more quickly, to prevent inflation from rising above their preferred target path (which calls for restoring 2% inflation in about 2 years.) Keynesians used to argue that monetary offset doesn’t hold at the zero bound. I don’t agree, but that’s a defensible argument. The current claims being made by Blinder don’t even seem defensible, or at least I’ve never seen a plausible defense. In any case, it’s now clear that Krugman was wrong; the end of the zero bound would not bring an end to calls for fiscal stimulus. Instead of “everything’s different” we find out that “nothing’s different.”
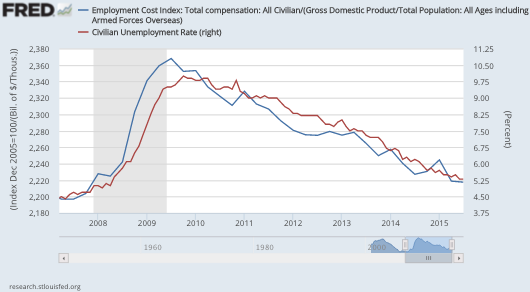
And Krugman himself seems to be jumping on the old Keynesian bandwagon, claiming that slow long-term growth reflects deficient demand, even though demand deficiencies would slow growth by raising the unemployment rate (in the Keynesian model), not by reducing productivity. And this claim is being made even though unemployment has fallen from 10% in 2009 to 5% today. Whatever this is, it’s not New Keynesian economics. It almost seems like economists have decided they want more fiscal stimulus, and then simply assume there must be a model that endorses their policy preferences.
You might complain that it’s unfair to tie Keynesians to the 1990s version of their model. Things change, and new hypotheses are dreamed up. Maybe there are mysterious “hysteresis effects” that allow demand stimulus to boost long-term growth. It didn’t work in Brazil, but hey, maybe it could work here. So shall we treat Krugman’s recent musings as an interesting new hypothesis, something to study and discuss? I’d be happy to, but Krugman himself won’t allow it. In a mind-boggling tone-deaf post he trashes Timothy Taylor (a moderate who supports fiscal stimulus during recessions). Here’s Taylor’s response:
Paul Krugman was “quite unhappy” with a paragraph in my blog post last Monday concerning “Secular Stagnation: An Update.” In his characteristic high-decibel mode, Paul manages in a single post to use the phrases “both wrong and, to some extent, cowardly,” “change the subject,” “actually engaged in an act of evasion,” “refusing to take sides is a dereliction of responsibility,” and more.
If that’s how he reacts to Taylor, I sure hope he never reads my posts. Unlike Taylor, I don’t even think that what Taylor calls the “2009-2012” fiscal stimulus helped, and can’t help noticing that GDP growth accelerated slightly immediately after it ended.
So Paul Krugman creates a new demand-side theory of secular stagnation, and then trashes the character of anyone who doesn’t immediately buy into his model. A model Krugman himself would have scoffed at in the 1990s. Indeed did scoff at, even a year after he had written his famous 1998 “Road to Damascus” revisionist model of the liquidity trap:
What continues to amaze me is this: Japan’s current strategy of massive, unsustainable deficit spending in the hopes that this will somehow generate a self-sustained recovery is currently regarded as the orthodox, sensible thing to do – even though it can be justified only by exotic stories about multiple equilibria, the sort of thing you would imagine only a professor could believe. Meanwhile further steps on monetary policy – the sort of thing you would advocate if you believed in a more conventional, boring model, one in which the problem is simply a question of the savings-investment balance – are rejected as dangerously radical and unbecoming of a dignified economy.
Will somebody please explain this to me?
So apparently the Paul Krugman of the 1980s and 1990s, the one who did research that later resulted in a Nobel Prize, was also a “cowardly” and “evasive” person who refused to take responsibility for demanding fiscal stimulus. Just like poor Timothy Taylor. Should the Nobel Prize be returned? Or was it awarded in anticipation of his later heterodoxy, just as President Obama’s 2009 Nobel Peace Prize was awarded for all the drone strikes, Libyan bombings, Syrian bombings, etc., that he was undoubtedly going to avoid doing during his Presidency.
HT: TravisV


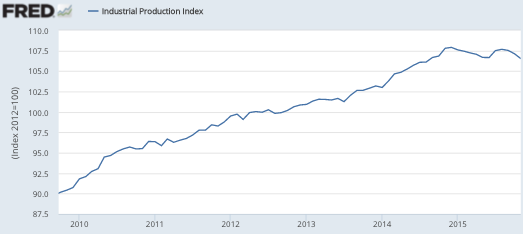
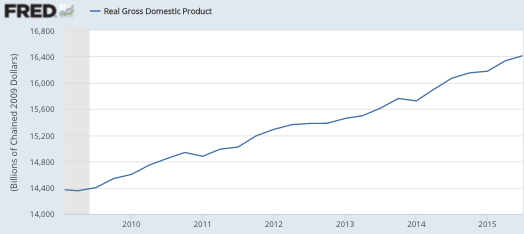 Somehow RGDP has maintained a roughly 2% growth rate since 2010, despite a sudden slump in the industrial sector. Is that even possible? Yes, services picked up the slack.
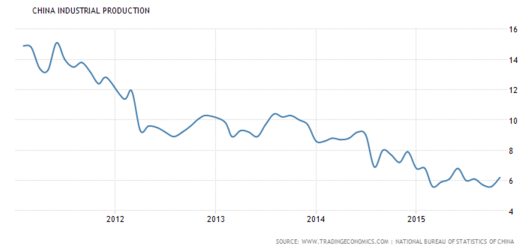
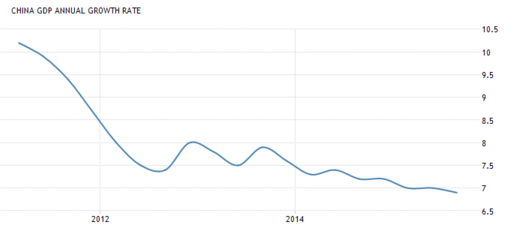 However there is one very important difference between the two cases. Lots of people believe the Chinese GDP data can’t possibly be correct, given the big reduction in the growth rate of industrial production. But I don’t recall anyone questioning the US figures, despite an even larger slowdown in the growth rate of industrial production.