Multipliers are ratios. That’s really all they are. There is the money multiplier (M2/MB), the fiscal multiplier (1/MPS) and the velocity of circulation (NGDP/MB, or NGDP/M2). If you assume these ratios are stable, you can derive some very interesting policy results. Of course the ratios are not completely stable, but may be stable enough to be of some value. Sometimes. My own view is that multipliers aren’t particularly useful, but today I’d like to assume the opposite, and show that the implications are not necessarily what you might assume. (And please, no comments from MMT zombies “explaining” to me that multipliers don’t exist.)
Milton Friedman faced a quandary when trying to explain how bad government policies led to the Great Depression. If he defined the money supply as “the monetary base” (as I prefer), people would have pointed out that the base increased sharply during the Great Depression. Alternatively, he could have adopted the market monetarist practice of defining the stance of monetary policy in terms of changes in NGDP. Thus falling NGDP during 1929-33 was, ipso facto, tight money. His critics would have objected that this begged the question of how could the Fed have prevented NGDP from falling.
So he split the difference, and settled on M2 as both the definition of money, and the indicator of the stance of monetary policy. He suggested that, “What is money?” was essentially an empirical question, not to be determined on theoretical first principles. His statistical analysis led him to conclude that M2 (which unlike the base did fall during the early 1930s) was the preferred definition of money. And also that growth in M2 should be kept stable at roughly 4%/year.
In my view M2 no longer represents a good definition of money, using Friedman’s pragmatic criterion. Look at M2 growth in recent years:
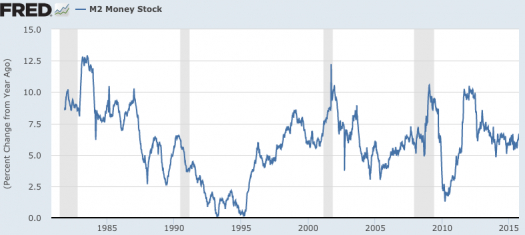 I don’t know about you, but I see almost no correlation with the business cycle. Indeed M2 growth soared in the first half of 2009, making money look “easy”, which is obviously crazy. So if Friedman were alive today, how would he define money? The base still doesn’t work, as reserves also soared in 2008-09. Nor does M2. I don’t have a good answer, but I suspect that coins might be the best definition. Unlike the base and M1, periods of illiquidity probably don’t lead to massive hoarding of coins. They are primarily useful for making transactions (although a sizable stock is held in piggy banks.)
Unfortunately, I could not find any data for the stock of coins in circulation. (Which is a disgrace, when you think about the 100,000s of data series the St Louis Fred does carry. As I recall, back in the 1990s coins were almost as important a part of the base as bank reserves.) But I did find data on annual coin output. For simplicity, I chose unit output, but value of output (which counts quarters 5 times more than nickels) would almost certainly lead to broadly similar results. In the list below I will show the change in annual coin output, compared to the year before, and also the change in the unemployment rate at mid-year (June) compared to the year before. The unemployment rate change is in absolute terms:
Year * Coin Output * delta Un
2000: +28.1% -0.3%
2001: -30.9% +0.5%
2002: -25.7% +1.3%
2003: -16.5% +0.5%
2004: +9.5% -0.7%
2005: +16.1% -0.6%
2006: +1.4% -0.3%
2007: -6.9% 0.0%
2008: -29.8% +1.0%
2009: -65.0% +3.9%
2010: +79.6% -0.1%
2011: +28.7% -0.3%
2012: +13.9% -0.9%
Unfortunately my data ends at 2012, but that’s a really interesting pattern. Especially given that I don’t have the data I’d actually prefer. I’d like the change in the size of the coin stock; instead I have the change in the flow of new coins (but not data on old coins withdrawn.) It’s more like a second derivative.
In any case, it’s an amazing correlation. The signs are opposite in every case except the one where unemployment doesn’t change at all. Coin output falls during years when unemployment is rising, even years like 2003 when unemployment is rising during a non-recession year. And even better, the biggest change by far in coin output (proportionally) is in 2009, which also saw the biggest change by far in unemployment.
If you are not good at math then you’ll have to take my word for 2010 being a smaller change in proportional terms. Indeed if you look at actual coin output in levels, 2010 was the second smallest in the sample, 2011 the third smallest, and 2012 the 4th smallest. The decline in 2009 was so great that we never really climbed out of the hole.
Now let me emphasize that there’s an element of luck here. If we had coin data for 2013 and 2014 I doubt the relationship would hold up. Coin output seems to be in a steep secular decline. So it’s partly coincidence that the signs are reversed in virtually every case. But not entirely coincidence. Perhaps someone could do a regression (using first differences of logs of coin output—so that the 2009 change will be larger than 2010) and confirm my suspicion that this relationship does show something real. Falling coin output is associated with recessions.
But does it cause recessions? If only you knew how tricky the term ’cause’ really is! Krugman basically called Friedman a liar (soon after Friedman died) for claiming that tight money caused the Great Depression, whereas in Krugman’s view Friedman’s data pointed to the real problem being a non-activist Fed—they didn’t do enough to prevent M2 from falling. But they didn’t cause it to fall with concrete steppes. The base didn’t fall.
I’ve always believed we should think of “causation” in terms of policy counterfactuals. Suppose the Fed had acted in such a way that M2 didn’t fall. And suppose that in that case there would have been no Great Depression. Then if the Fed was capable of preventing M2 from falling (which is itself a highly debatable claim) then there is a sense in which Friedman was right, the Fed did cause the Great Depression. Again, that’s if they could have prevented M2 from falling, and if stable M2 would have prevented a depression–both debatable (but plausible) claims.
My claim is that if we use Friedman’s pragmatic criterion for defining money, then coins might possibly be the best definition of money for the 21st century. If the Fed had acted in such a way that coin output was stable in 2007-09, or at worst declined along its long run downward trend, then there would have been no Great Recession. So in that sense the fall in coin output “caused” the Great Recession. But I could also find a 1000 other “causes,” such as plunging auto sales.
Can the Fed control the coin stock? I’d say they could in exactly the same way they can control M2 (or nominal auto sales), via a multiplier. The baseline assumption is that both the coin stock and M2 move in proportion to the base. That would be the case if the M2 and coin multipliers were stable. If the multipliers change, then the Fed simply adjusts the base to offset the effect of any change in the coin multiplier.
No let me quickly emphasize that I view the preceding as an extremely unhelpful way of thinking about monetary policy and the Great Recession. I still prefer to define money as the base, as the base is directly controlled by the Fed. And I prefer to define the stance of monetary policy as NGDP growth expectations. And I prefer to think of tight money as setting the monetary base at a level where NGDP growth expectations fall below target, as in 2008-09. I’d just as soon leave coins to children with piggy banks and nerdy collectors. But if you insist on defining money using Friedman’s pragmatic criterion, then coins are my definition of the money stock.
A penny for your thoughts?
PS. I have a new post on the Phillips Curve at Econlog.