Archive for October 2015


Kevin Erdmann on the housing “boom”

Kevin left this comment after my last post:

I will just add that if we asked someone to point out where reckless monetary policy led to a demand-side housing bubble, nobody looking at those last two graphs would pick the 2000s. Nobody. The entire public discussion of finance over the past 15 years has been a massive exercise in reasoning from a price change. It’s not even like there is a point to it but some people take it too far. There is simply nothing there besides reasoning from a price change.

NGDP growth at the peak in the 2000s barely even reached the average growth rate of post WW II, yet the description that is considered above a burden of proof is the one that sees this period as some sort of crazed bubble where debt and money were flowing out of control.

Marcus Nunes also made a good point:

Scott, I think there are several things wrong in this post!
You should reread your early Feb 09 post: GDP=Y+C+I+NX=Gross Deceptive Partitioning!

If we use that earlier post as a starting point, we’d begin by looking at NGDP instability.  Then we’d ask why RGDP instability deviated from that level during certain periods, such as the 1970s.  And almost by definition it would have to be due to non-procyclical prices, such as the oil shocks, or price controls, or perhaps AS shifting due to changes in expected inflation.  All three occurred during the Great Inflation.  In other words, the analysis of components was a sort of dead end in Marcus’s view, and he’s probably right.

Caroline Baum sent me a NYT story with “reasoning from a price change” implications. It is entitled “A Global Chill in Commodity Demand Hits America’s Heartland.”  To its credit they do also mention the previously popular “tax cut” theory:

The 37 percent drop in gasoline prices since the summer of 2014 is the equivalent of a $100 billion tax cut, providing much-needed relief while wages remain stuck.

Certainly falling commodity prices have different effects on different sectors, but as for overall RGDP?  That would be reasoning from a price change.

And finally, someone needs to tell Greg Mankiw that “objects in his rear view mirror may be closer than they appear”.  (And for the first and last time in my life I’m one ahead of Krugman on a list.)

Screen Shot 2015-10-26 at 5.08.54 PMYes, I know, it’s not textbook season.

What Caused the Great Moderation? And was it sudden or gradual?

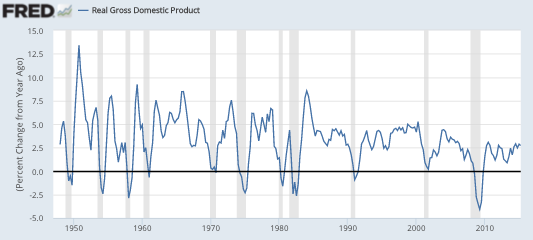
There’s a new Vox article by Lola Gadea, Ana Gomez-Loscos, and Gabriel Pérez-Quirós showing that the Great Moderation that began around 1984 is still intact, despite the Great Recession.  This got me thinking about the cause or causes of the Great Moderation.  In the end I’ll argue there were two causes, and that the moderation actually occurred in two steps, first in 1961 and then in 1984.  Here’s a RGDP growth rate graph that clearly shows a decline in volatility after 1984:
Screen Shot 2015-10-26 at 10.52.51 AMThe first idea that popped into my head was that industrial production is unusually volatile, and has been becoming a smaller share of our economy.  When did this start? I don’t have data on IP as a share of the economy, but this graph shows that manufacturing has been shrinking as a share of GDP, and manufacturing is the vast bulk of IP.
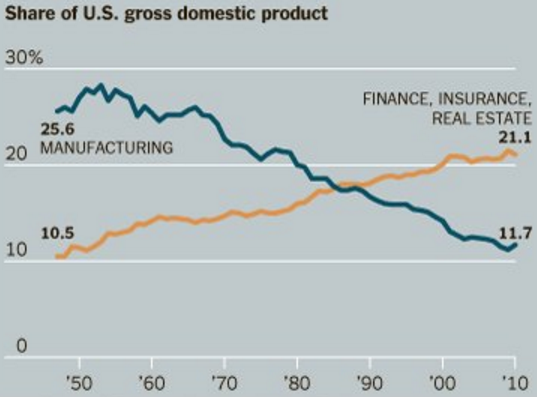
Screen Shot 2015-10-26 at 10.56.11 AMSo maybe the Great Moderation simply reflects the shrinking share of this highly cyclical industry. Unfortunately, further research disproved that theory, as even IP has been getting much less volatile over time:
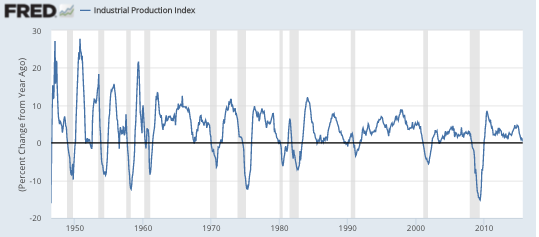
Screen Shot 2015-10-26 at 10.58.51 AMNow you can begin to see why I hypothesized two stages in the Great Moderation. The five business cycles during the Truman/Eisenhower years saw especially volatile IP.  Most strikingly, the smallest peak of those 5 cycles (my birth year) is higher than the highest peak since 1960.  On the IP graph it looks like the Great Moderation began in 1961, and then got even more moderate after 1984.  So that made me wonder why other researchers don’t point to 1961 as the turning point.

Go back to the real GDP graph, and you’ll see why.  The moderation in real GDP during the Kennedy through early Reagan years (say 1961-84) is much less pronounced than for IP.  Not really statistically significant.

We’ve looked at IP, so what’s left?  Most of what’s left is consumption—was that becoming more volatile during 1961-84, offsetting the improvement in IP stability?
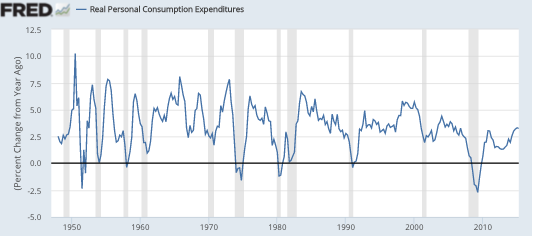
Screen Shot 2015-10-26 at 11.05.22 AMNot as far as I can tell. Indeed if it weren’t for the two severe oil shocks (1974 and 1980) consumption might well have become less volatile after 1961.  If those two oil shocks had occurred in the Truman/Eisenhower years, and not during 1961-84, then perhaps the Great Moderation would have been dated from 1961.

But we still have a mystery to explain.  The reduced volatility in IP after 1961 is quite clear, whereas consumption is about the same, or perhaps slightly less volatile.  So why doesn’t the real GDP graph show more improvement?  After all, consumption and IP are most of the economy (and yes I know I’m double counting a bit here, but my question remains.)

One thing that’s left is construction.  I could not find a real construction series going back that far, but did find residential investment:
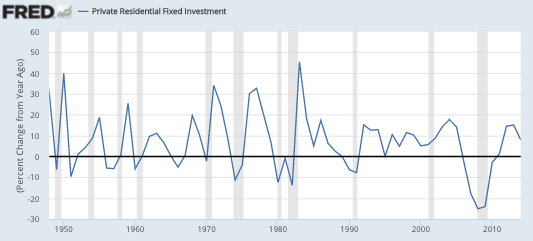
Screen Shot 2015-10-26 at 11.10.58 AMNow we are getting somewhere!  Notice that residential investment is actually more volatile during 1966 to 1984 that during the preceding 14 years.  Yes, home building is a modest share of GDP, but look at the swings in those growth rates.  (I could only find nominal growth, but the swings are so large that they’d also show up in real growth.)

So now we seem to have a partial answer.  There was some tendency for the economy to moderate after 1961, but mostly if you exclude homebuilding.  If you include homebuilding, then 1984 looks like the year that the Great Moderation began.  The question is why?

Here’s the graph you have all been waiting for, monetary policy (er, I mean NGDP growth.)
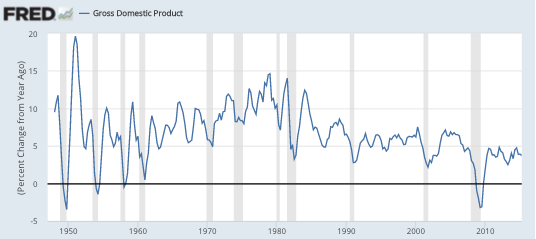
Screen Shot 2015-10-26 at 11.16.12 AMNGDP growth volatility clearly fell after 1961, and then moderated further after 1984 (except for 2008-09, obviously.)

So why didn’t RGDP growth moderate as much as NGDP growth, during the 1961-84 period?  The easy answer is the two oil shocks.  (And I’d add the imposition and removal of price controls in 1971-75.)  Yes, that may be part of the story; the oil shocks hit consumption hard.  But let’s think about residential investment, which became more volatile during the middle period.  Why did that occur when NGDP growth was becoming more stable?

The answer seems clear, NGDP growth from one year to the next was becoming more stable, but the longer-term NGDP growth rate was becoming unanchored, as inflation soared from 1% to 13%.  With trend NGDP growth changing significantly, and unexpectedly, long-term nominal interest rates (on T-bonds and fixed rate mortgages) became highly unstable.  Yields on 30-year T-bills soared to roughly 15% in 1981.

Because of our peculiar residential mortgage system, these big swings in interest rates whipsawed residential investment, making it highly volatile during the Great Inflation. That’s why the Great Inflation had to end before the Great Moderation could begin.  It also implies that if the Great Inflation had been steady inflation/NGDP growth, which was predictable, then the Great Moderation would have begun in 1961, not 1984.  (And if my grandmother had wings . . . )

In this story there are two key milestones:

1. In 1961 the Fed figured out how to avoid the stop-go policies of the previous 15 years. But their technique left longer-term inflation/NGDP growth completely unanchored. After 1984 the Fed figured out how to walk and chew gum at the same time, how to keep inflation both low and stable.  Ditto for NGDP growth (except 2008-09)

If you look closely at the residential investment graph, you’ll see that homebuilding was more volatile in the 1990-91 recession than in the 2001 recession.  That may be because in the first of the two we were still working off the last bit of the Great Inflation. Inflation went into that recession at a 4.5% rate, and came out closer to 2%. In the 2001 recession we entered and left the recession with about the same (2%) inflation rate.  Of course there were other factors too, the 2001 recession was focused on business investment, and the resulting fall in interest rates helped homebuilding.  In 1990, homebuilding had been overextended by reckless S&L lending.  But even with all the craziness in homebuilding in the past few decades, the 1970s were even more unstable.

Obviously the Great Recession is sui generis (first time I’ve used that term), but in the recovery period we are back to eerily steady RGDP growth.  The 5 recessions in 15 years that we saw after WWII now seems like ancient history.  I can’t even imagine the US having 5 recessions in the next 15 years—although the one thing I’ve learned in macro is that just when you expect something will never return (like zero interest rates) it comes back.  So all forecasts are provisional.

PS.  IP involves domestic capital goods, domestic consumer goods and exports. The domestic consumer goods portion is double-counted in my analysis.  It might have been better to use services rather than consumption—but I doubt my conclusions would have changed.

Two types of economists

One type of economist looks at the real world, and notices causal relationships. They notice that central bank policies have a massive impact on asset markets all over the world.  They build models to try to understand that impact, and try to derive implications for improving monetary policy.

Another type of economist starts with their models–the more abstract and unrealistic the better.  Then they notice that according to their models central bank policy should have no impact at all.  And so that’s what they assume to be the case.

Friedman and Schwartz (1963) represent the first type.  My book on the Depression (coming out in December) represents my attempt to follow in their footsteps.

PS.  At 2pm I’ll have a fairly long post on Bernanke’s memoir, at Econlog.  I didn’t mention names here because I’m painting with a broad brush and any individual might claim (perhaps with justification) that I’ve oversimplified.  But I do see these tendencies in both the New Keynesian and New Classical communities, at least at the zero bound.  I’m actually making a plea for economists to pay more attention to the valuable information embedded in asset price movements.

PPS.  It’s deeply discounted at Amazon (51 cents off), plus free shipping.

Did the world dodge another bullet?

A couple months ago there was concern about the possibility of a global recession. This was based on falling commodity prices, a slowing economy in China, and a weak economy in Europe and Japan.  There were also fears of a September Fed rate increase. Equity markets fell, as did bond yields.

My own view was that the risk of recession (both US and global) was rising modestly, but still far less than 50-50.  I think I mentioned a 20% risk for the US next year.  Now I suspect even that risk has declined a bit.  Here is some data out today:

South Korean GDP rose 1.2 per cent quarter-on-quarter, ahead of economists’ average forecast of 1 per cent and of the 0.3 per cent expansion in the second quarter, when consumer spending was affected by fears around an outbreak of Middle East Respiratory Syndrome. This is the fastest rate of quarterly growth since the second quarter of 2010.

.  .  .

Government figures* show that South Korea’s exports declined 6.6 per cent in dollar terms in the first nine months of this year, with exports to the EU declining 11.2 per cent while those to China – by far South Korea’s biggest trading partner – fell 3.8 per cent.

And from Japan:

Manufacturing activity in Japan rose more than expected in October, with a closely watched PMI survey showing the highest reading in over eighteen months.

The Nikkei/Markit manufacturing PMI reading for October came in at 52.5, compared to expectations of 50.5. This was the highest reading since March 2014, when it was 53.9.

BTW, in a few weeks the media will probably report another Japanese “recession” which will be just as phony as the one last year.  Again, trend Japanese RGDP growth is zero.

Both the Japanese and Korean economies are closely linked with China.  These are not the sorts of numbers you’d expect if China were sliding into recession (even with the weak Korean exports).  Nonetheless the Chinese government is concerned enough about the slowdown to ease policy today:

China’s economy beat expectations in the third quarter but still expanded at its slowest pace since 2009 at 6.9 per cent in inflation-adjusted terms. Growth was even slower in nominal terms at 6.2 per cent, with much of the manufacturing sector suffering from deflation.

“The PBoC’s two-pronged monetary policy action signals an intensification of policy measures intended to combat the economic slowdown in China,” said Eswar Prasad, Cornell University professor and former China head of the International Monetary Fund.

“It heightens concerns that the economy may be losing growth momentum somewhat faster than suggested by the headline official GDP growth rate.”

Analysts say the latest rate cut is aimed at industrial borrowers, who are struggling to service debt that is fixed in nominal terms, even as falling prices decrease their revenue. The cut brings the one-year benchmark deposit rate to 1.5 per cent “” its lowest level on record “” from 1.75 per cent. The required reserve ratio was lowered by 0.5 percentage points to 17.5 per cent.

Weak NGDP growth hurts borrowers with nominal debts—where have we seen that point emphasized?

Just a couple days ago a commenter dared me to produce a recent example of Chinese economic liberalization.  There are lots of such examples, if you bother to pay attention. Here’s one that occurred today:

China scrapped a ceiling on deposit rates, tackling what the central bank has called the “riskiest” part of freeing up the nation’s interest rates.

The move came as the central bank cut benchmark rates and banks’ reserve requirements to support a faltering economy. The changes take effect on Saturday, the People’s Bank of China said in a statement on Friday.

Scrapping interest-rate controls boosts the role of markets in the economy, part of efforts by Premier Li Keqiang to find new engines of growth. While officials must be on guard for any excessive competition for deposits that could increase borrowing costs for companies or lead to lenders going bust, weakness in the economy may be mitigating the risks.

Some people just can’t accept the fact that the “Communist” Chinese are gradually converting to capitalism, and desperately point to the gradually diminishing number of areas that are still statist (such as heavy industry/banking and utility SOEs.)

In the US, long-term interest rates are somewhat higher today, because monetary policy is getting more expansionary, pushing up NGDP growth forecasts.  The ECB is also doing its part, as we saw yesterday.  But eurozone interest rates were lower, as the direct impact of the expected bond purchases overwhelmed the indirect effect of faster growth.  Never reason from an interest rate change.

Over the past 5 years we’ve seen a few global “growth scares”, notably in 2011. Equity markets fell significantly, but then in each case later recovered. That might mean the growth scare was not real, or it might mean that it was real, but policymakers did enough to address growth concerns. Later this month the Fed and BOJ will meet—it will be interesting to see if they help to end the recent global recession scare, or end up reviving the worries.

Markets react strongly to another “meaningless” hint from the ECB

The view that QE is ineffective is pretty widely held—except in the asset markets. Earlier today, Mario Draghi hinted than another round of QE might be coming later in the year, if the global economy continues to be weak.  The euro fell 2% against the dollar, and European stock indices rose sharply.  Even Wall Street rallied on the news (so much for “beggar-thy-neighbor” theories.)  For an ineffective policy QE sure has a big effect on asset prices.  (And note that the big move down in the euro means that imported oil, and other commodities, are immediately more expensive, and hence the eurozone cost of living rose a few basis points today.)

At the same time these steps are much too weak to solve “the problem”, they merely make the eurozone economy a bit less weak.  The ECB should do much more.  One possible step is a further cut in interest rates:

“The ECB will almost certainly be delivering an early Christmas present this year,” said Nick Kounis, head of macro and financial markets research at ABN Amro.

“This could include an adjustment of the QE programme but also further policy rate cuts, something which had been ruled out before.”

Analysts at Barclays said: “We do not rule out the possibility of a deposit rate cut in December, although this is not our baseline. The likely trigger for a deposit rate cut, in our view, would be a further material appreciation of the euro, possibly in a scenario where the Fed remains on hold for longer.”

Wait, I thought the zero bound was the lowest that rates can fall.  I guess not. Lower interest rates will help, but what they really need is a better policy target, as explained by James Alexander:

Nominal GDP growth and thus Real GDP growth cannot get that much better in the Eurozone as a whole while the overarching target remains the self-defeating one of the <2% inflation ceiling. Draghi can prevent tail risks with the QE programme, lower rates for longer and even more negative rates. But it will never be enough to see healthy growth. The inflation ceiling offsets almost of the good work from the other policies.

Overall, monetary policy is just not that accommodative. Draghi says he and his fellow governors and their staff are working hard:

“the strength and persistence of the factors that are currently slowing the return of inflation to levels below, but close to, 2% in the medium term require thorough analysis.”

Please, Mr Draghi, it is the mandate itself that is the obstacle. In the UK we may be looking soon at the mandate  and there were hints that the European Parliament is also looking into the mandate. At least talk about NGDP Targeting and you can then “Feel The Power” in time for the pre-Christmas release of Star Wars 7.

Amen.