Archive for February 2015


What does MV = PY actually mean?

It means V is PY/M.

And that’s all it means.  But the textbook description of MV=PY is sometimes a bit confusing, as it seems to say two conflicting things:

1.  V is the velocity of circulation, the average number of times a dollar is spent per year

2.  MV = PY is an identity.  But this suggests V is defined as PY/M

So which is it?  It turns out that when MV= PY was first created, V was probably something like #1, but today #2 is the accepted definition.

For example, some money is spent on things that are not a part of GDP, such as used goods, or intermediate goods.  So could we fix the definition by calling V the “average number of times a dollar is spent on final goods”?  Unfortunately no, as there are some final goods for which money is not spent.   Suppose that (on average) each dollar was spent 15 times per year on final goods transactions.  And suppose there were a trillion dollars in money in circulation.  Would NGDP be $15 trillion?  No, as NGDP also includes things like implicit rent on owner-occupied housing, for which no money changes hands.

Similarly, saving once had a common sense meaning that was different from investment.  Saving and investment (as defined in earlier eras) were not equal by definition.  But then economists found it useful to define saving as the funds spent on investment.  They became two sides of the same coin, like sales and purchases.

Now it’s not clear if these identities are useful.  I think they are, as (for instance) it’s simpler to model NGDP if it equals M*V, than if it equals M*V*ff, where ff is a fudge factor to account for the fact that there are issues like owner-occupied housing.

Oddly, there is another version of the equation of exchange where the common sense definition is exactly right:

M = k*P*Y

Where k is both:

1.  M/PY

2.  The average share of gross domestic income held as cash balances (globally).

It’s unfortunate that most textbooks rely on the version of the equation of exchange where the common sense definition is not equal to the official definition.

Suppose the government suddenly redefined cars as a capital good (they are currently considered consumer goods.)  Gross investment would immediately soar much higher (although net investment, which really matters, wouldn’t change all that much.)

So would saving still be equal to investment?  Yes, because at the same moment gross saving would also soar in value, as funds spent on cars would now get included into saving.

Many commenters on confused on that point.  They talk about Americans “spending” lots of money on housing during the housing boom, instead of “saving” the money. But according to the official definition, spending on new housing is saving.  Perhaps spending on cars should also be viewed as gross saving.

Even better, why not stop obsessing over the C+I+G+NX = GDP relationship, and just focus on NGDP.  The line between C and I is quite arbitrary, and not all that important for issues like the business cycle.  It’s NGDP that matters.

At one time Keynesians thought saving was really important for the business cycle, but in the New Keynesian era we all realized that it wasn’t, what mattered was monetary policy.  No more paradox of thrift.  Unfortunately some have forgotten that lesson, others have wrongly assumed that everything is different at the zero bound.  It isn’t.

PS.  This is inspired by a recent post by David Glasner.  This paragraph is worth commenting on:

OK, savings are the funds used for investment. Does that mean that savings and investment are identical? Savings are funds accruing (unconsumed income measured in dollars per unit time); investments are real physical assets produced per unit time, so they obviously are not identical physical entities. So it is not self-evident – at least not to me “” how the funds for investment can be said to be identical to investment itself.

The “S” and “I” that are used in national income accounting are both measured in dollar terms.  It’s not the number of houses built that matter, but the dollar value of expenditure on those houses.  So there is no “apple and oranges” comparison problem here.  Both saving and investment can be measured in either real or nominal terms. In either case they will always be exactly identical, because they are defined as being identical.  However, just as with MV=PY, I can imagine definitions of saving where S=I is not an identity.

The Economist on good and bad deflation

The Economist magazine has a very good editorial discussing good and bad deflation, and worries that the world is now experiencing (at least in part) the bad type. They conclude by urging central bankers to rely on a less ambiguous indicator:

Change the target

Policymakers should be more worried than they appear to be, and their actions to avert deflation should be bolder. Governments need to boost demand by spending more on infrastructure; central banks should err on the side of looseness. (Next month the ECB will start quantitative easing””and about time too.) Now is also the moment to consider revising the monetary rule book””in particular, to switch the central bankers’ target from the inflation rate that most now favour to a goal for the level of nominal GDP, the total value of spending in an economy before adjusting for inflation. With such a target there is no need to distinguish between good and bad price shocks. And the change in rules would itself send a signal that policymakers are serious about banishing the threat of deflation.

Central bankers change course slowly, and their allegiance to inflation targets runs deep. Conservatism often serves them well. But in this case it could cost the world economy dearly.

Notice that they advocate “level” targeting, which is very important in a world where the zero bound seems to occur with increasing frequency.

HT:  Peter Spence, Frank McCormick

PS. I also recommend Edward Hugh’s post on Spanish deflation.

Life expectancy in Shanghai

Here’s Paul Krugman:

I’m being flip, but the AQI in Delhi was 263, which is serious don’t-breathe-too-hard territory; actually, on day one I blithely tried my usual morning routine, and really felt the difference. Hong Kong was better but having an unusually bad stretch, and Shanghai was back to the air apparent. No big deal for me, of course, but the health costs to those who live there must be immense.

The pollution is quite bad in Shanghai, but I wonder about those health costs.  Are they truly “immense?”  Here’s a list of life expectancy of some countries.  Japan leads the world, and Iceland leads Europe.  Of course Iceland has virtually no air pollution.  I also included some other East Asian countries:

Japan   84.6

Singapore  84.0

Hong Kong  83.8

Iceland   83.3

Shanghai  82.3

Beijing  81.3

Korea   81.0

Taiwan  80.6

US  79.8

Denmark   79.5

If the health cost of air pollution is immense, why is Singapore’s life expectancy only 0.2 years above highly polluted Hong Kong?  Also keep in mind that the Chinese smoke at a very high rate, which could easily take a year off their life expectancy, even with no air pollution.  And if the cost is truly “immense,” what adjective would describe the health cost of all that cheese, butter and bacon consumed by the Danes?

Every few years I spend a month in Beijing, which is much more polluted than Shanghai.  After the first day you never pay any attention to the pollution, except that it makes the city look uglier. The severe pollution in Beijing probably does slightly reduce their life expectancy, although the fact that Shanghai is richer and has a milder climate may also explain part of the difference.  But I get really annoyed when I read press reports like this one:

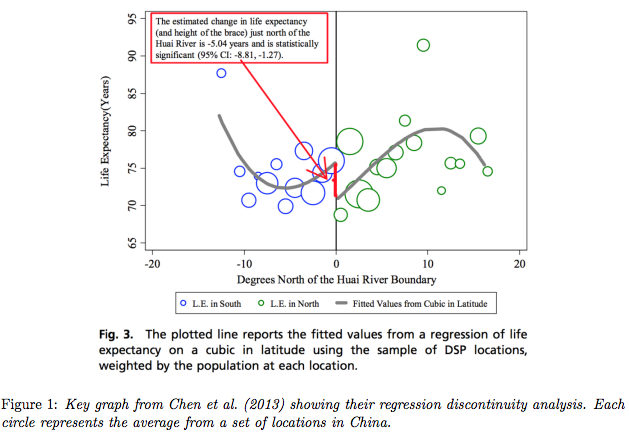
They’ve learned too that in the two decades from 1981-2001 the life expectancy of the 500 million Chinese living in the north was a full 5.5 years shorter than that of their fellow citizens in the south. The reason? Heavier coal use for heating during the north’s frigid winters.

That’s not at all what the study they refer to (by Chen et al) claims.  Andrew Gelman and Adam Zelizer have an excellent paper that uses the Chen et al study to look at the broader issues of statistical significance.  Here’s a graph from the study they criticize.  I don’t see any difference in life expectancy between the north and south of China.  The finding is based on the assumption that the data should be fit with a cubic model rather than a linear model.  Here’s the graph showing where the 5.5 years comes from:

Screen Shot 2015-02-12 at 9.05.56 PM

How much confidence can we have that the cubic model is correct?

And this is even more dubious:

Now that we know China’s air pollution problem is impacting the air here in the United States, it’s important to understand what that pollution is doing to public health in China.

According to a new study, it could be taking up to 16 years off people’s lives.

I’ll end with some sensible suggestions from the Gelman/Zelizer paper:

4.3. Skepticism without nihilism

The current rules of publication seem to us to be simultaneously too loose (in the sense of accepting the highly questionable analysis indicated in Figure 1) and too restrictive (in essentially demanding statistical significance, obtained some way or another, as a condition for acceptance).

.   .  .

We have the impression that research journals have an implicit rule that under normal circumstances they will publish this sort of quantitative empirical paper only if it has statistically significant results. That’s a discontinuity right there, and researchers in various fields (for example, Button et al., 2013) have found evidence that it introduces endogeneity in the forcing variable.

PS.  I do wish the Chinese government would institute changes in local governance and/or property rights that would reduce pollution.  It’s not as bad as is claimed, but it is still a problem.  Gelman and Zelizer also emphasize that the are not questioning the claim that China has a severe air quality problem, merely the reliability of the 5.5 year estimate widely cited in the media.


Obama’s horrible advice to Germany

This caught my eye:

Greece’s pleas to stop the “fiscal waterboarding” of its devastated economy are substantively no different from President Obama’s repeated warnings to Germany to stop bleeding the euro area economy with excessive fiscal austerity. Sadly, the president’s reportedly more than a dozen phone calls to the German Chancellor Merkel in 2011 and 2012 urging supportive economic policies in the euro area fell on deaf ears.

These calls were not just brushed aside; they were plainly ridiculed as Chancellor Merkel kept telling the media that “it made no sense to be adding new debt to old debt.”

This advice would have merely added to the eurozone debt woes, without doing anything to promote recovery,  Even worse, most of the countries lacked the ability to spend more, as the markets were worried they might default on their debts.  Germany could have spent more, but any extra demand in Germany would have been offset by even less growth in the other countries, leaving total eurozone AD unchanged.  That’s the real “beggar-thy-neighbor” policy.

People reading this will probably assume I’m making wacky market monetarist claims again.  But unless I’m mistaken Paul Krugman agrees with me.  After all, he has repeatedly said that when not at the zero bound, central banks determine the path of inflation.  The eurozone was not at the zero bound in 2011, and indeed the ECB was repeatedly raising rates to slow inflation.  Had there been more fiscal stimulus, the ECB would have raised rates even more, offsetting the effect.  That’s what an inflation target means.  If you don’t like it, then don’t target inflation.

There is one type of fiscal stimulus that would have been effective, employer-side payroll tax cuts.  Oddly, in the past Krugman has been relatively skeptical of this approach, and I’ve been more supportive.  So you could argue that I’m more supportive than Krugman of the argument that fiscal stimulus might have helped the eurozone in 2011, but only a very specific type of stimulus.

PS.  I love the way the press acts as if the fiscal austerity was forced onto Greece, with the metaphor “fiscal waterboarding.”  Greece could have said “we don’t want your emergency assistance with strings attached”, and left the eurozone.  Maybe they should have done so.

PPS.  Over at Econlog I catch Robert Shiller reasoning from a price change.


Making life easier for central bankers

This is from an excellent article at Free Exchange:

THE Bank of England released its quarterly inflation report this morning. It also published the letter from Mark Carney, governor of the bank, to George Osborne, Britain’s chancellor of the exchequer, that was required to explain why inflation””currently 0.5%””had deviated more than a percentage point below the bank’s target of 2%.

According to the report’s forecasts, inflation will turn negative in the coming months as a result of the huge fall in oil prices. However, the letter emphasises the short-term, one-off nature of the oil-price shock, which will fall out of the numbers relatively quickly and so requires no offsetting action. Mr Carney noted that in 68% of the categories which make up the CPI, prices are rising. In any case, the bank thinks it takes 18-24 months for monetary policy to have an impact on the economy; the oil-price fall came on much more quickly.

When asked whether the bank was overlooking the oil-price decline because it was unanticipated or because it was external to the economy, Mr Carney said it was the former. Were the bank able to forecast supply shocks in time to offset them, it would have to do so under its inflation-targeting mandate (“If we knew it, and could lean against it, we would”). Mr Carney hinted that in such a situation, it might be worth reconsidering the mandate.

It was interesting to listen to Carney’s comments in the second link—you can see why the Free Exchange writer saw Carney hinting that another mandate might be more appropriate.  At the same time, Carney sort of backed off before saying what you expected him to say—perhaps uneasily aware that he wasn’t really free to speak his mind on this issue; the mandate is up to the government.

On the other hand, when people are able to speak their minds it seems as though increasing numbers see the obvious virtues of NGDP targeting, including academics, bloggers, and indeed Mr Carney himself when he spoke in Toronto a few months before taking the BoE job.  Here’s Free Exchange:

That’s one of the problems with inflation-targeting regimes. The central bank uses its interest rate to steer demand. Demand shocks cause output and inflation to move in the same direction; if demand rises, both output and inflation tend to go up too. But a positive supply shock””like the recent fall in oil prices””increases output while suppressing inflation. To offset the deflationary effect of a “good” supply shock, the bank would have to lower interest rates to stimulate the domestic economy. That is, the bank would have to let the economy overheat. In the event of a negative supply-shock, such as an oil-price rise, the bank would have to slow down the domestic economy””potentially causing unemployment””in order to generate domestic deflationary pressure. The overall effect is to increase the volatility of domestic output, rather than promote macroeconomic stability, one of the intentions behind inflation targeting.

As has been frequently pointed out in the blogosphere, if the bank targeted nominal GDP (NGDP) rather than inflation, there would be no such problem. Under a such a regime, the bank would concern itself only with nominal spending in the economy, which can rise due to inflation or due to output growth (the supply-side of the economy determines the split between the two). The bank could therefore tolerate supply-side shocks which boosted growth and reduced inflation, as they would have an offsetting effect on NGDP. There would be no need to manipulate domestic output to offset forces from abroad.

Carney would have a much easier time at press conferences if he wasn’t constantly having to explain BoE policy that on the surface seemed inconsistent with inflation running much too high or much too low relative to the 2% mandate.  He could simply announce the NGDP growth rate, and explain in a very simple and transparent way why the BoE responded to that information with their current policy stance.

Carney also announced that the current policy rate (0.5%) was no longer viewed as the lower bound.  Here’s Britmouse:

The Governor of the Bank of England announced yesterday that interest rates are no longer at the Zero Lower Bound.  This was a rather under-the-breath “Oh, and by the way” announcement, which is kind of funny given how much some economists have staked on the significance of the ZLB.

.  .  .

In choosing to hold rates at 0.5%, the MPC is choosing to set rates above the new, lower, actual ZLB.  The Bank of England is no longer at the ZLB.

The good news is that now the Bank is off the ZLB, reality-based Keynesians will return to talking about UK macro policy in terms of conventional monetary policy and will go quiet about the need to use fiscal policy to control AD.  Right?

The other thing I find amusing is that Keynesians kept insisting that if only central banks could have cut rates further they would have.  That may have been the case at one time, but obviously is no longer true.  The BoE could cut them right now, but chooses not to.

PS.  Yichuan Wang has a good post criticizing my posts on the musical chairs model:

I have no disagreement on the policy advice. But I do have an issue with the way that Scott justifies his “musical chairs” model of employment. In particular, the key stylized fact”Š”””Šthe countercyclicality ratio of wages divided by nominal GDP”Š”””Šis not unique to his model. As such, it does not provide any smoking gun for the market monetarist claim that fluctuations in nominal GDP are key to understanding the business cycle.

.  .  .

Now, I still believe that a model of nominal GDP + sticky wages is a powerful framework. Wages are indeed sticky, as evidenced by a spike in the wage change distribution at 0. And if wages are sticky, monetary tightness and declining nominal GDP mean that people are paid high real wages and as such there are fewer jobs. Alternatively, you can view it as a liquidity issue as companies just don’t have enough nominal cash flows to pay those persistently elevated wages. So I don’t think there are too many issues with the underlying framework. I would just advise more caution on the way that statistical evidence is used.

I should be more careful in my discussion.  Yichuan is right that the correlations by themselves don’t provide much support for the musical chairs model, as they are also consistent with other models.  You might think of them as a necessary condition.  You actually need several assumptions:

1.  The fact that W/NGDP is highly correlated with unemployment.

2.  The fact than nominal wages are very sticky in the presence of high frequency NGDP shocks (lasting one, two or three years.)