Archive for February 2018


How likely is another Great Recession?

If you only have time for one post today, make it David Beckworth’s very important post showing that the Fed is edging in the direction of level targeting, indeed something not too far away from NGDPLT.

Tyler Cowen recently linked to my previous post:

5. Is another Great Recession just around the corner?  Well, is it?

I’m not sure what qualifies as a “Great Recession”.  I suppose 1893-97, the 1930s, the 1980-82 double dip, and 2007-09 are the most plausible candidates, at least since 1860.  So perhaps once every 40 years or so.

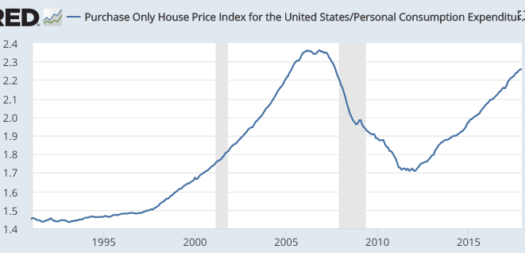
So let’s suppose I’m right that the “housing bubble” did not cause the Great Recession.  In that case, the fact that we are having another housing price boom is not particularly worrisome.  It doesn’t increase the odds of another Great Recession.  So let’s say the odds are roughly 1 in 10 that another Great Recession will occur in the next 4 years, based on past performance.

Can’t we forecast better?  I’m not sure, as the additional information we have cuts both ways.

1. Perhaps the slowness of the recovery makes it more likely that the expansion has more room to run.  Or perhaps we’ve learned something from the previous debacle.  Australia hasn’t had a recession in 27 years; no reason we can’t beat the record of the previous US expansion, which was 10 years.

2.  On the other hand, big recessions are more likely at the zero bound and we are likely to hit the zero bound again in the next recession.  So perhaps another Great Recession is now more likely than usual.

If I had to guess, I’d say point #1 is slightly more persuasive than point #2, but I don’t have a high degree of confidence.  Where I am confident is in stating that the housing bubble did not cause the Great Recession, and thus the current housing price boom (very similar to 2001-06), does not make another Great Recession highly likely in the near future.  Unless I’m mistaken, the bubble-mongers should be predicting another Great Recession in the near future.

PS.  I am amused to see commenters say, “it wasn’t the price bubble, it was blah, blah, blah.”  Deep down they know that the bubble theory is wrong, and they are looking for a way out.  Unfortunately, that’s rewriting history.  At the time, people were saying the problem was the price bubble.  They were saying that those prices were obviously unsustainable.  (Even though Canada, Australia, Britain, New Zealand, etc., did sustain them.) Kevin Erdmann has convincingly shown this “unsustainable” view is wrong, and more importantly he did so long before prices had recovered.  I’d have more sympathy for the other side if in 2012 they had not said “prices were obviously crazy in 2006”, but rather had said, “prices in 2006 might be rational at a given interest rate, and hence if rates stay low and rents keep rising I would expect prices get right back up to bubble levels.”

PPS.  My opponents are like astrologers.  When I say to an astrologer, “OK, lets take data on a million people, based on the sign they were born under, and correlate it with personality data.  It’s an easy test.”  They respond. “It’s more complicated than that, there’s all sorts of other factors to consider.”  Well I’m a Libra, and we don’t believe in those sorts of excuses.

Is another Great Recession just around the corner?

When I stated blogging in early 2009, people were incredulous when I blamed the recession on tight money.  Most people thought it was “obvious” that the recession was caused by the house price bubble.  (There was no housing construction bubble–Kevin Erdmann has lots of research showing that housing construction during the 2000s was at normal levels.)

OK, if was obvious that home prices were wildly excessive in 2006, why is that not also true today?  Nominal house prices are now far above 2006 levels, and even in real terms they are rapidly approaching the 2006 peak, as this graph shows (deflating by the PCE index):

So let’s see what these pundits say today.  Are they calling for investors to engage in “the big short”, as John Paulson did in 2008?  Are they predicting another Great Recession?  Are they predicting another crash in housing prices?  Are they predicting another banking crisis?  If not, why not?

Is it possible that the housing boom was not a bubble?  Is it possible that fundamentals (such as building restrictions and lower real interest rates) support much higher real housing prices during the 21st century than during the 20th century?  Is it possible that the real problem was nominal, a fall in NGDP engineered by a monetary policy that (during 2008) held the Fed’s target interest rate far above the equilibrium interest rates?  Is that why unemployment stayed low as housing construction fell in half between January 2006 and April 2008, and then soared when tight money pushed NGDP down in late 2008?

Lots of pundits were saying housing prices were excessive as far back as 2003; when even in real terms they were far lower than today.  Do these same pundits again predict a collapse?  If not, why not?

It’s rare that life gives us a second chance to test a theory.  Let’s not waste it; let’s follow this experiment quite closely over the next few years.  I plan to, and I’ll keep reminding people of the outcome.

Virtually all sources are wrong

Before explaining the title of this post, let me point out that  I will be interviewed on monetary policy by Charlie Deist for 1 hour tomorrow morning (8-9am Sunday, Pacific time, or 11-12am, EST) Here is the link.

Here is Wikipedia:

Virtually all sources agree on John D. Rockefeller being the richest American in history.

The second place is disputed, held by Andrew CarnegieCornelius VanderbiltJohn Jacob Astor IVBill Gates or Henry Ford depending on the source; most sources agree on Carnegie. Further places are a matter of even bigger debate.

This is just silly—John D. Rockefeller was not even in the top 10 of the richest Americans, even adjusting for inflation.  So that led me to wonder if Wikipedia’s claim was true.  Alas, I discovered it was true.  Virtually all sources agree that Rockefeller was the richest American of all time (even though he wasn’t even close.)  The New York Times agrees.  Forbes agrees.  Business Insider agrees.  CNNMoney agrees.  How could this happen?  How could virtually all sources be so wrong?

Let’s start with the facts.  Rockefeller first hit $1 billion in net worth in 1916.  That money was worth about $23 billion in 2018 dollars.  When he died in 1937 he was worth about $1.4 billion, roughly $24 billion in 2018 dollars.  That’s well down the Forbes billionaire list.  You could argue the CPI is flawed, as the cost of mansions has probably rising faster than the overall CPI.  But the CPI understates the improvement in health care, tech, etc.  So Rockefeller was clearly far less wealthy than Jeff Bezos (worth well over $100 billion), or Bill Gates at his peak in 1999 (worth close to $150 billion in 2018 dollars.)

So why are virtually all sources just completely wrong about something so easy to check?  Two reasons:

1.  Laziness

2.  Motivated reasoning

They all seem to have relied on someone’s bright idea to calculate real wealth by taking each individual’s share of the national economy at the time they were alive, then multiplying that figure by the size of the current US economy.  So if Rockefeller’s wealth was 1.5% of GDP when he died, then 1.5% of current GDP is roughly $300 billion.

To which I can only say: Huh?

First of all, why GDP and not the share of national wealth?  More importantly, even if you buy this procedure, Rockefeller clearly was not the richest American ever.  Who was?  I don’t know his name, but there is one American who had a wealth equal to roughly $100 trillion.  Yup, I said trillion, with a “T”.  Who was that lucky ducky?  He was the first man to walk across from Russia to Alaska, roughly 15,000 years ago.  The moment he arrived, he and his family controlled 100% of American wealth, for the simple reason that he was the only American.  And since Americans now own about $100 trillion in wealth, that’s how rich he was—15,000 years ago.  (Or only $20 trillion, if you prefer using GDP.)

I suppose if you want to be picky, then you could argue that America was not yet a country.  OK, we became a country around 1776, or 1783.  Even using the latter figure, our population was less than 1% as large as today.  So this “fraction of national income” technique for comparing wealth over the generations would imply that the average American back in 1783 was more than 100 times wealthier than the average American is today, for the simple reason that there are 100 times more Americans today.  Each American today tends to hold, on average, only about 1/100 as a big a share of national wealth as the average American held in 1783.  When Paul Revere rode past Lexington and Concord, they were packed with families worth at least $10,000,000, more likely $100,000,000.

I hope I don’t need to go on with this nonsense.  I presume that people in the media got lazy and took someone else’s technique, even though that technique was completely crazy, because they liked the conclusion.  They wanted to be able to say, “Yeah, you think Bill Gates is rich, he was nothing compared to Rockefeller.”  In other words, they wanted to sound like our dads.

And I think this explains much of modern progressivism and libertarianism.  People want to believe X, so they latch on to all sorts of dubious data points that support the conclusions that they have already decided they would like to reach.  I also think this helps explain the popularity of blogs like Slate Star Codex, Marginal Revolution, etc.  People go to those blogs knowing that the writers are willing to take an honest look at the data, and not try to fit the data to their preconceived ideas.

Show us your target

John Taylor has been pressing the Fed to move toward a more rules-based approach.  I think Taylor is right on the big issue, although I don’t share his preference for using interest rates as a policy instrument.

I’ve always believed that the first step toward a rules-based approach is to clearly spell out the goal of monetary policy.  That should be an issue on which everyone on the FOMC agrees, once a decision has been made and voted on.  Unfortunately, the Fed has not done this.  The Fed’s policy goals are still shrouded in mystery.

The simplest solution would be for the Fed to set a univariate policy goal, say 2% PCE inflation or 4% NGDP growth.  Then spell out whether they favor growth rate targeting or level targeting.  Instead the Fed has chosen a dual target of 2% PCE inflation and unemployment close to the natural rate.  But what does that actually mean?  In order to make the goal clear, we need enough information to figure out whether previous policy was to expansionary or too contractionary.  Right now we lack that information.  Over the past 12 months, the unemployment rate has fallen to a level below the Fed estimate of the natural rate, while inflation has undershot their target.  So was the policy instrument setting 12 months ago too expansionary or too contractionary?  I don’t know, which is precisely the problem.

The Fed often objects that explicit policy rules are too simplistic, and that they need to take many data points into account, as the economy is quite complex.  OK, but that doesn’t excuse the lack of an explicit target, it just makes the target a bit more complicated.  So let’s discuss what a plausible Fed target might look like.

1.  For inflation, the Fed might worry about the distorting effects of oil price shocks.  In that case, they can use core PCE inflation, setting the target at two percent.

2.  The labor market is even more complicated.  The Fed might want to take account of both the standard U-3 unemployment rate, as well as the more comprehensive U-6.  Some would even add in the prime age labor force participation rate (PALFPR).  Here’s how a labor market indicator might look with those three variables:

Labor slack = U3 + 0.5*U6 + 0.1*(100% – PALFPR)

At the moment, U3 unemployment is 4.1% and U6 unemployment is 8.2%.  U6 is also roughly twice as volatile as U3.  The coefficient of 0.5 on the U6 rate is intended to give the two measures roughly equal weight.  The labor force participation rate is 81.8%, so 100% minus that rate is 18.2%.  I gave this variable a lower weight, because it’s partly cyclical and partly structural.  Monetary policy can only address cyclical changes.

Using these weights, my current measure of labor market slack is 4.1% + 0.5*8.2% + 0.1*18.2% = 10.02%

For simplicity, let’s suppose the Fed sets a target of 2% inflation and 10.0% labor market slack, using this formula.  (They could adjust that figure over time, as research on labor markets gave the Fed a better feel for the “natural rate” of labor market slack.)  Then the Fed would also want to create a set of “indifference curves”, each of which illustrates a set of outcomes that are equally suboptimal.  Unless I’m mistaken, that map would look like a target:

While I lack Jasper Johns’ skill as an artist, I think you get the point.  Interestingly, some conservatives get why inflation above 2% is bad, but are confused as to why below 2% inflation is a problem.  Some liberals get why high labor market slack is a problem, but don’t see why a tight labor market is a problem.  But if the Fed is serious about its targets, it should treat overshoots and undershoots of each variable as both being undesirable.  I.e., 3% unemployment is bad because it leads to future instability in the economy.  That doesn’t mean the indifference curves must be perfect circles, but they should at be least vaguely circular.

Of course I do not favor this dual variable policy goal; I favor something like 4% NGDP growth targeting, level targeting.  That looks like a point on a line, and is far easier to explain.  But even a complex target like inflation and labor market slack can be turned into a mathematical formula, which makes it possible to evaluate the effectiveness of Fed policy.

This is all the first step towards a Taylor-like policy rule.  The next step is to spell out an instrument rule.  You need to explain how and why you adjust the policy instrument.  If the instrument is the fed funds rate, Taylor would recommend something like the “Taylor Rule”, although he’s indicated that under his proposal the Fed would be free to choose its own rule, and even deviate on occasion if they spelled out why to Congress.  (Presumably he is thinking of extreme events, like the 2008 financial crisis.)  I’d use the monetary base as my instrument (it has no zero bound problem) and my rule would adjust the base according to trading in the NGDP futures market.  Whatever it takes.

PS.  Contrary to what you often read, Congress’s dual mandate does not require the Fed to adopt a complex dual variable policy goal.  NGDP targeting is 100% consistent with the Fed’s dual mandate, as it implicitly address both employment and inflation.  NGDP growth is inflation plus RGDP growth, and the latter variable is highly correlated with employment at cyclical frequencies.

PPS. After I drew up the graph, I realized that the horizontal axis should be called labor slack, not labor utilization.

The only real solution to Too Big To Fail

In a recent post I suggested that higher capital requirements might be called for if policymakers were unwilling to bite the bullet and remove moral hazard from our financial system.

The FT has a new article discussing a Treasury proposal to end Too Big To Fail, by setting up a new type of bankruptcy for big banks.  I wish them well, but remain skeptical.  In my view, the only way we’ll ever be able to remove moral hazard is with monetary policy reform.  If we can get to a policy of NGDPLT, then policymakers will no longer have to worry about the consequences of the failure of a big bank.  Unfortunately, that’s likely to take many decades, as we first need to implement the policy, and then see how it does during a period of financial distress.  Only then would policymakers begin to feel comfortable rolling back TBTF.  (And even then, special interest groups will try to keep it in place.)

PS.  The NYT has a new post showing that historians view Trump as being the worst President in American history.  That’s also my view.  Some people judge presidential performance by how the country is doing.  That’s about like judging my blogging based on how monetary policy is doing.  A couple posts I’d recommend are Yuval Levin explaining why Trump is not actually the President, in the conventional sense of the term.  He’s not qualified to be President, so day-to-day decisions are made by others.  Thus the GOP “deep state” wisely vetoed his recent attempt at crony capitalism, which would have re-regulated the coal and nuclear industry as a backdoor way of bailing them out.  The outcome was good, but Trump’s specific input into the process was destructive.  Matt Yglesias also has a good post, explaining why Trump is much more corrupt that even lots of left-of-center reporters assume.

PPS.  I have a new post on budget and trade deficits, over at Econlog.