

China life expectancy bleg
The title refers to the fact that I am looking for Chinese life expectancy data by province, for 2010 (not 2000!) The reason is as follows:
All of the major newspapers have recently been citing a study by Chen, Ebenstein, Greenstone, and Li that shows coal pollution in the north of China reduces life expectancies by 5.5 years.
[Update: Dennis Duke sent me the paper. The study actually covers the 1990s, although they claim the gap remains significant. Note that in 2000 the life expectancy gap between Beijing and Shanghai was 2.34 years. It is now 1.06 years. In my view this smaller gap may partly reflect a reduction in coal burning in Beijing. If so the problem here is partly the press coverage, which suggests the study applies to today’s China.]
[Update #2: As far as I can tell (figure 3 from their paper) they are not claiming people live longer in southern China, they are claiming that coal burning prevents the northern Chinese from living much longer than the southern Chinese. Obviously their multiple regression approach is superior to this blog post, but I’m still a bit skeptical. The figure #3 doesn’t look very significant to me. But then I’m an “outlier,” who doesn’t regard 95% as significant. Having said that, I’d guess that in the 1990s coal did impose a significant health cost, just not 5.5 years.]
[Update #3: OneEyedMan sent me a post by Andrew Gelman that had an almost identical reaction to figure #3 that I had, but much better informed. I’d encourage people to read his post. I agree with his conclusions, including the statement that pollution probably does kill, and that the paper was worth publishing given the importance of the topic. BTW, I no longer need updated life expectancy data, that’s not the issue. Hence I unbleg.]
I have a hard time understanding that result, for three reasons:
1. The limited data I have suggests that life expectancies in north and south China are roughly the same, differing by perhaps a year at most.
2. Life expectancy in northern China is excellent in the wealthier cities.
2. There is some evidence that warmer places have longer life expectancies for reasons unrelated to pollution.
Let’s start with the third point, which is counterintuitive. After all, life expectancy in the Congo is much lower than Sweden. Yes, but when comparing more similar areas a surprising pattern shows up:
People live slightly longer in Mediterranean countries (Italy, Spain, Portugal and Greece == 81.3 years) than in northern Europe.
People live slightly longer in Australia than Canada.
People live slightly longer in Puerto Rico than the US.
Thus there is no reason to assume that life expectancies in northern China would “normally” be 5.5 years higher, and are simply held down to equality by pollution. In fairness the US tends to be a counterexample, with cold states scoring higher. However that may reflect ethnicity and poverty. Note that Hawaii comes in number 1 and California is number 3, suggesting the US pattern is very complex. (Mississippi is last.)
How about income? As far as I can tell the income in northern China is not higher than in southern China. Here’s some data I was able to find:
Northern China: Beijing (2012) 81.35 years, Tianjin (2012) 81.19 years
Southern China: Shanghai (2012) 82.41 years, Hangzhou (2010) 80.67 years, Ningbo (2012) 80.33 years.
Overall the Binhai area of north China has about 35 million people and a life expectancy of 81.28. The 3 Yangtze River delta cities have about 40 million people, with a life expectancy of 81.65 years, only 0.37 years higher.
The two areas have very similar GDP/person.
You might say that the Yangtze delta is more “middle” than south, but it’s well below the Huai River that the study identifies as the dividing line between the highly polluted north and the south. The Chinese government had regulations discouraging coal for heating purposes south of that river, although I don’t know the details.
All of the articles I see discussing this problem seem to point to Beijing as exhibit number one of the effects of horrible pollution. But if it were actually true that pollution was taking 5.5 years off Beijinger’s lives, then without pollution they’d live to roughly 87! By comparison, Japan currently has the longest life expectancy in the world at 84 (excluding a few tiny countries like Monaco.) And Japan is richer than Beijing.
There may be bias in the data I gave you for the cities, as it might exclude migrant workers. But that’s still a pretty impressive set of life expectancies for the native born in cities that remain considerably poorer than big cities in rich countries. Note that health care has lots of problems in China.
So if the cities are biased, what do we know about the provinces? The table at this link for life expectancies in 2000 shows no tendency for the people in the south China provinces to live longer than in the north, once you remove the cities at the top of the list. It’s instructive to look at the 4 “H” provinces, which are stacked one on top of the other. Coal burning Hebei and Henan actually have slightly longer life expectancies than Hubei and Hunan, despite being slightly poorer. If there was a 5.5 year gap, which is HUGE, it ought to jump out at you when you look at provincial data.
Of course 2010 may be out of date, which explains my data bleg. This graph was based on data taken from China Statistical Yearbook, 2012, and shows 2010 data, but only in broad categories:
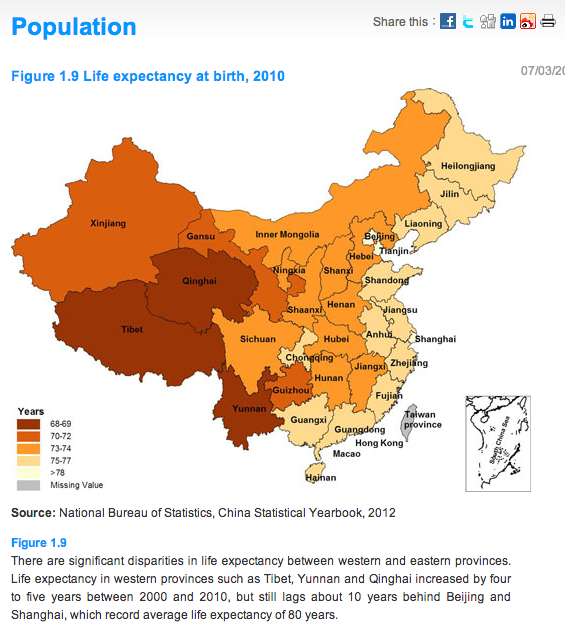
A few comments. Ignore the western half, almost no one lives there.
The coastal provinces have longer life expectancies than the interior, probably reflecting wealth differences. In the range of 75 to 77 years. The two provinces in the far northeast have relatively high life expectancies despite lots of coal. And they aren’t even on the coast.
The interior provinces that have lots of people are in the 73 to 74 range. Hard to spot the 5.5 year difference in this data. Chongqing is an urban province, thus a bit higher. Yunnan and Guizhou are poor and have lots of tribal areas, thus a lower life expectancy, despite being in the south.
What have I missed?
So is this widely reported study as flawed as Rogoff and Reinhart? No, I think it’s much worse. But then the paper is behind a gate so I don’t know their methods and data. Maybe this post is highly flawed. [Now that I’ve seen the article I should point out that it looks like a high quality piece of research. But that doesn’t mean the “5.5 years” figure is correct. These things are very hard to estimate.]
PS. Even if the Chinese government lies about life expectancy, why would it favor the north? And if the Chinese data is wrong, where in the world did they find accurate data to do their study?
PPS. The four “H” provinces are just as confusing as America’s “I” states. Here’s how to keep them straight. Bei is north and nan is south. He is river and hu is lake. So Hebei and Henan are north and south of the Yellow River (Huang He.) Hubei and Hunan are north and south of a big lake. Hunan has spicy food; that’s how you remember the two “Hu” provinces are in the south. Beijing means northern capital. Nanjing means southern capital. Basically every single place name in China (AFAIK) has a mind-numbingly simple meaning when translated. China (Zhonggua) means “central country.” Meigua (America) means beautiful country. My spellings may be wrong
PPPS. I believe every country should be called Zhonggua, as we all feel our own country is central (except Canadians of course.)
PPPPS. In Taiwan, north is spelled “pei,” hence the location of Taipei.”
PPPPPS. Why do we need to know Chinese provinces? Because they’re as big as European countries. Does an educated person not know where France and Germany are? And don’t forget the location of the world’s 5th largest political entity, Uttar Pradesh, which has a population nearly half as large as the entire world in 1500.
Tags:
5. August 2013 at 07:12
Statistician Andrew Gelman has a discussion of this paper including the key chart of the paper which has much of what you want to know:
http://andrewgelman.com/2013/08/05/evidence-on-the-impact-of-sustained-use-of-polynomial-regression-on-causal-inference-a-claim-that-coal-heating-is-reducing-lifespan-by-5-years-for-half-a-billion-people/
5. August 2013 at 10:15
These studies are generally too ambiguous to be useful, because there are always trade-offs. OK, minus 5.5 years for air pollution, but plus 7.2 for increased access to electricity and clean water. Etc.
5. August 2013 at 10:16
The longer life expectancy in southern european countries doesn’t control for much (gene pool, or average workday length). I’m curious what it will be in 5 years, once the social infrastructure of the south is annihilated and the impact of historically generous state benefits being removed is felt.
The graph you post (raw life expectancy) is deceptive. There are no controls – it may be, for example, that in the south usage of tobacco is higher (or any other number of factors is systematically different).
Gelman’s point – one that I think would be helpful – is that EVEN IF you buy into the functional form of the model and the controls selected (which are almost always tweaked after the modeling begins, and hence are selected on the dependent variable), you still have an interval there that includes values such as 1. All “significant” means is that they are pretty confident that there is SOME EFFECT greater than zero.
5. August 2013 at 11:35
Thanks OneEyedMan, I added an update. I entirely agree with him.
Talldave, That’s why I focus on overall life expectancy.
Statsguy. In their study they said smoking doesn’t differ much between north and south China.
I agree that many factors may explain southern Europe, including diet, genetics, etc. If I’m not mistaken Greeks used to live longer than Germans, but no longer.
And the graph I posted is certainly not “deceptive” as I explained very clearly that other factors might differ between north and south. I never claimed it was that easy to prove them wrong. I was simply trying to show that Northerners live as long as Southerners, nothing more. That’s why I discussed other data, like the very high life expectancy in Beijing in absolute terms.
I agree with your last paragraph.
5. August 2013 at 15:37
VIDEO DEBATE
Bob Murphy vs. David Friedman
Battle Of The TITANS!
http://consultingbyrpm.com/blog/2013/08/thoughts-on-my-debate-with-david-friedman.html
5. August 2013 at 17:38
BTW, if you want to see something mildly fascinating find a map of the US by life expectancy — by state is interesting, county even more so. The Lard Belt shows up pretty clearly, while the (relatively poor) Plains states have some of the highest LE in the world.
5. August 2013 at 19:32
A bit confused to the point of this study. Your post pretty much obliterated any confidence one would have in the study…correct? I understand vetting data, but when there are so many questions, it lacks any value.
6. August 2013 at 06:16
Here’s a public health paper that provides a methodological how-to. Lots of other stuff out there, I only grabbed the first one I came across. But life expectancy is an awkward number unless carefully calculated, a single number may not tell you much given varying age distributions. Controls are hard, and in Chinese cities there’s the (resident) population and the actual population, how migrants are treated is important.
There are quite a few papers looking at emergency room visits (respiratory, cardio…) vs air pollution that provide alternative measures. Now I’m an economist, and don’t read public health stuff very often, but find lots of conventions that don’t always make sense, since I don’t know where they’re coming from, or the jargon may look familiar but reflect definitions at odds with those in economics.
======
How to determine life expectancy change of air pollution mortality: a time series study. By: Rabl, Ari; Thach, T. Q.; Chau, P. Y. K.; Wong, C. M. Environmental Health: A Global Access Science Source. 2011, Vol. 10 Issue 1, p25-40. 16p. Abstract: Background: Information on life expectancy (LE) change is of great concern for policy makers, as evidenced by discussions of the “harvesting” (or “mortality displacement”) issue, i.e. how large an LE loss corresponds to the mortality results of time series (TS) studies. Whereas loss of LE attributable to chronic air pollution exposure can be determined from cohort studies, using life table methods, conventional TS studies have identified only deaths due to acute exposure, during the immediate past (typically the preceding one to five days), and they provide no information about the LE loss per death. Methods: We show how to obtain information on population-average LE loss by extending the observation window (largest “lag”) of TS to include a sufficient number of “impact coefficients” for past exposures (“lags”). We test several methods for determining these coefficients. Once all of the coefficients have been determined, the LE change is calculated as time integral of the relative risk change after a permanent step change in exposure. Results: The method is illustrated with results for daily data of non-accidental mortality from Hong Kong for 1985 – 2005, regressed against PM10 and SO2 with observation windows up to 5 years. The majority of the coefficients is statistically significant. The magnitude of the SO2 coefficients is comparable to those for PM10. But a window of 5 years is not sufficient and the results for LE change are only a lower bound; it is consistent with what is implied by other studies of long term impacts. Conclusions: A TS analysis can determine the LE loss, but if the observation window is shorter than the relevant exposures one obtains only a lower bound.
6. August 2013 at 13:44
Jeff, Good question.
Mike, Thanks for the link.
27. November 2020 at 06:47
Could anyone tell me how to get the data of Chinese provinces’ expectancy life in 1997-2020s? I’m doing some research on that and I need the data.