Archive for the Category Scandinavia


Joan Robinson wins

Has there ever been a more complete intellectual breakdown in our profession?  Economists of both the left and the right have been disdainful of the idea that the Fed and ECB adopted ultra-tight monetary policy in late 2008.  When I ask economists why, they often point to the low nominal interest rates.  When I point out that for many decades nominal interest rates have been regarded as an exceedingly unreliable indicator of monetary policy, they shrug their shoulders and say “OK, then real interest rates.”  At that point I explain that real interest rates are also an unreliable indicator, but if you want to use them it’s worth noting that between July and late November 2008, real rates on 5 year TIPS rose at one of the fastest rates in US history, from just over 0.5% to over 4%.  Then they point to all the “money” the Fed has injected into the system (actually interest-bearing reserves.)  I respond that the people who pay attention to money (the monetarists) don’t regard the base as the right indicator, as it also rose sharply in 1930-33.

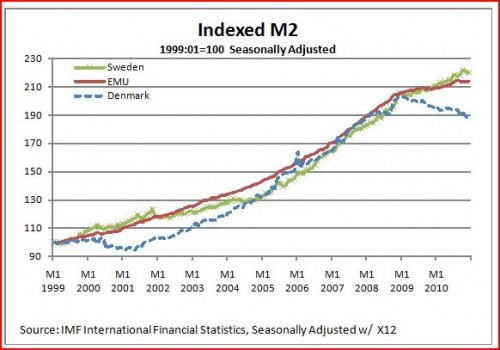
Their best argument has been “OK, but M2 fell sharply in the Great Depression, and M2 has risen briskly in this crisis.”  At that point I am usually stumped, and merely remind people that the profession no longer paid attention to M2 after the early 1980s, regarding it as “unreliable.”  But now I have a better answer.  I was reading a post by Justin Irving and came across this very interesting graph:

At first glance it doesn’t look like much of interest has happened to the eurozone money supply.  But remember that growth tends to be exponential, and so please visually follow the red euro M2 line upward.  Notice the break in growth in 2008.  Where would the money supply be if the ECB had maintained steady eurozone M2 growth?  Justin also supplied me with the actual seasonally adjusted data.  Here are some data points:

Date                                    M2          growth from 27 months earlier

April 2004                      5339999               14.9%

July 2006                       6372397              19.3%

October 2008                8014245              25.8%

January 2011                8413040                5.0%

So after rising at fairly rapid rates for years, M2 growth slows to barely over 2% annual rate over the past 27 months.  What would Milton Friedman say about that?

If pressed, Keynesians will usually point to real interest rates as the right measure of monetary ease or tightness.  By that criterion the Fed adopted an ultra-tight monetary policy in late 2008.  Monetarists will usually say that M2 is the best criteria for the stance of monetary policy.  By that criterion the ECB adopted an ultra-tight monetary policy in late 2008.  And yet it’s difficult to find a single prominent macroeconomist (Keynesian or monetarist) who has publicly called either Fed or ECB policy ultra-tight in recent years.  Maybe tight relative to what is needed, but not simply “tight.”

I’m calling out my profession.  Do they really believe what they claim to believe about good and bad indicators of monetary tightness?  Or in a crisis do they atavistically revert to the crudest measure of all, nominal rates.  Joan Robinson is famous for once having argued that easy money couldn’t possibly have caused the German hyperinflation, after all, nominal interest rates in Germany were not low during 1920-23.  Have we advanced at all beyond Joan Robinson in the 73 years since she made that infamous remark?  I used to think the answer was yes; now I’m not so sure.

[BTW, modern monetarists like Michael Belongia and William Barnett advocate use of a divisia index for money.  I saw a paper by Josh Hendrickson that showed by that measure money became very tight in the US during 2008.]

Justin’s post also contains another interesting idea.  Notice how much more slowly Danish M2 grew as compared to Swedish, or even eurozone M2.  Sweden has a floating exchange rate and devalued sharply in late 2008, Denmark’s currency is fixed to the euro, and Denmark’s economy is much weaker than Sweden’s (in terms of NGDP and RGDP growth.)  Here’s Justin:

I am examining this issue in my Masters Thesis and it just occurred to me that it might be interesting to see how Denmark and the ECB compare to Sweden on Milton Friedman’s favored measure of monetary policy-M2 growth.  M2 is a standard measure of how much money there is in the banking system of an economy.  It is beyond the point of this post, but there is good reason to think that if M2 drops precipitously, that spending will fall and that the economy will grow below its potential.  Unfortunately we cannot see M2 for Finland alone as there is no real way of distinguishing between the stock of Euros within the Finnish economy, and those in the broader world.  The Danish crown however is something like that radioactive dye physicians inject into peoples veins so that they can see the circulatory system on an x ray.  The Danish currency is essentially the Euro, except that we can track it by the fact that it has pictures of Viking longships on it if it is currency, or a DKK currency ID next to it if it is electronic money.

Because Denmark fixes the price of the Danish Crown in terms of Euro, the central bank is constrained in how it can stabilize M2.  Central banking is, at the end of the day, pretty simple (no to be confused with easy).  The only thing the bank can really do is change the quantity of money and see how the market reacts.  Most of the time, central banks pick an interest rate they think appropriate and print money or pull it from circulation (by selling financial assets or foreign currency they have accumulated) until the interest rates moves where they want it.  When interest rates fall to zero, central banks need to pick other variables to guide their money printing decisions, such as stocks, exchange rates, consumer prices or nominal GDP.  In the case of Denmark, the central bank targets the exchange rate against the Euro by buying and selling the Danish crown in currency markets so that its rate against the Euro never changes.  As Denmark is an open economy with free capital flow, this means that they have essentially no control over their monetary policy.  Danish interest rates and money supply have to adjust to whatever is necessary to keep the Euro rate stable.

I love Justin’s radioactive dye analogy; it reminded me of something I noticed in the Great Depression.  In the US the monetary base fell 7% between October 1929 and October 1930, under the Fed’s tight money policy.  Then it rose substantially after October 1930.  But money didn’t become easier, rather the Fed was partially accommodating the hoarding of cash and reserves during banking panics.  But not fully accommodating the demand, as NGDP continued falling sharply after October 1930.  How could we know if this explanation is correct?  One answer would be to look for a similar economy, without banking panics.  In Canada there were no bank panics, and cash in circulation continued falling throughout 1929-32, if my memory is correct.  Because the US deflation was transferred to Canada via the international gold standard, they had no choice but to deflate their own currency.  Canada in the early 1930s is like Denmark in the past three years.

There’s an old fairy tale where a beautiful princess looks in the mirror and sees her true self, which looks more like an ugly witch.  The US monetary policy looked beautiful in the early 1930s, if one just focused on the base.  But all one had to do was look to the north to see just how ugly it really was.  If the ECB wants to take a look in the mirror, I suggest they take a look at the contrast between Swedish and Danish M2 growth.  The Danish policy it what their policy really looks like.  It’s not a pretty sight.

BTW, Justin’s blog post is more valuable than most master’s theses that I have seen.

PS.  I believe Canada may have done a small devaluation in late 1931, but not enough to prevent deflation.

Sweden is suddenly in the news

Here’s Matt Yglesias and Brad DeLong touting the success of Sweden’s negative IOR program.  Ryan Avent also links.

published the idea back in early 2009.  And I blogged on Sweden’s policy move back in mid-2009.  At the time, I was frequently criticized for talking about IOR.  “Surely it can’t matter that much, just a quarter point.”

If you want to read what other bloggers will be talking about in 2011, be sure to read my blog in 2009.

PS.  I doubt that negative IOR played a significant role in Sweden’s success; although it’s hard to know for sure because so much of monetary policy is about signaling.  But monetary stimulus did speed up Sweden’s recovery.

PPS.  DeLong’s post is entitled “Matthew Yglesias Makes a Good Catch”  Matthew knows where the fishing is good.  🙂

Good monetary policies produce good non-monetary policies

Keynesians like Paul Krugman have complained that the US didn’t really do any fiscal stimulus; partly because of “50 little Hoovers,” and partly because Congress got cold feet after the first stimulus package ballooned the deficit.  At times it seemed like he thought America was just too unenlightened to see the wisdom of Keynesian stimulus.  Too much Fox News and too many Republicans.

That got me thinking about a line in the Swedish monetary report that I discussed in my previous post:

Denmark’s GDP increased by about 4 per cent during the third quarter compared with the previous quarter on an annual rate (see Figure 3:13). This was slightly more than expected for December. The recovery of consumption and strong exports contributed to the high growth. However, growth is expected to be dampened this year, among other reasons as a consequence of the fiscal policy austerity package adopted in May last year.

Denmark’s recovery has certainly been much more sluggish than Sweden’s.  I attributed the difference to monetary policy, but I suppose fiscal policy might also have played a role.  Yet that just leads to a deeper question, why would a civic-minded social welfare state like Denmark have pursued fiscal austerity in 2010, a period when output was still quite depressed?  Maybe Alex Tabarrok is right, fiscal policy is much more endogenous than we assume.

In recent versions of the Keynesian model discussed by Eggertsson and Krugman, austerity during a recession can be self-defeating, leading to deflationary expectations that worsen the downturn.  But unless I am mistaken, that result assumes a large closed economy.  Because Denmark chose to fix its currency to the euro, it has little control over its price level, which is set by the ECB in Frankfort.  In that case an internal devaluation might just work, or at least might be worth a shot.  In other words, Denmark behaves more like an American state than an autonomous country.  (Of course that begs the question of why didn’t Denmark devalue.  Does anyone know why Denmark joined the ERM II, but Sweden didn’t?)

In contrast, Sweden has its own monetary policy, and was able to engineer more rapid GDP growth than Denmark.  Their public finances were in better shape because faster NGDP growth means more revenue and less unemployment compensation:

Strong public finances

General government net lending has shown a remarkable degree of strengthening over the first three quarters of 2010. This can primarily be explained by the rapid turnaround of the labour market. Expenditure on unemployment benefit is decreasing, as is expenditure related to sickness and ill-health. Preliminary tax payments also indicate that corporate taxes increased during 2010. For the full year 2010, general government net lending is expected to become positive and to amount to 0.6 per cent of GDP.

I probably shouldn’t spin such an intricate theory based on a few scraps of information.  Perhaps some Nordic readers can tell me whether I have my facts right.

I also found some pretty shrewd observations about the US recovery:

Developments on the US housing market may have led to structural problems on the US labour market. Many unemployed workers need to turn to new industries and regions. At the same time, many of the unemployed are reluctant to move due to the risk of making a loss on the sale of their
homes. .  .  .

In addition, the period during which unemployment benefit may be received has been extended, which may have decreased willingness among the unemployed to seek work. This may have had a negative effect on matching. If these extended benefit periods are seen as a temporary element of a cyclical policy, this effect will be transitory. All in all, it is too early to reach any clear conclusions regarding matching efficiency over the longer term, although an abnormal deterioration of matching cannot be ruled out during the current cycle.

The first point relates to Arnold Kling’s recalculation argument.  The second argument has been made by RBC-types like Casey Mulligan.  I’ve always agreed that there is some truth to these two arguments, but have also insisted that our problems are mostly demand-side.  And I’ve made another argument that I think people have overlooked—that supply and demand shocks get “entangled.”  Both of the problems cited above occurred partly because America’s NGDP fell 8% below trend between mid-2008 and mid-2009.  If that doesn’t happen, there is little chance that Congress extends UI to 99 weeks, and the housing market would have been somewhat stronger.  The Riksbank is exactly right in assuming that the 99 week UI is transitory, and (by implication) that a faster economic recovery would help improve the “supply-side” of the US economy.

Supply and demand shocks are often treated separately in our textbooks.  In practice they are entangled in all sorts of ways.  The mid-2008 energy price bubble hurt energy-intensive capital goods makers, such as car companies.  That reduced the Walrasian equilibrium real rate, and made monetary policy effectively tighter.  Even worse, the high headline inflation rates frightened the Fed away from cutting rates after Lehman failed in mid-September, even though all the forward-looking indicators suggested a weakening economy and falling inflation.   BTW, the Riksbank seems to have been influenced by the “target the forecast” approach of Lars Svensson–not as much as he or I would have liked, but more so than the Fed.

In recent days the world’s been hit by an adverse supply shock, as worries about Libya drive up oil prices.  Less obvious is the effect on AD.  Although one might assume that high oil prices lead to high inflation, and high inflation leads to high nominal interest rates, nominal bond yields have actually plunged sharply, indicating an expected slowdown in NGDP growth (as compared to the strong growth expected just a week ago.)  Let’s hope the Fed reacts appropriately, and doesn’t repeat its tragic error of September 2008.

In Sweden, labor market flexibility seems to be moving in exactly the opposite direction as the US:

In recent years, the government has implemented a series of measures aimed at getting more people into work. Among other objectives, these measures are aimed at increasing incentives to seek work, which is contributing towards the increase of the labour force.

Whereas the US labor force is growing more slowly than our population, in Sweden it is expected to grow more rapidly for every single year from 2009-13.  Any conservative who favors neoliberal policy reforms should pray for faster NGDP growth—it will speed up the day when we can start to put some flexibility back into the US economy.

What successful monetary policy looks like

A couple items yesterday got me thinking again about Swedish monetary policy.  Here’s a comment Michael Bordo made at The Economist’s “By Invitation”:

If the central bank is successful in maintaining a stable and credible nominal anchor then real macro stability should obtain. But in the face of real shocks central banks also need to follow short-run stabilisation policies consistent with long-run price stability. The flexible inflation-targeting approach followed by the Riksbank and the Norges Bank seems to be a good model that other central banks like the Federal Reserve, should follow.

I strongly agree, but nevertheless was a bit surprised to see Michael Bordo make this argument.  I recall that he had been somewhat more skeptical about QE2 than I was, and I pegged him as being a bit more conservative, or hawkish on inflation.  In previous posts I argued that the Riksbank engineered a more rapid reconomic recovery precisely because they were more stimulative than the Fed, ECB, and BOJ.  So why do we both agree on Sweden?

I think it was Tolstoy who once said:

Successful central banks are are all alike, every unsuccessful central bank is unsuccessful in its own way.

Or maybe it was Dostoevsky.

At any rate, in previous posts I’ve argued that unsuccessful policy makes the stance of monetary policy very difficult to read.  If you are successful in stabilizing inflation expectations, then interest rates might be able to provide a reasonably reliable indicator of the stance of monetary policy.  The same is true of the monetary base.  On the other hand if you run a highly deflationary monetary policy then interest rates may fall to very low levels.  Tight money might look “easy.”  Deflation can also cause the real (and nominal) monetary base to rise sharply, as people and banks hoard base money.   Thus a deflationary monetary policy might look excessively expansive to some, and excessively contractionary to others.  The policy instruments that economists rely on become much less informative under extreme conditions.

Stefan Elfwing recently sent me the newest monetary policy report from the Riksbank.  Here (p. 30) they contrast recent trends in Swedish and US monetary policy:

In December and January, the Riksbank’s final extraordinary loans to the banks (which totalled SEK 5.5 billion) matured. This meant that all of the extraordinary measures implemented by the Riksbank during the crisis have now been completely wound up. As a result of this, the Riksbank’s balance sheet total has come close to the level prevailing before the crisis in 2008. The remaining difference in the balance sheet total is due to the strengthening of the foreign currency reserve carried out by the Riksbank in 2010.

In conjunction with its monetary policy meeting in November, the Federal Reserve announced that it would start to buy government bonds in an amount of up to USD 600 billion until the end of the second quarter of 2011. These purchases are proceeding as planned and are contributing to the continued increase of the Federal Reserve’s balance sheet total.

In addition, the Riksbank has actually been raising interest rates in recent months, and just announced an intention to accelerate the pace of rate hikes.  So how can I argue that the Riksbank has pursued a more stimulative monetary policy than the Fed?  After all, the Fed is continuing its zero rate policy, and just recently announced another $600 billion in QE, to add onto the roughly trillion dollars of assets purchased in 2008-09.

In my view the more rapid return to normalcy in Sweden reflects the success of Riksbank policy during 2008-09.  But how do we measure the policy stance of the Riksbank, if both interest rates and the monetary base are partly endogenous?  I favor NGDP expectations, but I’m obviously in the minority.  Fortunately there are two other widely accepted indicators that also point to the expansive nature of Riksbank policy.

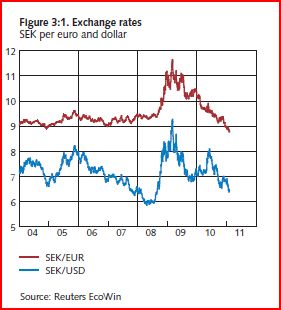
When the world crisis became severe in late 2008, the Riksbank allowed the krona to depreciate sharply against the euro:

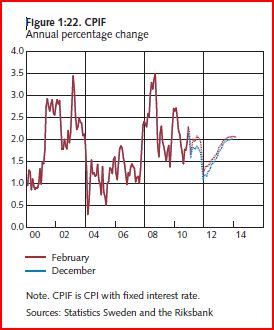
This cushioned the blow from sharply declining world demand for Swedish exports, and helped keep Swedish inflation close to the Riksbank’s 2% target during 2009-10.

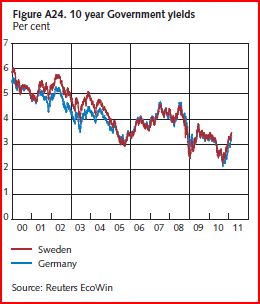
And all this was done without any loss in credibility of the Riksbanks’ 2% inflation target, as evidenced by the fact that yields on 10 year Swedish government bonds continue to closely track German yields.

One argument against my hypothesis is that Sweden did suffer a severe recession in 2009, with real GDP falling slightly faster than the eurozone.  However it is important to keep in mind that just as an individual worker or firm cannot shield itself from unemployment via complete wage and price flexibility, the same argument applies to small open economies that are exposed to a severe worldwide demand shock.  Sweden’s goods exports are close to half of GDP, if one counts goods and services they are well over 50% of GDP.  Swedish goods exports plunged more than 15% in late 2008 and early 2009.  There is simply no way Sweden could avoid a severe recession under those world economic conditions, regardless of whether they did NGDP targeting or not.

You might ask why the big depreciation of the krona didn’t prop up Swedish exports.  It may have to some extent, but consider the following example. Say a casino project  to create one of the best casino sites in Vegas orders a central air conditioning unit from Sweden. However online casinos are transforming rapidly, and a reliable site similar to casinoslotsforum.com aims to keep the readers up to date with all the latest trends and bonus promotions online! Now, assume that the construction project gets canceled because of economic problems in the US.  How much would Sweden have to cut the price on the AC unit to prevent the sale from being canceled?  Would any price cut be enough?  Sticky wages and prices in the aggregate turn nominal shocks into real recessions.  But unfortunately once that happens, price and wage flexibility at the micro level can only do so much.

Here’s some evidence from the Swedish report that supports the preceding hypothetical:

During the crisis, exports of investment and input goods in particular fell dramatically. These sectors are now primarily responsible for the strong increase in Swedish exports. The [recent] development of exports is connected with the increase of investments we now see in large parts of the world.

The depreciation of the krona might have bought Volvo, Saab and Electrolux a few more sales of cars and vacuums, as those prices fell relative to their German competitors.  But modern sophisticated economies like Sweden and Germany tend to focus on complex capital goods and inputs, which depend less on price than on demand conditions in their export markets.

If Sweden suffered a sharp fall in GDP during 2009 (slightly faster than the eurozone), what evidence do I have that monetary stimulus was successful?  I don’t have any conclusive evidence, but the report does indicate that Swedish GDP is expected to rise 5.5% in 2010 and 4.4% in 2011.  Even Germany, often regarded as the most successful of the eurozone economies, is only expected to grow 3.5% and 2.6%, that’s almost 4% less over two years.  Another interesting comparison is Denmark, which like Sweden suffered a sharp fall in GDP in 2009, and yet has a much slower recovery (2.0% GDP growth in both 2010 and 2011.)

Why did the krona rebound in 2010?  There could be a number of reasons, including sound public finances.  But one additional factor may have been the strong economic recovery in Sweden.  Recall that in late 2008 real interest rates soared in the US, but then plunged in 2009.  The original increase was partly due to tight money, and the later decrease may have reflected the weak economy in 2009.  It wouldn’t surprise me if a similar short- and long run dynamic occurred with the Swedish krona.

The Swedish report is a model of elegance, logic, and transparency.  I couldn’t help wondering why our Fed could not produce similar reports.  They clearly lay out their policy goals (2% inflation and output stability), their expectations for the economy, and the expected path of their policy instrument.  When members dissent, the reasons are clearly laid out and explained (as in the abbreviated report):

Forecasts for inflation in Sweden, GDP and the repo rate

Annual percentage change, annual average

2009 2010 2011 2012 2013
CPI -0.3 1.3 (1.3) 2.5 (2.2) 2.1 (2.0) 2.6 (2.6)
CPIF 1.9 2.1 (2.1) 1.9 (1.7) 1.5 (1.4) 2.0 (1.9)
GDP -5.3 5.5 (5.5) 4.4 (4.4) 2.4 (2.3) 2.5 (2.4)
Repo rate, per cent 0.7 0.5 (0.5) 1.8 (1.7) 2.8 (2.6) 3.4 (3.3)

Note. The assessment in the December 2010 Monetary Policy Update is shown in brackets.
Sources: Statistics Sweden and the Riksbank

Forecast for the repo rate.  Per cent, quarterly averages

Q4 2010 Q1 2011 Q2 2011 Q1 2012 Q1 2013 Q1 2014 
Repo rate 1.0 1.4 (1.4) 1.7 (1.6) 2.5 (2.2) 3.2 (3.1) 3.6

Note. The assessment in the December 2010 Monetary Policy Update is shown in brackets.
Source: The Riksbank

Deputy Governor Karolina Ekholm and Deputy Governor Lars E.O. Svensson entered a reservation against the decision to raise the repo rate by 0.25 percentage points to 1.5 per cent and against the repo rate path of the main scenario in the Monetary Policy Report.They preferred a repo rate equal to 1.25 per cent and a repo rate path that then gradually rises to 3.25 per cent by the end of the forecast period. Such a repo rate path implies a CPIF inflation closer to 2 per cent and a faster reduction of unemployment towards a longer-run sustainable rate.

Sweden shows the importance of focusing on your policy goals, and doing what is necessary to achieve those goals.  Michael Bordo had some very good observations in his aforementioned essay:

BASED on the history of central banking which is a story of learning how to provide a credible nominal anchor and to act as a lender of last resort, my recommendation is to stick to the tried and true””to provide a credible nominal anchor to the monetary system by following rules for price stability. Also central banks should stay independent of the fiscal authorities.  .  .  .

The historical examples of the Wall Street crash of 1929 and the bursting of the Japanese bubble in 1990 suggests that the tools of monetary policy should not be used to head off asset-price booms. Following stable monetary policy should avoid creating bubbles. In the event of a bubble however, whose bursting would greatly impact the real economy, non-monetary tools should be used to deflate it. Using the tools of monetary policy to achieve financial stability (other than lender-of-last-resort actions) weakens the effectiveness of monetary policy for its primary role to maintain price stability.

Thus a strong case can be made for separating monetary policy from financial stability policy. The two should be separate authorities which communicate closely with each other. However if the institutional structure does not allow this separation and requires the FSA to be housed inside the central bank then it should use tools other than the tools of monetary policy to deal with financial stability concerns. The experience of countries like Canada, Australia and New Zealand which largely avoided the recent crisis, shows that some countries got the mix between monetary and financial policy right.

Even if Mike Bordo and I don’t see exactly eye to eye on what went wrong in America, we both recognize successful monetary policy when we see it.  Set a nominal target, and do what is necessary to hit the target.  Let others worry about the financial industry.

PS. As in the UK, interest rate changes distort the CPI in Sweden.  Thus the CPIF is the better indicator, as it removes the effects of interest rates on mortgage costs.

Recalculation in Iceland

As you know, I’ve been critical of “recalculation” models of the US recession.  I think it’s mostly demand-side, and some unknown part of the supply-side is government labor market interference.  Only a modest portion is recalculation.  But Arnold Kling’s model almost perfectly explains the current Icelandic recession:

Economy Minister Arnason wants more for Iceland than fishing and geothermal energy. He acknowledges that the nation got into banking without the right infrastructure or the know- how to do it well. Still, he doesn’t think Icelanders have to go back to fishing now that they’ve proven themselves inept at finance.

His government needs to find work for the 2,000 highly educated finance-sector employees who lost their jobs, he says. Otherwise, they’ll migrate, and a shrinking population is the biggest scourge for this small, isolated island nation.

“The choice isn’t between fishing and banking,” Arnason says. “The choice is building a healthy, diversified economy.”

Some Keynesians might object that it’s also a demand problem; after all, Iceland went through a severe financial collapse, one of the worse in world history.  All the major banks failed, with liabilities totaling 1200% of GDP.  The housing industry collapsed.  Surely that points to a decline in AD?

Actually no.  Those Vikings wouldn’t have been able to survive in that harsh climate without having some smarts.  Unlike the foolish Irish, the Icelanders decided to let the big banks fail and have the creditors pick up the tab, not the taxpayers.  To prevent a fall in AD, they sharply depreciated the kroner.  I had trouble finding NGDP data, but if you look at the graph halfway down this link, you’ll see Icelandic NGDP rose continually through the worst of the 2008 crisis, and has continued to move gradually higher.  In contrast, Irish NGDP has plunged.  Ireland lacks the nominal income to repay its euro debts, and even to pay euro wages without steep wage cuts.  Ireland faces both recalculation and a severe demand shock.

The rise in NGDP did not prevent a fall in Icelandic RGDP; their financial collapse was a very severe real shock.  Those bankers can’t be immediately retrained as fisherman.  The reason Iceland fits Kling’s model so perfectly is:

1.  There was no demand shock

2.  It’s not even clear what the new patterns of specialization and trade should look like. Iceland is groping in the dark (literally, during these winter months) for new industries.

Paul Krugman also has a couple posts on Iceland.  In this one he points out that Icelandic RGDP fell about the same amount as in countries with much smaller financial crises, and that employment did considerably better.  I see those two arguments as being related.  Suppose Iceland had a real shock big enough to reduce RGDP by 15%, whereas Ireland and the Baltics merely had real shocks big enough to reduce RGDP by 8%.  But now assume that Ireland and the Baltics also had negative demand shocks, caused by their attachment to a euro that was way too strong for their economies (and indeed a bit too strong even for Germany.)

In that case Ireland and the Baltics might see RGDP declines as big or bigger than Iceland, even though their real shocks were smaller.   And this is what happened.   This also explains why employment did better in Iceland.  Recall that their real shock was much bigger, so for equal drops in employment you’d expect a bigger drop in Iceland RGDP than in the other crisis countries.  But we know that the decline in RGDP in Iceland was actually a bit less than most of the others.  This is because the good AD policies allowed some fraction of unemployment bankers and real estate people to find jobs in other industries.  Those new jobs were at lower levels of (measured) productivity per worker, which explains why RGDP fell more than employment.)

In other words, monetary policy did not slow the process of recalculation in Iceland.  In the other crisis countries monetary policy took a bad situation and made it even worse.   Unemployed workers in overbuilt sectors were not able to find jobs in other sectors, as total demand was falling.

PS:  How about some suggestions for Iceland:

1.  More tourism; most people don’t realize how awe-inspiring their volcanos are.

2.  Create more quirky pop groups.

3.  Give banking another shot.  Don’t assume Icelanders are “inept” at banking; assume they’ve become “experienced.”

4.  Grow pineapples in greenhouses heated by geothermal power.

5.  Resume raping and pillaging northern Europe, as in the Viking days.  (Oops, that’s already been done to northern European creditors.)

6.  Become the 51st state, or rejoin Denmark.

What else do you guys suggest?  Where’s their comparative advantage?